- Bellingham homes for sale
- Bellingham town homes for sale
- Blackstone homes for sale
- East Douglas homes for sale
- Franklin homes for sale
- Franklin Town homes for sale
- Hopedale homes for sale
- Hopkinton homes for sale
- Hopkinton town homes for sale
- Medway homes for sale
- Mendon homes for sale
- Milford homes for sale
- Millville homes for sale
- Northbridge homes for sale
- South Grafton homes for sale
- Upton town homes for sale
- Upton homes for sale
- Uxbridge homes for sale
- Whitinsville homes for sale
- Woonsocket homes for sale
01756, MA - homes for sale
16 of 16 results displayed
- New
 $874,900Active4 beds 4 baths3,380 sq. ft.
17 Dudley Road, Mendon, MA 01756
MLS# 73530830Listed by: ERA Key Realty Services- Milf - New
 $759,000Active4 beds 3 baths2,393 sq. ft.
13 King Philip Path, Mendon, MA 01756
MLS# 73527448Listed by: Byrnes Real Estate Group LLC - New
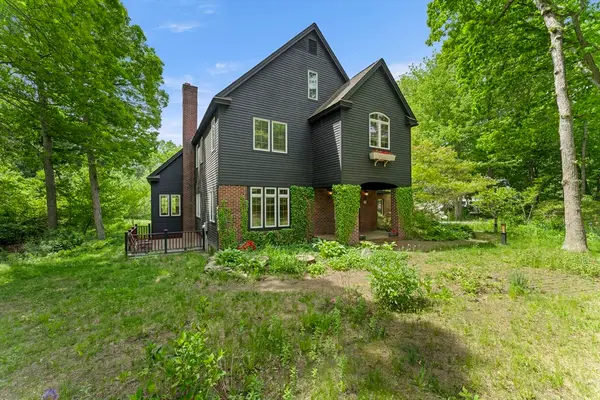 $1,299,900Active4 beds 5 baths4,338 sq. ft.
28 Vincent Rd, Mendon, MA 01756
MLS# 73526288Listed by: Better Living Real Estate, LLC 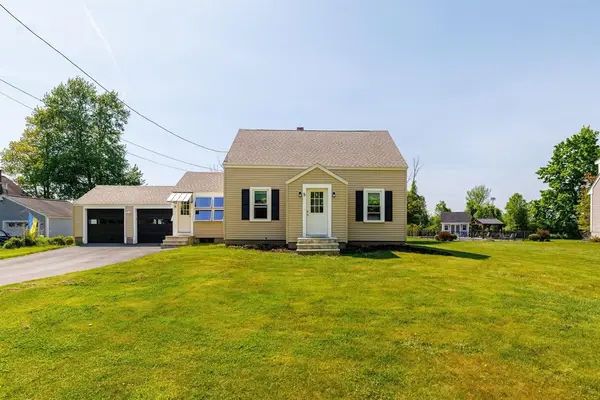 $525,000Active3 beds 2 baths1,502 sq. ft.
5 Bates St, Mendon, MA 01756
MLS# 73524808Listed by: Keller Williams Pinnacle Central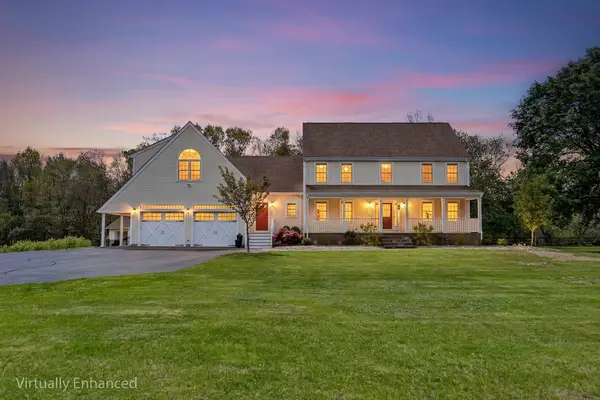 $1,030,000Active4 beds 4 baths4,672 sq. ft.
86 Mowry St, Mendon, MA 01756
MLS# 73522364Listed by: Redfin Corp.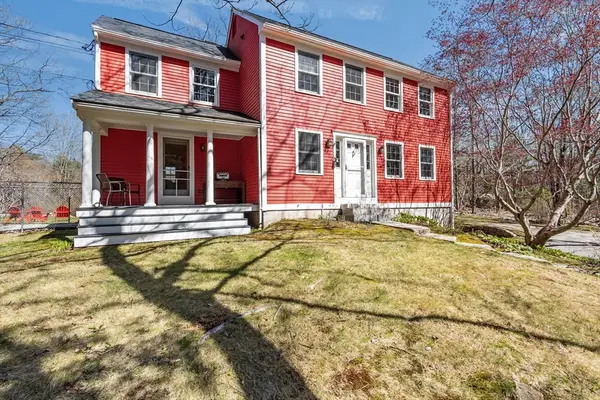 $750,000Active3 beds 2 baths1,980 sq. ft.
174 Millville Rd, Mendon, MA 01756
MLS# 73521658Listed by: Better Living Real Estate, LLC $650,000Active3 beds 2 baths1,622 sq. ft.
40 Kinsley Ln, Mendon, MA 01756
MLS# 73521451Listed by: Berkshire Hathaway HomeServices Commonwealth Real Estate $825,000Active3 beds 3 baths3,300 sq. ft.
170 Millville Rd, Mendon, MA 01756
MLS# 73516309Listed by: Coldwell Banker Realty - Franklin $949,999Active4 beds 3 baths2,454 sq. ft.
9 Jewell Xing, Mendon, MA 01756
MLS# 73513168Listed by: Coldwell Banker Realty - Franklin $1,050,000Active3 beds 3 baths4,291 sq. ft.
10 Cemetery, Mendon, MA 01756
MLS# 73505200Listed by: eXp Realty $825,000Active4 beds 4 baths2,449 sq. ft.
9 White Rd, Mendon, MA 01756
MLS# 73497350Listed by: HomeSmart Professionals Real Estate $1,075,000Active4 beds 3 baths2,974 sq. ft.
29 Thornton Street, Mendon, MA 01756
MLS# 73493838Listed by: Better Living Real Estate, LLC $1,077,845Active4 beds 3 baths2,751 sq. ft.
Lot 20A Rawson Farm, Mendon, MA 01756
MLS# 73481129Listed by: Mendon Area Real Estate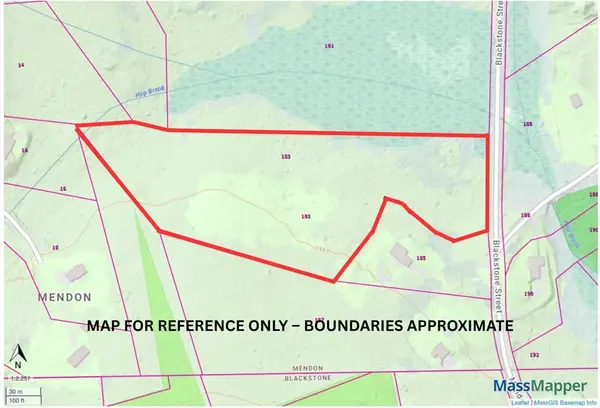
 $489,000Active8.54 Acres
183 Blackstone St, Mendon, MA 01756
MLS# 73480327Listed by: Century 21 Custom Home Realty $849,900Active4 beds 3 baths2,468 sq. ft.
220 Millville Road, Mendon, MA 01756
MLS# 73429056Listed by: Lamacchia Realty, Inc. $125,000Active2.07 Acres
13A Asylum, Mendon, MA 01756
MLS# 73423672Listed by: First New England Realty Group
Local realty services provided by:CENTURY 21 Elite Realty, Inc.
Popular searches near 01756
Popular neighborhoods near 01756
- Beacon Brightly, Worcester homes for sale
- Bell Hill, Worcester homes for sale
- Broadmeadow Brook, Worcester homes for sale
- Central City, Worcester homes for sale
- Coburnville, Framingham homes for sale
- Downtown Worcester, Worcester homes for sale
- East Worcester, Worcester homes for sale
- Grafton Hill, Worcester homes for sale
- Green Island, Worcester homes for sale
- Hadwen Park, Worcester homes for sale
- Hamilton, Worcester homes for sale
- Lake Park, Worcester homes for sale
- Natick Village, Natick homes for sale
- Quinsigamond Village, Worcester homes for sale
- Shrewsbury Street, Worcester homes for sale
- South Worcester, Worcester homes for sale
- Southern Worcester, Worcester homes for sale
- Union Hill, Worcester homes for sale
- Vernon Hill, Worcester homes for sale
- West Framingham, Framingham homes for sale
Counties near Mendon, 01756
- Bristol County homes for sale
- Bristol County homes for sale
- Capitol County homes for sale
- Essex County homes for sale
- Franklin County homes for sale
- Hampden County homes for sale
- Kent County homes for sale
- Middlesex County homes for sale
- New London County homes for sale
- Newport County homes for sale
- Norfolk County homes for sale
- Northeastern Connecticut County homes for sale
- Plymouth County homes for sale
- Providence County homes for sale
- Southeastern Connecticut County homes for sale
- Suffolk County homes for sale
- Tolland County homes for sale
- Washington County homes for sale
- Windham County homes for sale
- Worcester County homes for sale
Protect your home and budget from life's surprises with an Assurant Home Warranty, backed by a partner that supports you through every step of homeownership. Explore Plans.
©2026 Century 21 Real Estate LLC. All rights reserved. CENTURY 21®, the CENTURY 21 Logo and C21® are service marks owned by Century 21 Real Estate LLC. Century 21 Real Estate LLC fully supports the principles of the Fair Housing Act and the Equal Opportunity Act. Each office is independently owned and operated. Listing information is deemed reliable but not guaranteed accurate.