- Andover homes for sale
- Burlington homes for sale
- Danvers homes for sale
- Lynn homes for sale
- Lynnfield homes for sale
- Malden homes for sale
- Medford homes for sale
- Melrose homes for sale
- Middleton homes for sale
- North Reading homes for sale
- Peabody homes for sale
- Pinehurst homes for sale
- Reading homes for sale
- Saugus homes for sale
- Stoneham homes for sale
- Tewksbury homes for sale
- Wakefield homes for sale
- Wilmington homes for sale
- Winchester homes for sale
- Woburn homes for sale
01867, MA - homes for sale
47 of 47 results displayed
- New
 $149,900Active3.85 Acres
0 Charles St +, Reading, MA 01867
MLS# 73526596Listed by: RE/MAX Encore - New
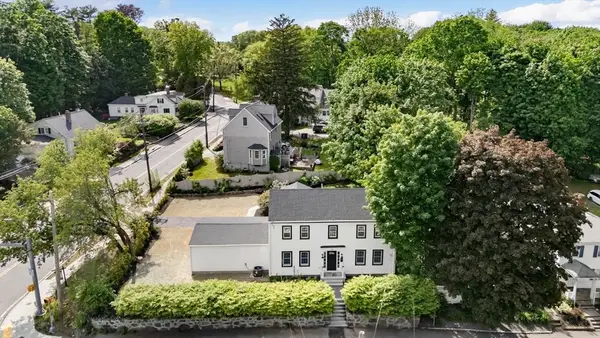
 $699,900Active3 beds 1 baths1,680 sq. ft.
394 Pearl St, Reading, MA 01867
MLS# 73526230Listed by: Berkshire Hathaway HomeServices Verani Realty - New
 $1,299,000Active3 beds 3 baths2,900 sq. ft.
49 Salem Street #1, Reading, MA 01867
MLS# 73526135Listed by: Coldwell Banker Realty - Lynnfield - New
 $2,099,000Active6 beds 5 baths5,284 sq. ft.
480 West Street, Reading, MA 01867
MLS# 73526052Listed by: Compass - New
 $839,900Active4 beds 3 baths2,455 sq. ft.
58 Libby Ave, Reading, MA 01867
MLS# 73525956Listed by: Berkshire Hathaway HomeServices Commonwealth Real Estate - New
 $1,049,000Active4 beds 3 baths2,430 sq. ft.
64 Dana Road, Reading, MA 01867
MLS# 73525615Listed by: Century 21 North East - New
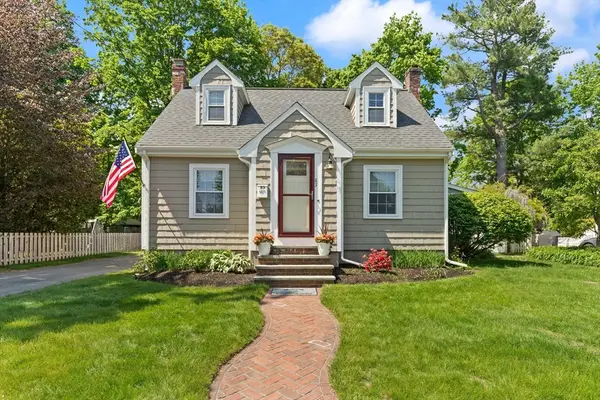
 $609,900Active3 beds 2 baths1,819 sq. ft.
1 Charles St #V, Reading, MA 01867
MLS# 73525595Listed by: Gibson Sotheby's International Realty - New
 $999,900Active3 beds 2 baths2,162 sq. ft.
55 Blueberry Lane, Reading, MA 01867
MLS# 73524761Listed by: Wilson Wolfe Real Estate - New
 $1,649,000Active4 beds 4 baths4,250 sq. ft.
187 Sanborn Lane, Reading, MA 01867
MLS# 73524681Listed by: Classified Realty Group - New
 $600,000Active2 beds 2 baths1,197 sq. ft.
812 Gazebo Circle #812, Reading, MA 01867
MLS# 73524649Listed by: Classified Realty Group - New
 $585,000Active2 beds 2 baths1,197 sq. ft.
713 Gazebo Circle #713, Reading, MA 01867
MLS# 73524546Listed by: Classified Realty Group - New
 $625,000Active2 beds 2 baths1,320 sq. ft.
62 Abigail Way #1006, Reading, MA 01867
MLS# 73524503Listed by: Today Real Estate, Inc. - New
 $650,000Active3 beds 2 baths1,426 sq. ft.
12 Lakeview Ave, Reading, MA 01867
MLS# 73524092Listed by: Chinatti Realty Group, Inc. - New
 $709,000Active2 beds 2 baths1,335 sq. ft.
62 Abigail Way #4006, Reading, MA 01867
MLS# 73523729Listed by: Keller Williams Realty Evolution - New
 $2,299,000Active6 beds 6 baths5,054 sq. ft.
539 Pearl St, Reading, MA 01867
MLS# 73522597Listed by: Lillian Montalto Signature Properties - New
 $849,900Active3 beds 4 baths2,236 sq. ft.
13 Carnation Circle #B, Reading, MA 01867
MLS# 73522461Listed by: Boardwalk Real Estate - New
 $1,099,000Active4 beds 3 baths2,196 sq. ft.
190 Main Strteet, Reading, MA 01867
MLS# 73522384Listed by: Colonial Manor Realty - New
 $719,900Active2 beds 2 baths1,204 sq. ft.
85 Mineral Street, Reading, MA 01867
MLS# 73522254Listed by: Colonial Manor Realty 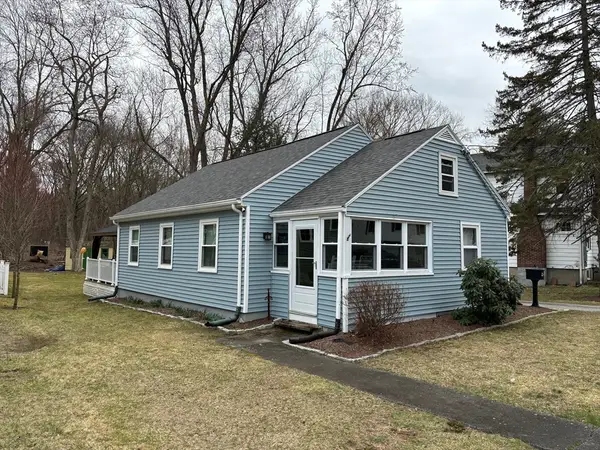 $589,999Active2 beds 1 baths1,022 sq. ft.
20 Pinevale Ave, Reading, MA 01867
MLS# 73520729Listed by: Decroteau Realty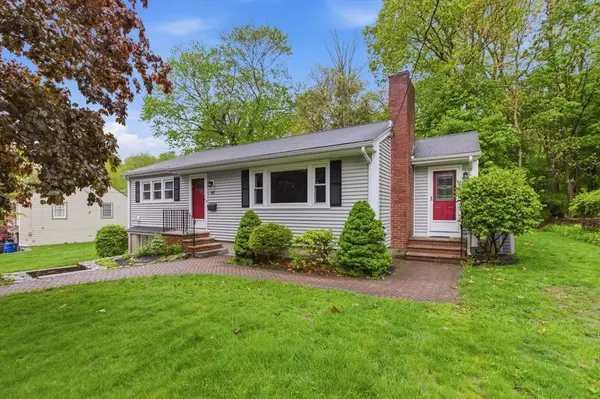 $659,900Active3 beds 1 baths1,386 sq. ft.
141 Pine Ridge Rd, Reading, MA 01867
MLS# 73519920Listed by: Cameron Real Estate Group $1,750,000Active3 beds 3 baths4,354 sq. ft.
99 Beaver Road, Reading, MA 01867
MLS# 73519470Listed by: Coldwell Banker Realty - Andovers/Readings Regional $670,000Active2 beds 2 baths1,385 sq. ft.
2 Inwood Drive #3012, Woburn, MA 01801
MLS# 73518956Listed by: Better Homes and Gardens Real Estate - The Shanahan Group $965,000Active4 beds 2 baths2,648 sq. ft.
223 Franklin Street, Reading, MA 01867
MLS# 73518736Listed by: William Raveis R.E. & Home Services $899,000Active2 beds 3 baths1,603 sq. ft.
400 Main, Reading, MA 01867
MLS# 73518588Listed by: Century 21 North East $949,500Active2 beds 3 baths2,200 sq. ft.
16 Taylor Drive #3003, Reading, MA 01867
MLS# 73517839Listed by: Glover Brokerage Corporation $1,098,000Active4 beds 3 baths2,615 sq. ft.
35 Blueberry Lane, Reading, MA 01867
MLS# 73517653Listed by: True North Realty $949,000Active3 beds 2 baths1,816 sq. ft.
152 Oak Street, Reading, MA 01867
MLS# 73517607Listed by: Coldwell Banker Realty - Andovers/Readings Regional $799,000Active3 beds 2 baths1,536 sq. ft.
22 Irving St, Reading, MA 01867
MLS# 73517338Listed by: Keller Williams Realty Evolution $1,200,000Active5 beds 4 baths3,343 sq. ft.
97 Batchelder Rd, Reading, MA 01867
MLS# 73514692Listed by: Gibson Sotheby's International Realty $739,900Active3 beds 2 baths1,824 sq. ft.
215 Pearl St, Reading, MA 01867
MLS# 73514006Listed by: Leading Edge Real Estate $1,569,000Active3 beds 5 baths3,400 sq. ft.
10 Deerpath Lane #10, Reading, MA 01867
MLS# 73512629Listed by: Glover Brokerage Corporation $1,269,900Active3 beds 4 baths3,358 sq. ft.
127 Johnson Woods Dr #127, Reading, MA 01867
MLS# 73512525Listed by: Coldwell Banker Realty - Andovers/Readings Regional- Open Sat, 11am to 12:30pm
 $799,999Active4 beds 2 baths2,278 sq. ft.
106 Grove Street, Reading, MA 01867
MLS# 73510528Listed by: Keller Williams Realty-Merrimack 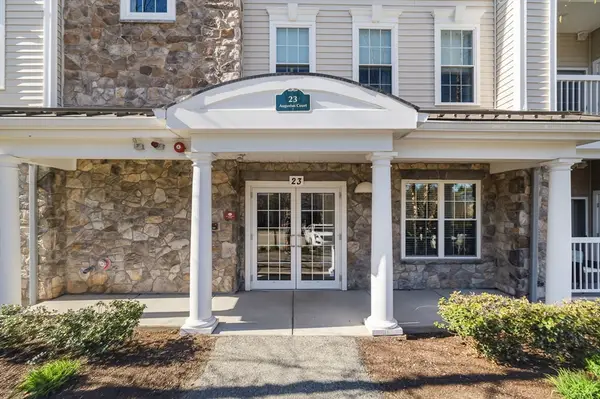 $809,900Active2 beds 2 baths1,510 sq. ft.
23 Augustus Court #4003, Reading, MA 01867
MLS# 73510447Listed by: Berkshire Hathaway HomeServices Commonwealth Real Estate $598,000Active2 beds 2 baths1,603 sq. ft.
249 Salem Street #4, Reading, MA 01867
MLS# 73510482Listed by: Berkshire Hathaway HomeServices Verani Realty $799,950Active4 beds 2 baths2,191 sq. ft.
856 Main Street, Reading, MA 01867
MLS# 73510384Listed by: Wilson Wolfe Real Estate $1,049,000Active4 beds 3 baths2,300 sq. ft.
1295 Main St, Reading, MA 01867
MLS# 73501831Listed by: RE/MAX Partners Relocation $389,900Active2 beds 1 baths782 sq. ft.
295 Main Street #16, Reading, MA 01867
MLS# 73499459Listed by: Coldwell Banker Realty - Belmont- Open Sat, 12 to 2pm
 $1,699,000Active4 beds 4 baths3,800 sq. ft.
44 Grandview Rd., Reading, MA 01867
MLS# 73496237Listed by: Steve Bremis Realty Group  $1,025,000Active3 beds 3 baths2,589 sq. ft.
84 Curtis Street, Reading, MA 01867
MLS# 73494440Listed by: True North Realty $579,900Active2 beds 2 baths1,220 sq. ft.
52 Sanborn #7, Reading, MA 01867
MLS# 73490875Listed by: Douglas Elliman Real Estate - Park Plaza $1,125,000Active3 beds 3 baths2,879 sq. ft.
106 Johnson Woods Drive #106, Reading, MA 01867
MLS# 73490733Listed by: Glover Brokerage Corporation $1,750,000Active3 beds 5 baths3,365 sq. ft.
17 Courtyard Place #17, Reading, MA 01867
MLS# 73479322Listed by: Glover Brokerage Corporation $429,000Active2 beds 2 baths1,076 sq. ft.
1 Summit Dr. #57, Reading, MA 01867
MLS# 73458196Listed by: Dvine1 Real Estate $925,000Active5 beds 2 baths2,063 sq. ft.
16 Munroe Ave, Reading, MA 01867
MLS# 73439082Listed by: The Greene Realty Group $699,900Active2 beds 3 baths1,500 sq. ft.
48 Village St #1001, Reading, MA 01867
MLS# 73338901Listed by: Colonial Manor Realty $625,000Active2 beds 2 baths1,335 sq. ft.
62 Abigail Way #4002, Reading, MA 01867
MLS# 73194346Listed by: William Raveis R.E. & Home Services
Local realty services provided by:CENTURY 21 Topsail Realty
Popular searches near 01867
Popular neighborhoods near 01867
- Cummingsville, Woburn homes for sale
- Downtown, Melrose homes for sale
- Downtown Woburn, Woburn homes for sale
- East Side, Melrose homes for sale
- Horace Mann, Melrose homes for sale
- Lawrence Estates, Medford homes for sale
- Lynn Woods, Lynn homes for sale
- Maplewood, Malden homes for sale
- Maplewood Highlands, Malden homes for sale
- Melrose Highlands, Melrose homes for sale
- Mishawum, Woburn homes for sale
- North Faulkner, Malden homes for sale
- North Medford, Medford homes for sale
- North Woburn, Woburn homes for sale
- Oak Grove, Melrose homes for sale
- Proctor, Peabody homes for sale
- Shakerhill, Woburn homes for sale
- West End, Malden homes for sale
- West Peabody, Peabody homes for sale
- Wyoming, Melrose homes for sale
Counties near Reading, 01867
- Barnstable County homes for sale
- Belknap County homes for sale
- Bristol County homes for sale
- Bristol County homes for sale
- Cheshire County homes for sale
- Essex County homes for sale
- Hillsborough County homes for sale
- Kent County homes for sale
- Merrimack County homes for sale
- Middlesex County homes for sale
- Norfolk County homes for sale
- Northeastern Connecticut County homes for sale
- Plymouth County homes for sale
- Providence County homes for sale
- Rockingham County homes for sale
- Strafford County homes for sale
- Suffolk County homes for sale
- Windham County homes for sale
- Worcester County homes for sale
- York County homes for sale
Protect your home and budget from life's surprises with an Assurant Home Warranty, backed by a partner that supports you through every step of homeownership. Explore Plans.
©2026 Century 21 Real Estate LLC. All rights reserved. CENTURY 21®, the CENTURY 21 Logo and C21® are service marks owned by Century 21 Real Estate LLC. Century 21 Real Estate LLC fully supports the principles of the Fair Housing Act and the Equal Opportunity Act. Each office is independently owned and operated. Listing information is deemed reliable but not guaranteed accurate.