- Beverly homes for sale
- Chelsea homes for sale
- Danvers homes for sale
- East Boston homes for sale
- Everett homes for sale
- Lynn homes for sale
- Lynnfield homes for sale
- Malden homes for sale
- Marblehead homes for sale
- Melrose homes for sale
- Nahant homes for sale
- Peabody homes for sale
- Revere homes for sale
- Salem homes for sale
- Saugus homes for sale
- Stoneham homes for sale
- Swampscott homes for sale
- Wakefield homes for sale
- Winthrop homes for sale
- Winthrop Town homes for sale
01902, MA - homes for sale
28 of 28 results displayed
- New
 $509,900Active4 beds 2 baths1,670 sq. ft.
199 Allen Ave, Lynn, MA 01902
MLS# 73531138Listed by: Georges Realty Services - New
 $1,099,986Active8 beds 4 baths2,760 sq. ft.
17-19 Acorn St, Lynn, MA 01902
MLS# 73530281Listed by: United Brokers - New
 $799,900Active6 beds 3 baths2,129 sq. ft.
94 Eutaw Ave, Lynn, MA 01902
MLS# 73530106Listed by: Martel Real Estate - New
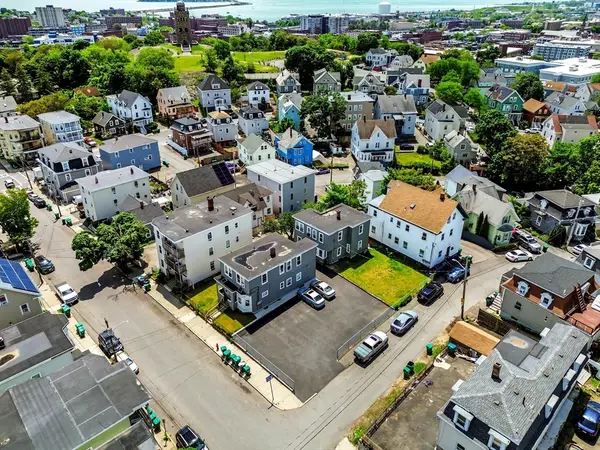
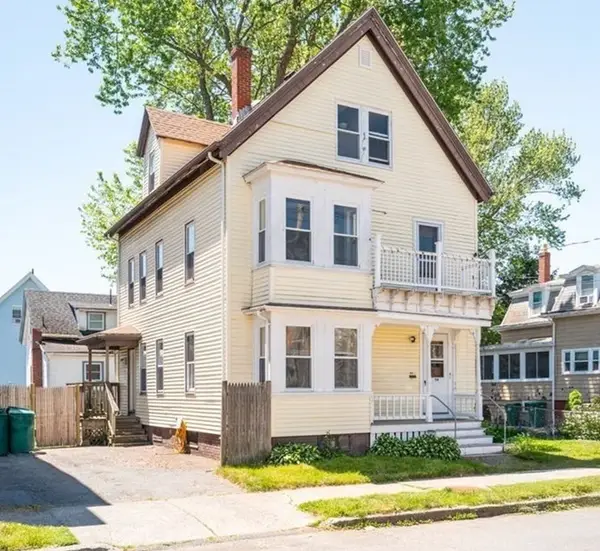
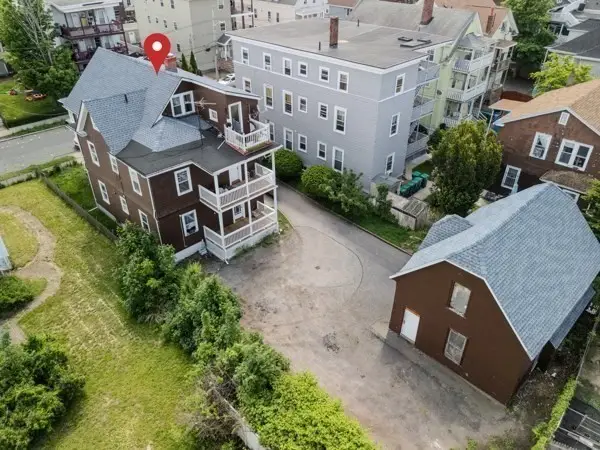
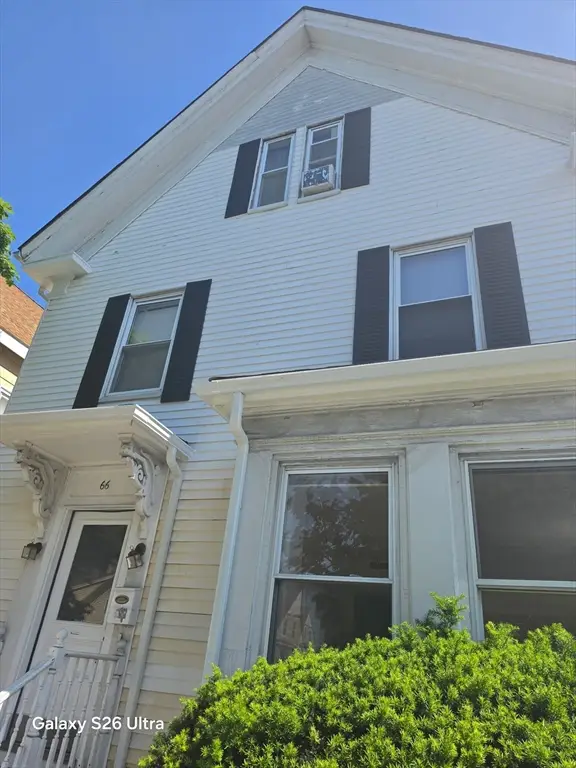 $709,000Active6 beds 2 baths2,236 sq. ft.
66 Lewis Street, Lynn, MA 01902
MLS# 73529739Listed by: Capitol Realty Group - New
 $1,099,900Active9 beds 6 baths3,650 sq. ft.
42 Baker St, Lynn, MA 01902
MLS# 73527722Listed by: Century 21 Mario Real Estate - New
 $1,250,000Active8 beds 3 baths3,473 sq. ft.
316 Essex St, Lynn, MA 01902
MLS# 73526347Listed by: Coldwell Banker Realty - Marblehead - New
 $799,000Active4 beds 3 baths2,440 sq. ft.
191 Eastern Ave, Lynn, MA 01902
MLS# 73526142Listed by: Connor Real Estate - New
 $1,490,000Active5 beds 3 baths3,790 sq. ft.
24 Cherry St, Lynn, MA 01902
MLS# 73526044Listed by: Benoit Real Estate Group ,LLC - New
 $2,649,000Active18 beds 12 baths8,694 sq. ft.
29-35 Sagamore Street, Lynn, MA 01902
MLS# 73525911Listed by: Boston Realty Advisors  $900,000Active6 beds 3 baths2,331 sq. ft.
16 Crescent St, Lynn, MA 01902
MLS# 73525452Listed by: eXp Realty $749,999Active6 beds 2 baths2,803 sq. ft.
6 Hampden Pl, Lynn, MA 01902
MLS# 73525028Listed by: Hacienda Realty $1,250,000Active8 beds 3 baths3,257 sq. ft.
9 Hamilton Ave, Lynn, MA 01902
MLS# 73524844Listed by: Cameron Real Estate Group $1,299,900Active5 beds 5 baths3,064 sq. ft.
2 Peirce Rd, Lynn, MA 01902
MLS# 73524847Listed by: William Raveis R.E. & Home Services $599,000Active4 beds 2 baths1,776 sq. ft.
10 Essex Ct, Lynn, MA 01902
MLS# 73524293Listed by: Keller Williams Gateway Realty $1,100,000Active8 beds 4 baths3,292 sq. ft.
55 Harwood St, Lynn, MA 01904
MLS# 73523884Listed by: Century 21 North East $1,190,000Active9 beds 5 baths4,089 sq. ft.
4-4A Broad St, Lynn, MA 01902
MLS# 73520240Listed by: Atlantic Coast Homes,Inc $679,900Active5 beds 2 baths1,912 sq. ft.
52 Hamilton Ave, Lynn, MA 01902
MLS# 73517305Listed by: Century 21 North East $2,025,000Active16 beds 9 baths7,565 sq. ft.
139 Franklin St, Lynn, MA 01902
MLS# 73502738Listed by: North Shore Realty Advisors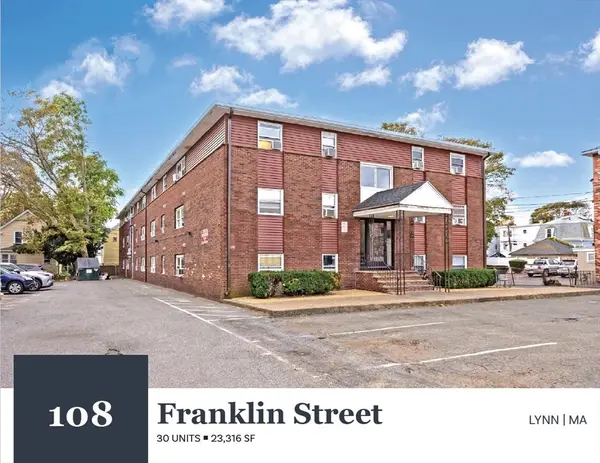 $7,200,000Active55 beds 30 baths23,316 sq. ft.
108 Franklin St, Lynn, MA 01902
MLS# 73504665Listed by: Horvath & Tremblay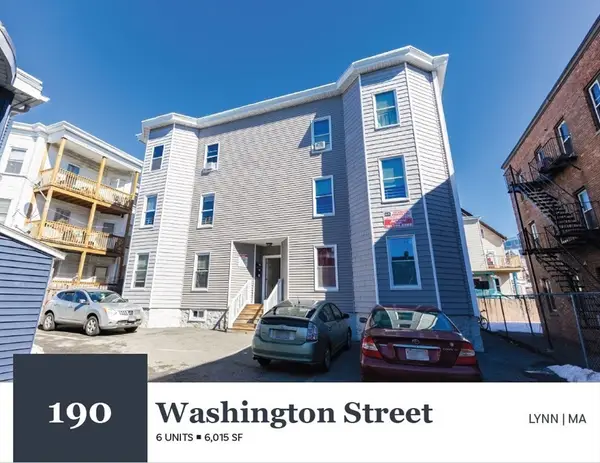 $1,575,000Active12 beds 6 baths6,015 sq. ft.
190 Washington St, Lynn, MA 01902
MLS# 73500388Listed by: Horvath & Tremblay $6,000,000Active33 beds 26 baths17,407 sq. ft.
145 Lewis St, Lynn, MA 01902
MLS# 73500404Listed by: North Shore Realty Advisors $699,900Active3 beds 3 baths1,880 sq. ft.
141 Essex St, Lynn, MA 01902
MLS# 73498056Listed by: RE/MAX 360 $850,000Active6 beds 4 baths2,844 sq. ft.
48 Saratoga St, Lynn, MA 01902
MLS# 73494075Listed by: Leading Edge Real Estate $1,199,000Active6 beds 3 baths3,064 sq. ft.
154-156 Tracy Ave, Lynn, MA 01902
MLS# 73493163Listed by: Woods Real Estate $999,000Active13 beds 6 baths4,982 sq. ft.
121 N Common, Lynn, MA 01902
MLS# 73490100Listed by: Atlantic Coast Homes,Inc $869,900Active5 beds 3 baths2,718 sq. ft.
502 Western Ave, Lynn, MA 01904
MLS# 73488300Listed by: William Raveis R.E. & Home Services $1,160,000Active4 beds 4 baths3,442 sq. ft.
431-433 Chatham, Lynn, MA 01902
MLS# 73447401Listed by: Compass $689,900Active4 beds 3 baths2,816 sq. ft.
175 Essex St, Lynn, MA 01902
MLS# 73193652Listed by: NextStep Properties, Inc.
Local realty services provided by:CENTURY 21 Elite Realty, Inc.
Popular searches near 01902
Popular neighborhoods near 01902
- Central Business District, Salem homes for sale
- Central Lynn, Lynn homes for sale
- Chatham Street, Lynn homes for sale
- Diamond District, Lynn homes for sale
- Fayette Street, Lynn homes for sale
- Gallows Hill, Salem homes for sale
- Lakeside, Lynn homes for sale
- Lynn English, Lynn homes for sale
- Lynn Woods, Lynn homes for sale
- McIntire Historic District, Salem homes for sale
- North Salem, Salem homes for sale
- Oak Island, Revere homes for sale
- Peabody Town Center, Peabody homes for sale
- Salem Common, Salem homes for sale
- South Peabody, Peabody homes for sale
- The Point, Salem homes for sale
- Vinnin Square, Salem homes for sale
- Waterfront District, Salem homes for sale
- West Lynn, Lynn homes for sale
- West Salem, Salem homes for sale
Counties near Lynn, 01902
- Barnstable County homes for sale
- Bristol County homes for sale
- Bristol County homes for sale
- Cheshire County homes for sale
- Essex County homes for sale
- Hillsborough County homes for sale
- Kent County homes for sale
- Merrimack County homes for sale
- Middlesex County homes for sale
- Newport County homes for sale
- Norfolk County homes for sale
- Northeastern Connecticut County homes for sale
- Plymouth County homes for sale
- Providence County homes for sale
- Rockingham County homes for sale
- Strafford County homes for sale
- Suffolk County homes for sale
- Windham County homes for sale
- Worcester County homes for sale
- York County homes for sale
Protect your home and budget from life's surprises with an Assurant Home Warranty, backed by a partner that supports you through every step of homeownership. Explore Plans.
©2026 Century 21 Real Estate LLC. All rights reserved. CENTURY 21®, the CENTURY 21 Logo and C21® are service marks owned by Century 21 Real Estate LLC. Century 21 Real Estate LLC fully supports the principles of the Fair Housing Act and the Equal Opportunity Act. Each office is independently owned and operated. Listing information is deemed reliable but not guaranteed accurate.