- Boxford town homes for sale
- Boxford homes for sale
- Byfield homes for sale
- Danvers homes for sale
- Essex town homes for sale
- Essex homes for sale
- Georgetown homes for sale
- Gloucester homes for sale
- Hamilton homes for sale
- Ipswich town homes for sale
- Ipswich homes for sale
- Manchester homes for sale
- Newbury homes for sale
- Newburyport homes for sale
- Rowley town homes for sale
- Rowley homes for sale
- South Hamilton homes for sale
- Topsfield homes for sale
- Topsfield town homes for sale
- Wenham homes for sale
01938, MA - homes for sale
38 of 38 results displayed
- New
 $1,195,000Active4 beds 3 baths2,950 sq. ft.
60 Prospect Street, Ipswich, MA 01938
MLS# 73532852Listed by: eXp Realty LLC - Corporate Office - Open Sat, 12:30 to 2pmNew
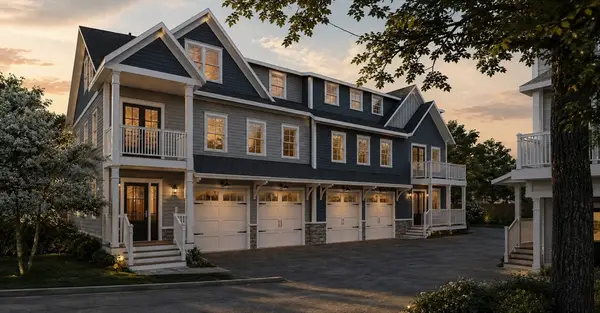
 $1,099,900Active3 beds 4 baths2,525 sq. ft.
11 Washington Street, Ipswich, MA 01938
MLS# 73532681Listed by: J. Barrett & Company - Open Sat, 10:30am to 12pmNew
 $799,900Active3 beds 2 baths2,470 sq. ft.
5 Dix Road, Ipswich, MA 01938
MLS# 73532462Listed by: Lamacchia Realty, Inc. - Open Sat, 12 to 1:30pmNew
 $639,000Active2 beds 2 baths1,650 sq. ft.
4 Lanes End #3, Ipswich, MA 01938
MLS# 73527672Listed by: J. Barrett & Company 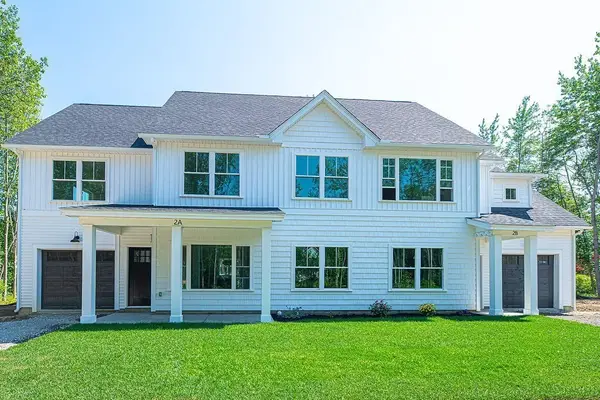 $568,900Active2 beds 2 baths1,371 sq. ft.
28 Meadowview Lane #A, Salisbury, MA 01952
MLS# 73526618Listed by: Monarch Property Group, LLC $289,000Active1 beds 1 baths410 sq. ft.
25 Poplar St #5A, Ipswich, MA 01938
MLS# 73526249Listed by: Windhill Realty, LLC $645,000Active3 beds 1 baths838 sq. ft.
17 Kings Way, Ipswich, MA 01938
MLS# 73526350Listed by: eXp Realty LLC - Corporate Office- Open Sat, 12:30 to 2pm
 $1,099,900Active3 beds 4 baths2,525 sq. ft.
11 Washington Street #M, Ipswich, MA 01938
MLS# 73525406Listed by: J. Barrett & Company  $941,000Active2 beds 2 baths2,230 sq. ft.
72 Mile Ln, Ipswich, MA 01938
MLS# 73521879Listed by: Keller Williams Realty Evolution $775,000Active7 beds 3 baths3,052 sq. ft.
11 Mount Pleasant Avenue, Ipswich, MA 01938
MLS# 73524894Listed by: Lamacchia Realty, Inc. $3,800,000Active7 beds 8 baths8,000 sq. ft.
28 Pineswamp Rd, Ipswich, MA 01938
MLS# 73524603Listed by: Seas the Day Realty $650,000Active4 beds 2 baths1,666 sq. ft.
2 Howard Street, Ipswich, MA 01938
MLS# 73524415Listed by: Windhill Realty, LLC $950,000Active3 beds 4 baths2,651 sq. ft.
6 Essex Road #8, Ipswich, MA 01938
MLS# 73524236Listed by: J. Barrett & Company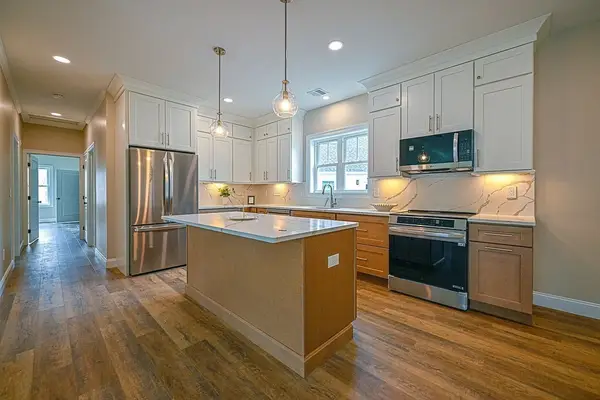 $654,900Active3 beds 2 baths1,785 sq. ft.
24 Meadowview Lane #B, Salisbury, MA 01952
MLS# 73523780Listed by: Monarch Property Group, LLC $499,000Active3 beds 3 baths1,680 sq. ft.
12 Hodgkins Dr, Ipswich, MA 01938
MLS# 73522278Listed by: Today Real Estate, Inc. $599,999Active2 beds 2 baths1,800 sq. ft.
6 Safford St #2, Ipswich, MA 01938
MLS# 73521285Listed by: William Raveis R.E. & Home Services $2,600,000Active3 beds 4 baths3,114 sq. ft.
38 Buttonwood Lane, Ipswich, MA 01938
MLS# 73521158Listed by: Engel & Volkers By the Sea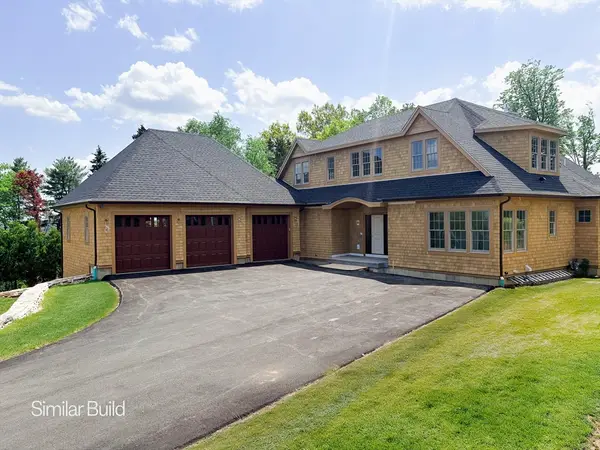 $2,600,000Active3 beds 4 baths3,114 sq. ft.
38 Buttonwood Lane #30, Ipswich, MA 01938
MLS# 73521159Listed by: Engel & Volkers By the Sea $1,395,000Active4 beds 3 baths3,988 sq. ft.
375 Linebrook Rd, Ipswich, MA 01938
MLS# 73518070Listed by: William Raveis R.E. & Home Services $559,900Active2 beds 2 baths1,371 sq. ft.
22 Meadowview Lane #A, Salisbury, MA 01952
MLS# 73517248Listed by: Monarch Property Group, LLC $569,900Active2 beds 2 baths1,545 sq. ft.
38 Kimball Ave #6, Ipswich, MA 01938
MLS# 73516061Listed by: J. Barrett & Company $1,595,000Active4 beds 3 baths3,811 sq. ft.
6 Northgate Road, Ipswich, MA 01938
MLS# 73515943Listed by: J. Barrett & Company $1,299,900Active3 beds 1 baths1,170 sq. ft.
13 Brown Street, Ipswich, MA 01938
MLS# 73513727Listed by: Coldwell Banker Realty - Haverhill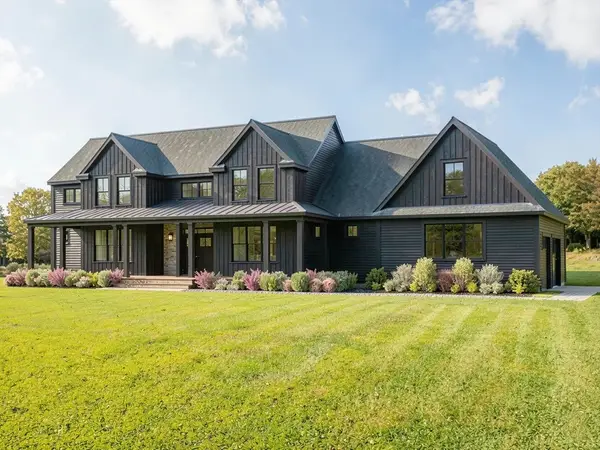 $1,995,000Active3 beds 3 baths3,051 sq. ft.
45 Pine Swamp, Ipswich, MA 01938
MLS# 73511796Listed by: Portside Real Estate Group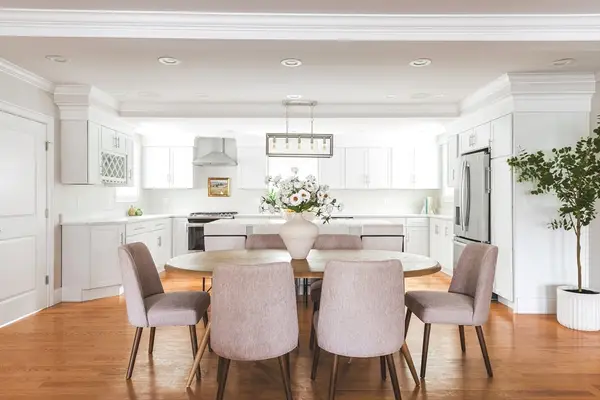 $849,000Active3 beds 3 baths2,566 sq. ft.
64 County Rd #1, Ipswich, MA 01938
MLS# 73508424Listed by: Compass $699,900Active3 beds 3 baths1,683 sq. ft.
8 Hammatt St #1, Ipswich, MA 01938
MLS# 73505972Listed by: Moor Realty Group $725,000Active3 beds 3 baths1,679 sq. ft.
8 Hammatt St #2, Ipswich, MA 01938
MLS# 73505973Listed by: Moor Realty Group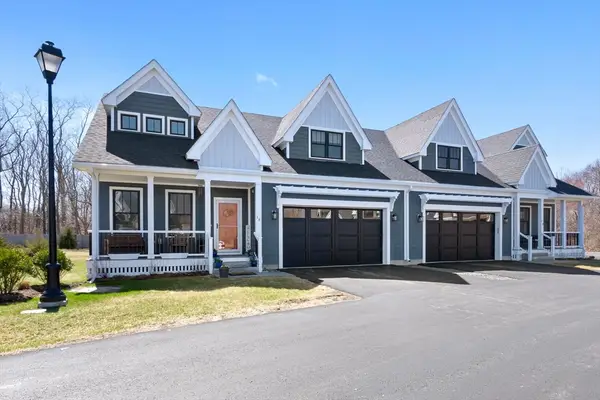 $969,000Active3 beds 3 baths2,431 sq. ft.
18 Primrose Ln #18, Ipswich, MA 01938
MLS# 73499182Listed by: Keller Williams Realty Evolution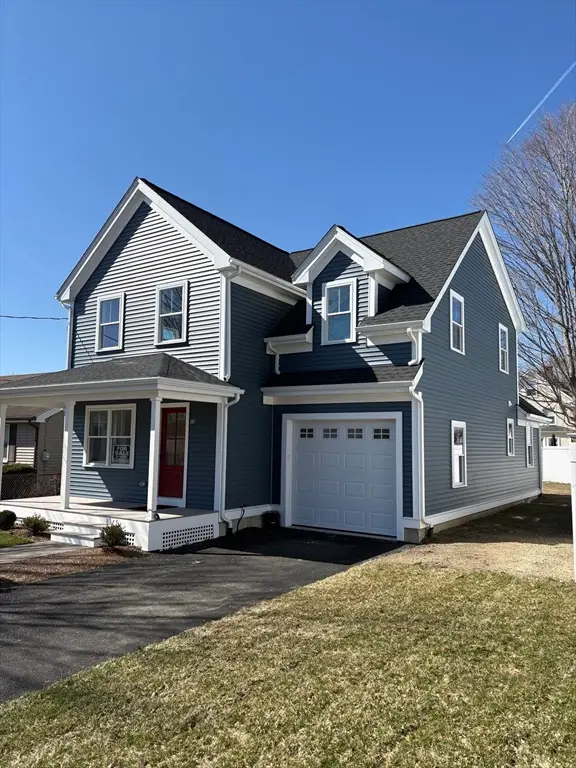 $999,500Active3 beds 3 baths1,650 sq. ft.
28 Fairview Ave, Ipswich, MA 01938
MLS# 73498859Listed by: John L. Hyland $1,299,999Active4 beds 3 baths2,513 sq. ft.
24 Fellows Rd #3, Ipswich, MA 01938
MLS# 73497275Listed by: Coldwell Banker Realty - Beverly $1,795,900Active4 beds 4 baths3,598 sq. ft.
49 Country Club Way, Ipswich, MA 01938
MLS# 73496342Listed by: Royal Realty, Inc. $490,000Active11.93 Acres
125 Topsfield Rd, Ipswich, MA 01938
MLS# 73494898Listed by: Lamacchia Realty, Inc. $995,000Active3 beds 1 baths1,439 sq. ft.
63 North Ridge Road, Ipswich, MA 01938
MLS# 73490417Listed by: J. Barrett & Company $3,250,000Active4 beds 5 baths4,480 sq. ft.
9 Booth Ct, Ipswich, MA 01938
MLS# 73482525Listed by: Engel & Volkers By the Sea $974,750Active2 beds 2 baths2,419 sq. ft.
57 East Street, Ipswich, MA 01938
MLS# 73460420Listed by: eXp Realty $1,187,500Active3 beds 3 baths4,531 sq. ft.
75 Country Club Way, Ipswich, MA 01938
MLS# 73448849Listed by: Compass $499,000Active2.48 Acres
23 Jeffreys Neck Rd, Ipswich, MA 01938
MLS# 73431178Listed by: Compass $649,000Active17.73 Acres
45 Pineswamp Rd, Ipswich, MA 01938
MLS# 73350054Listed by: Silver Key Homes Realty
Local realty services provided by:CENTURY 21 Professionals
Popular searches near 01938
Popular neighborhoods near 01938
- Beverly Farms, Beverly homes for sale
- Bridge Street Neck, Salem homes for sale
- Centerville, Beverly homes for sale
- Central Business District, Salem homes for sale
- Downtown Beverly, Beverly homes for sale
- Fish Flake Hill, Beverly homes for sale
- Gallows Hill, Salem homes for sale
- McIntire Historic District, Salem homes for sale
- North Beverly, Beverly homes for sale
- North Salem, Salem homes for sale
- North Shore, Gloucester homes for sale
- Peabody Town Center, Peabody homes for sale
- Prides Crossing, Beverly homes for sale
- Proctor, Peabody homes for sale
- Prospect Hill, Beverly homes for sale
- Raymond Farms, Beverly homes for sale
- Rial Side, Beverly homes for sale
- Salem Common, Salem homes for sale
- The Point, Salem homes for sale
- Waterfront District, Salem homes for sale
Counties near Ipswich, 01938
- Barnstable County homes for sale
- Belknap County homes for sale
- Bristol County homes for sale
- Bristol County homes for sale
- Cheshire County homes for sale
- Cumberland County homes for sale
- Essex County homes for sale
- Hillsborough County homes for sale
- Kent County homes for sale
- Merrimack County homes for sale
- Middlesex County homes for sale
- Norfolk County homes for sale
- Plymouth County homes for sale
- Providence County homes for sale
- Rockingham County homes for sale
- Strafford County homes for sale
- Suffolk County homes for sale
- Windham County homes for sale
- Worcester County homes for sale
- York County homes for sale
Protect your home and budget from life's surprises with an Assurant Home Warranty, backed by a partner that supports you through every step of homeownership. Explore Plans.
©2026 Century 21 Real Estate LLC. All rights reserved. CENTURY 21®, the CENTURY 21 Logo and C21® are service marks owned by Century 21 Real Estate LLC. Century 21 Real Estate LLC fully supports the principles of the Fair Housing Act and the Equal Opportunity Act. Each office is independently owned and operated. Listing information is deemed reliable but not guaranteed accurate.