- Canton homes for sale
- Dedham homes for sale
- Dover town homes for sale
- Dover homes for sale
- Hyde Park homes for sale
- Medfield homes for sale
- Millis-Clicquot homes for sale
- Milton homes for sale
- Needham homes for sale
- Norfolk homes for sale
- Norwood homes for sale
- Randolph homes for sale
- Randolph Town homes for sale
- Sharon town homes for sale
- Sharon homes for sale
- Stoughton homes for sale
- Walpole homes for sale
- Walpole town homes for sale
- West Roxbury homes for sale
- Westwood homes for sale
02062, MA - homes for sale
37 of 37 results displayed
- Open Sat, 2:30 to 4pmNew
 $839,000Active3 beds 2 baths1,656 sq. ft.
85 Prospect St, Norwood, MA 02062
MLS# 73530589Listed by: NextHome Signature Realty - Open Sat, 2 to 4pmNew
 $345,700Active2 beds 1 baths832 sq. ft.
226 Rock St #D1, Norwood, MA 02072
MLS# 73530318Listed by: Redfin Corp. - Open Sat, 11am to 1pmNew
 $1,150,000Active4 beds 3 baths2,655 sq. ft.
62 Fulton St, Norwood, MA 02062
MLS# 73528968Listed by: Keller Williams Realty Signature Properties - Open Sat, 12 to 2pmNew
 $424,900Active1 beds 1 baths908 sq. ft.
19 Rose Ct #19, Norwood, MA 02062
MLS# 73528438Listed by: Realty Advantage - Open Sat, 12 to 2pmNew
 $745,500Active3 beds 2 baths1,867 sq. ft.
419 Prospect St, Norwood, MA 02062
MLS# 73524361Listed by: RE/MAX Real Estate Center - Open Sat, 12 to 1:30pmNew
 $1,490,000Active2 beds 3 baths3,299 sq. ft.
16 Cape Club Dr #16, Sharon, MA 02067
MLS# 73527743Listed by: Skyline Realty - New
 $479,900Active3 beds 1 baths1,238 sq. ft.
101 Monroe St, Norwood, MA 02062
MLS# 73526441Listed by: RE/MAX Real Estate Center - New
 $759,000Active4 beds 2 baths1,683 sq. ft.
111 Gay St, Norwood, MA 02062
MLS# 73525477Listed by: Century 21 North East Homes - New
 $699,900Active3 beds 2 baths2,450 sq. ft.
103 Lane Dr, Norwood, MA 02062
MLS# 73524732Listed by: Berkshire Hathaway HomeServices Evolution Properties - New
 $995,000Active5 beds 3 baths2,888 sq. ft.
397 Washington St, Norwood, MA 02062
MLS# 73524809Listed by: NextHome Signature Realty - New
 $769,000Active3 beds 2 baths1,780 sq. ft.
33 Heather Drive, Norwood, MA 02062
MLS# 73524628Listed by: Coldwell Banker Realty - Westwood - New
 $739,000Active3 beds 2 baths1,282 sq. ft.
25 First Street, Norwood, MA 02062
MLS# 73524581Listed by: Keller Williams Elite - Open Sat, 12 to 1:30pmNew
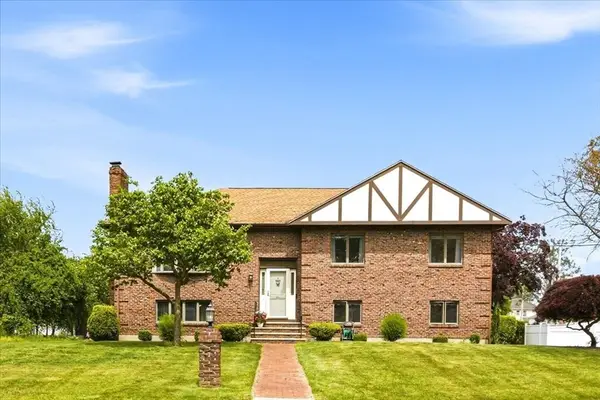
 $900,000Active2 beds 2 baths2,442 sq. ft.
24 Short St, Norwood, MA 02062
MLS# 73524534Listed by: Conway - West Roxbury - Open Sun, 12 to 1pmNew
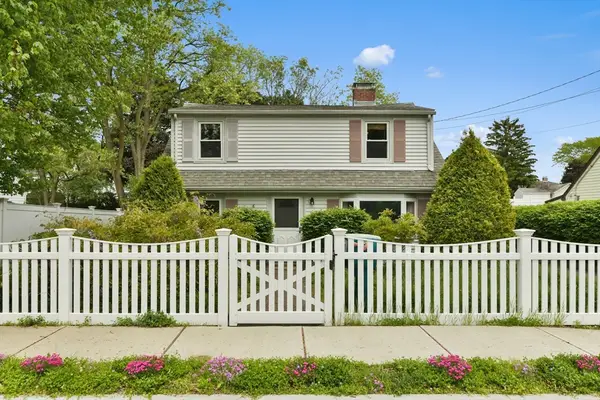 $699,900Active4 beds 2 baths1,686 sq. ft.
35 Alandale Pkwy, Norwood, MA 02062
MLS# 73523800Listed by: RE/MAX Real Estate Center - Open Sat, 12 to 2pmNew
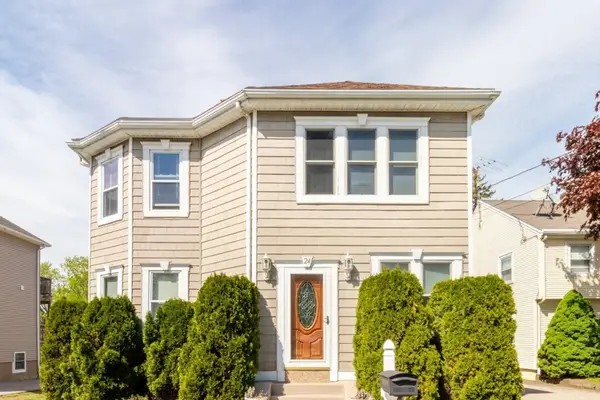
 $899,999Active3 beds 3 baths2,706 sq. ft.
27 Feeney Road, Norwood, MA 02062
MLS# 73523742Listed by: Navigate Real Estate Corp. 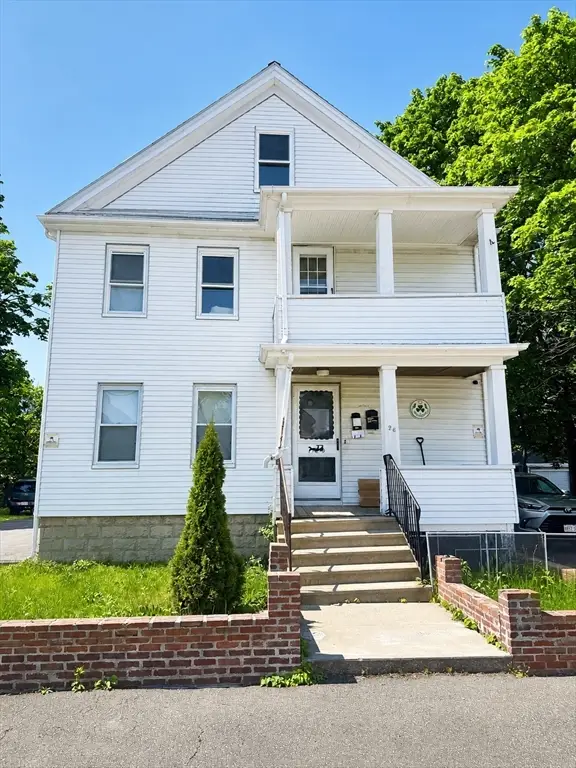 $850,000Active5 beds 4 baths1,812 sq. ft.
26 Tremont St, Norwood, MA 02062
MLS# 73523134Listed by: Colonial Realty Associates, LLC $275,000Active1 beds 1 baths704 sq. ft.
251 Rock Street #B7, Norwood, MA 02062
MLS# 73523034Listed by: Donahue Real Estate Co.- Open Sat, 11am to 1pm
 $741,000Active3 beds 2 baths1,620 sq. ft.
130 Dean St, Norwood, MA 02062
MLS# 73522591Listed by: Mega Realty Services  $364,000Active1 beds 1 baths752 sq. ft.
140 Railroad Ave #B111, Norwood, MA 02062
MLS# 73521717Listed by: REMAX Executive Realty- Open Sat, 1 to 2:30pm
 $795,000Active2 beds 4 baths2,395 sq. ft.
60 Lenox St #12, Norwood, MA 02062
MLS# 73518521Listed by: Coldwell Banker Realty - Sharon - Open Sat, 12 to 2pm
 $789,000Active4 beds 2 baths1,548 sq. ft.
118 Spruce Road, Norwood, MA 02062
MLS# 73517975Listed by: REMAX Executive Realty  $635,000Active2 beds 2 baths1,378 sq. ft.
70 Endicott St #1505, Norwood, MA 02062
MLS# 73517800Listed by: Redfin Corp.- Open Fri, 1 to 2pm
 $1,150,000Active7 beds 3 baths2,488 sq. ft.
244 Washington Street, Norwood, MA 02062
MLS# 73516373Listed by: Capital Realty Group 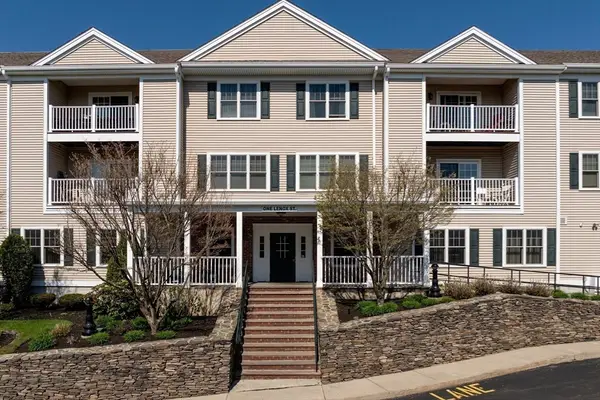 $599,900Active2 beds 2 baths1,518 sq. ft.
1 Lenox Street #303, Norwood, MA 02062
MLS# 73513592Listed by: RE/MAX Real Estate Center- Open Sat, 1 to 2:30pm
 $929,000Active3 beds 3 baths2,657 sq. ft.
41 Sunset Ave #41, Norwood, MA 02062
MLS# 73514447Listed by: Block Realty  $750,000Active4 beds 2 baths2,015 sq. ft.
15 Mayflower Road, Norwood, MA 02062
MLS# 73512367Listed by: REMAX Executive Realty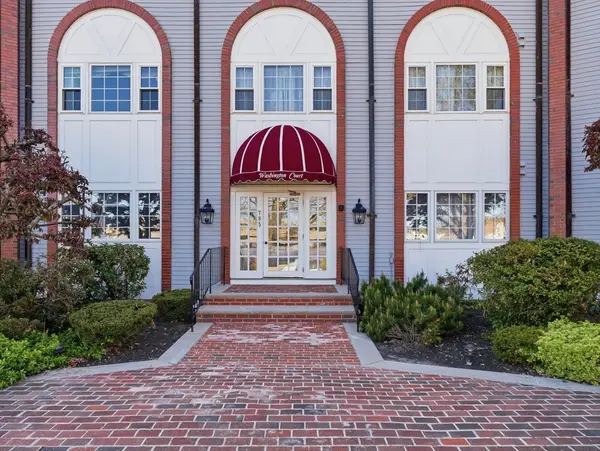 $489,000Active2 beds 2 baths1,132 sq. ft.
785 Washington St #105, Norwood, MA 02062
MLS# 73511521Listed by: eXp Realty LLC - Corporate Office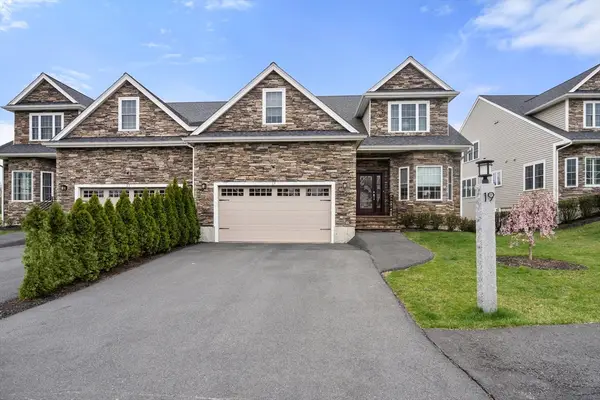 $1,389,000Active2 beds 3 baths3,300 sq. ft.
19 Cape Club Drive #19, Sharon, MA 02067
MLS# 73509493Listed by: Coldwell Banker Realty - Westwood $1,369,000Active5 beds 5 baths5,079 sq. ft.
28 Lancelot Ct, Norwood, MA 02062
MLS# 73504716Listed by: NextHome Signature Realty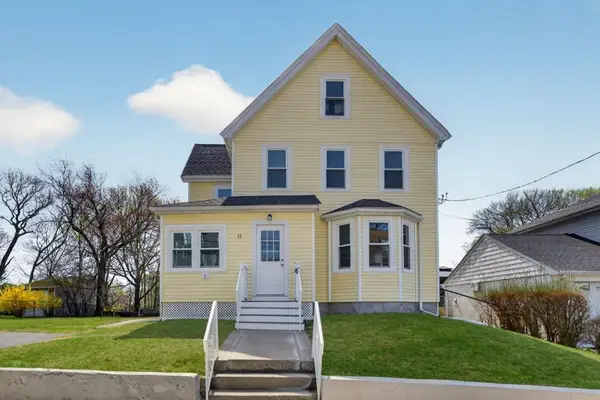 $925,000Active5 beds 3 baths2,233 sq. ft.
11 Quincy Ave, Norwood, MA 02062
MLS# 73502529Listed by: Moor Realty Group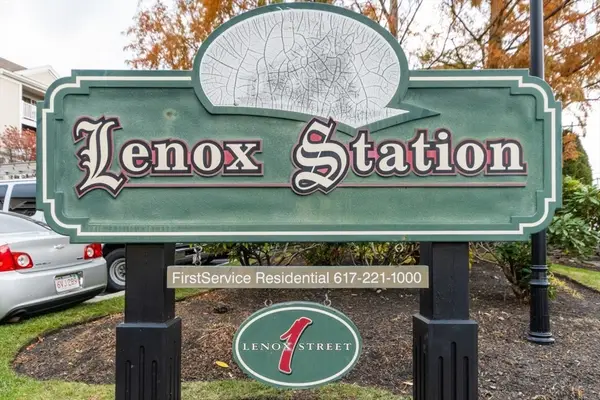 $559,900Active2 beds 2 baths1,398 sq. ft.
1 Lenox St #312, Norwood, MA 02062
MLS# 73500248Listed by: Conway - Canton- Open Sat, 11am to 12:30pm
 $339,000Active1 beds 1 baths704 sq. ft.
251 Rock St #B4, Norwood, MA 02062
MLS# 73499944Listed by: Homes-R-Us Realty of MA, Inc.  $629,000Active2 beds 2 baths1,378 sq. ft.
70 Endicott Street #305, Norwood, MA 02062
MLS# 73498919Listed by: TG Real Estate Consultants- Open Sat, 2 to 3pm
 $659,000Active3 beds 1 baths1,440 sq. ft.
33 Sumner St, Norwood, MA 02062
MLS# 73493030Listed by: Berkshire Hathaway HomeServices Commonwealth Real Estate  $995,000Active7 beds 3 baths2,807 sq. ft.
23-25 Hoyle St, Norwood, MA 02062
MLS# 73489043Listed by: Coldwell Banker Realty - Westwood $1,795,000Active4 beds 4 baths3,676 sq. ft.
764 Neponset St, Norwood, MA 02062
MLS# 73454658Listed by: Compass $1,070,000Active10 beds 3 baths3,168 sq. ft.
4 Baker Street, Norwood, MA 02062
MLS# 73175111Listed by: The Hunte Group REALTORS®
Local realty services provided by:CENTURY 21 North East
Popular searches near 02062
Popular neighborhoods near 02062
- Boston Harbor, Dorchester Center homes for sale
- Dana Hall, Wellesley homes for sale
- Fairmount Hill, Hyde Park homes for sale
- Forest Hills, Jamaica Plain homes for sale
- Hyde Park, Hyde Park homes for sale
- Linden Square, Wellesley Hills homes for sale
- Lower Mills, Dorchester Center homes for sale
- Mattapan, Mattapan homes for sale
- Moss Hill, Jamaica Plain homes for sale
- Newton Highlands, Newton Highlands homes for sale
- Newton Upper Falls, Newton Upper Falls homes for sale
- Oak Hill, Newton Center homes for sale
- Oak Hill Park, Newton Center homes for sale
- Roslindale, Roslindale homes for sale
- South Brookline, Chestnut Hill homes for sale
- Thompsonville, Newton Center homes for sale
- Wellesley Hills, Wellesley Hills homes for sale
- Wellesley Square, Wellesley homes for sale
- Wellington Hill, Mattapan homes for sale
- West Roxbury, West Roxbury homes for sale
Counties near Norwood, 02062
- Barnstable County homes for sale
- Bristol County homes for sale
- Bristol County homes for sale
- Dukes County homes for sale
- Essex County homes for sale
- Hillsborough County homes for sale
- Kent County homes for sale
- Middlesex County homes for sale
- Newport County homes for sale
- Norfolk County homes for sale
- Northeastern Connecticut County homes for sale
- Plymouth County homes for sale
- Providence County homes for sale
- Rockingham County homes for sale
- Southeastern Connecticut County homes for sale
- Suffolk County homes for sale
- Tolland County homes for sale
- Washington County homes for sale
- Windham County homes for sale
- Worcester County homes for sale
Protect your home and budget from life's surprises with an Assurant Home Warranty, backed by a partner that supports you through every step of homeownership. Explore Plans.
©2026 Century 21 Real Estate LLC. All rights reserved. CENTURY 21®, the CENTURY 21 Logo and C21® are service marks owned by Century 21 Real Estate LLC. Century 21 Real Estate LLC fully supports the principles of the Fair Housing Act and the Equal Opportunity Act. Each office is independently owned and operated. Listing information is deemed reliable but not guaranteed accurate.