- Ampere North homes for sale
- Belleville homes for sale
- Bloomfield homes for sale
- East Newark homes for sale
- East Orange homes for sale
- East Rutherford homes for sale
- Harrison homes for sale
- Hoboken homes for sale
- Jersey City homes for sale
- Kearny homes for sale
- Lyndhurst homes for sale
- Newark homes for sale
- North Arlington homes for sale
- North Bergen homes for sale
- Nutley homes for sale
- Rutherford homes for sale
- Secaucus homes for sale
- Silver Lake homes for sale
- Union City homes for sale
- Watsessing homes for sale
07032, NJ - homes for sale
99 of 99 results displayed
- New
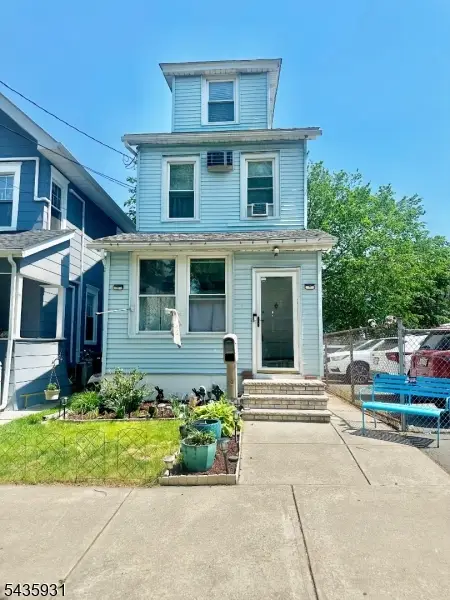
 $475,000Active3 beds 2 baths
18 Pleasant Place, Kearny, NJ 07032
MLS# 26020636Listed by: REAL
- Open Sat, 1 to 3pmNew
 $795,000Active4 beds 3 baths
132 Argyle Pl, Kearny Town, NJ 07032
MLS# 4032503Listed by: DUARTE HOMES AGENCY LLC - Open Sat, 11am to 2pmNew
 $606,655Active2 beds 2 baths
400 Willow Street 408, Kearny, NJ 07032
MLS# 26020758Listed by: PULTE COMMUNITIES OF NJ LIMITED PARTNERSHIP - Open Tue, 6 to 7pmNew
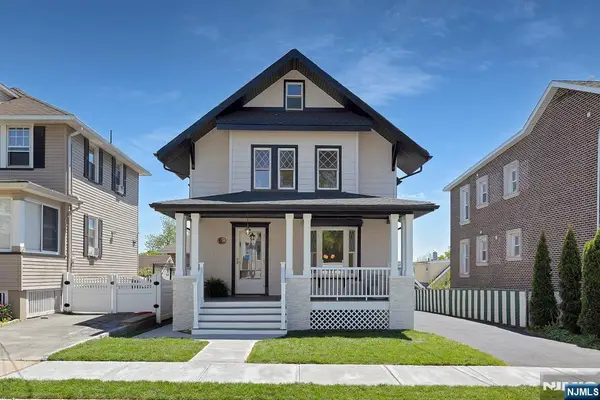
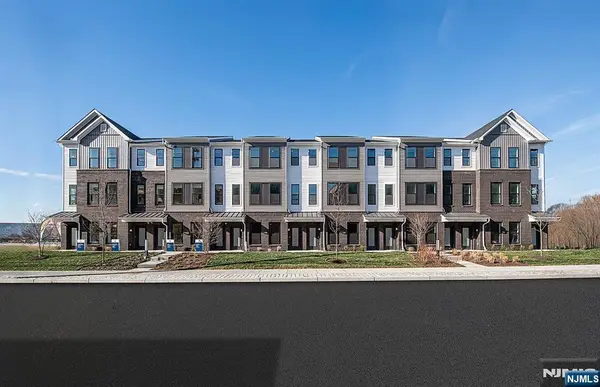
 $775,000Active-- beds 2 baths
105 Bergen Avenue, Kearny, NJ 07032
MLS# 26020793Listed by: KELLER WILLIAMS PROSPERITY REALTY - New
 $699,998Active6 beds 4 baths
8 PROSPECT PL, Kearny, NJ 07032
MLS# 260010833Listed by: REAL - New
 $549,000Active3 beds 2 baths
511 Hickory Street, Kearny, NJ 07032
MLS# 26004455Listed by: BERKSHIRE HATHAWAY HOME SERVICES MERENDINO REALTY - New
 $499,000Active3 beds 1 baths
95 PARK PL, Kearny, NJ 07032
MLS# 260010491Listed by: THE AGENCY - RUTHERFORD - New
 $500,000Active3 beds 1 baths
150 Beech St, Kearny Town, NJ 07032
MLS# 4031088Listed by: REALTY ONE GROUP LEGEND - New
 $899,000Active5 beds 3 baths1,524 sq. ft.
145 Tappan St, Kearny Town, NJ 07032
MLS# 4030520Listed by: REALTY ONE GROUP LIFESTYLE HOMES 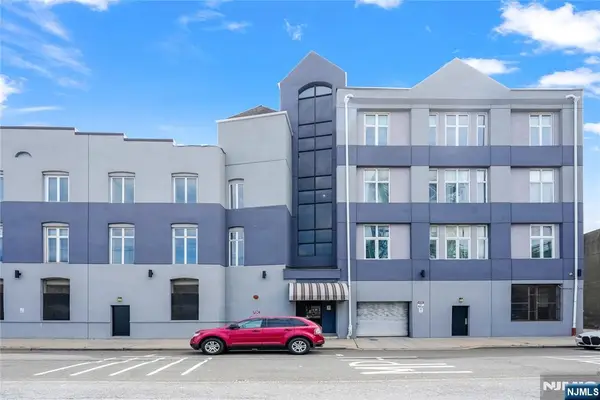 $329,000Active2 beds 2 baths
308-310 Passaic Avenue 402, Harrison, NJ 07032
MLS# 26019121Listed by: NENO-ROSA AGENCY $499,000Pending3 beds 2 baths
412 Davis Avenue, Kearny, NJ 07032
MLS# 26018982Listed by: KELLER WILLIAMS CITY VIEWS REALTY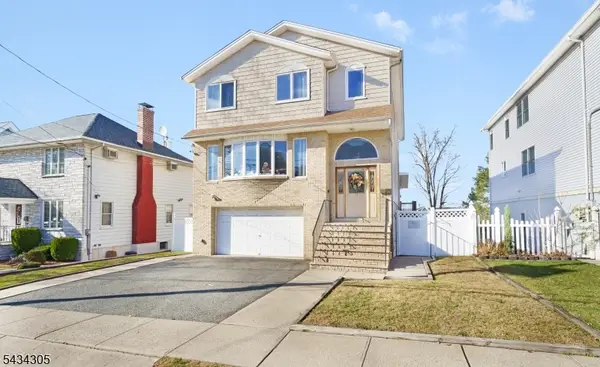 $850,000Active4 beds 4 baths
17 Pleasant Pl, Kearny Town, NJ 07032
MLS# 4029628Listed by: STAR REAL ESTATE AGENCY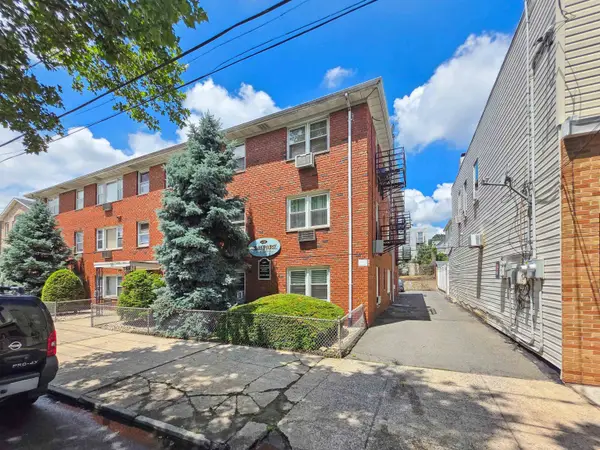 $270,000Active1 beds 1 baths612 sq. ft.
475 ELM ST #3A, Kearny, NJ 07032-3569
MLS# 260009736Listed by: EXIT GOLDEN REALTY GROUP $599,000Pending2 beds 3 baths
795-797 Kearny Avenue, Kearny, NJ 07032
MLS# 26018447Listed by: AGENCY ON THE AVE, LLC $585,000Active3 beds 3 baths
416 Belgrove Dr, Kearny Town, NJ 07032
MLS# 4028871Listed by: REDFIN CORPORATION $549,000Active4 beds 2 baths
43 Terrace Place, Kearny, NJ 07032
MLS# 26016804Listed by: MID-REALTY, INC. $599,000Pending2 beds 3 baths1,760 sq. ft.
795 Kearny Ave, Kearny Town, NJ 07032
MLS# 4028838Listed by: AGENCY ON THE AVE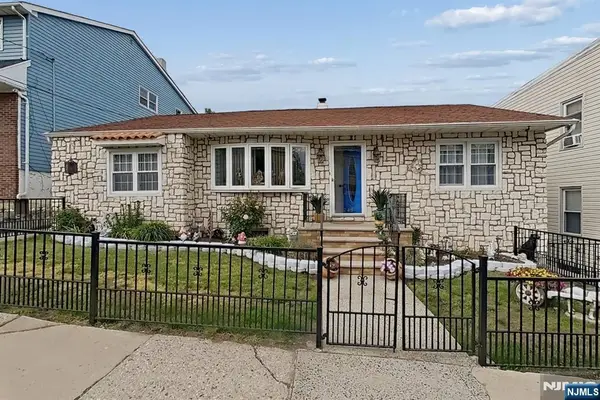 $525,000Active2 beds 1 baths
249 Bergen Avenue, Kearny, NJ 07032
MLS# 26016988Listed by: EXIT GOLDEN REALTY GROUP, LLC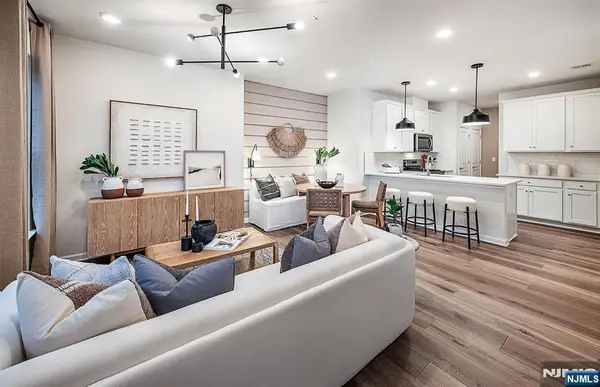 $599,990Active2 beds 2 baths
55 Passaic Avenue 200 Balsam St #, Kearny, NJ 07032
MLS# 26017908Listed by: PULTE COMMUNITIES OF NJ LIMITED PARTNERSHIP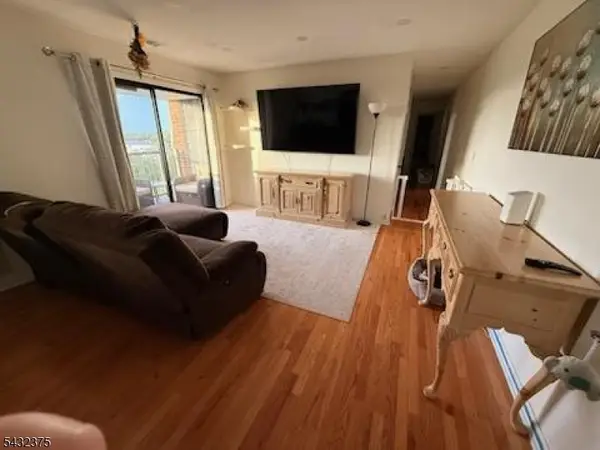 $329,000Pending2 beds 1 baths
700 Schuyler Ave #G33, Kearny Town, NJ 07032
MLS# 4028080Listed by: SMIRES & ASSOCIATES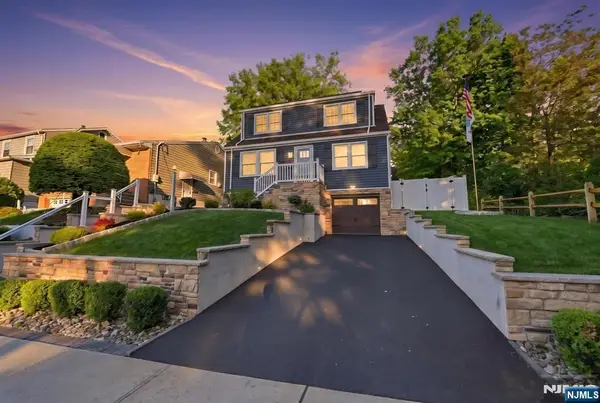 $699,000Pending4 beds 3 baths
44 Alpine Place, Kearny, NJ 07032
MLS# 26017541Listed by: EXP REALTY, LLC $499,000Active3 beds 2 baths
183 Devon Street, Kearny, NJ 07032
MLS# 26015051Listed by: NENO-ROSA AGENCY $798,000Active-- beds 6 baths
88 Devon Street, Kearny, NJ 07032
MLS# 26017390Listed by: COLDWELL BANKER, RIDGEWOOD $449,900Pending2 beds 2 baths
20 S Midland Avenue H2, Kearny, NJ 07032
MLS# 26017313Listed by: RE/MAX LIFETIME REALTORS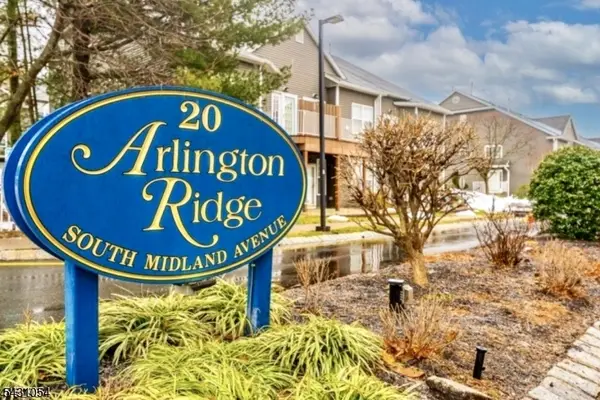 $449,900Pending2 beds 2 baths
20 S Midland Ave #2, Kearny Town, NJ 07032
MLS# 4027080Listed by: RE/MAX LIFETIME REALTORS $769,000Pending-- beds 4 baths
671 Devon Street, Kearny, NJ 07032
MLS# 26016283Listed by: NENO-ROSA AGENCY $285,000Pending1 beds 1 baths
700 Schuyler Avenue D-13, Kearny, NJ 07032
MLS# 26017104Listed by: UNITED REAL ESTATE $850,000Pending4 beds 4 baths
19 Pleasant Place, Kearny, NJ 07032
MLS# 26016943Listed by: COCCIA REALTY BETTER HOMES & GARDENS $750,000Active5 beds 5 baths
23 Pleasant Place, Kearny, NJ 07032
MLS# 26016911Listed by: PRESTIGE PROPERTY GROUP - MONTCLAIR $339,999Active2 beds 1 baths
475 Elm 1C, Kearny, NJ 07032
MLS# 26016162Listed by: MID-REALTY, INC.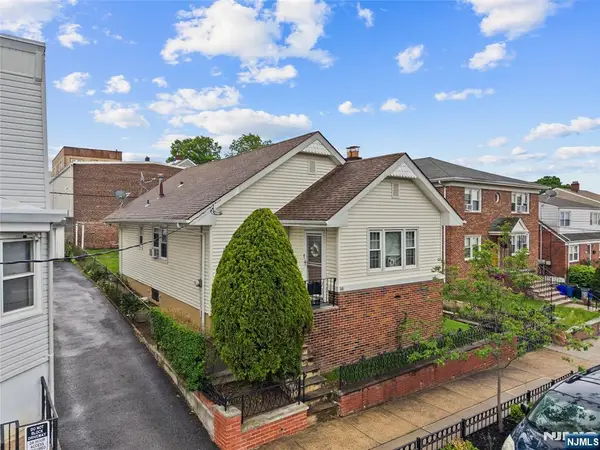 $549,000Pending3 beds 2 baths
94 Maple, Kearny, NJ 07032
MLS# 26016404Listed by: MID-REALTY, INC.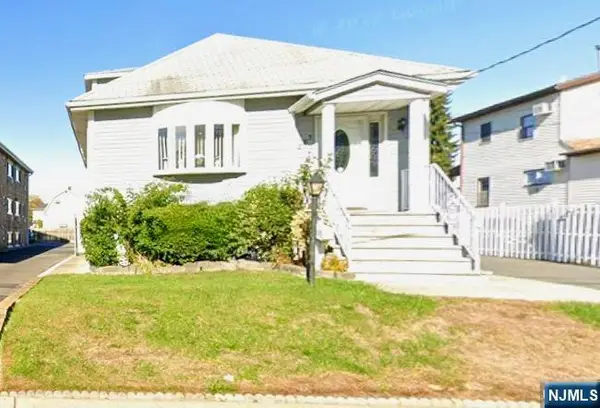 $549,900Active2 beds 2 baths
887 Schuyler Avenue, Kearny, NJ 07032
MLS# 26016417Listed by: MID-REALTY, INC.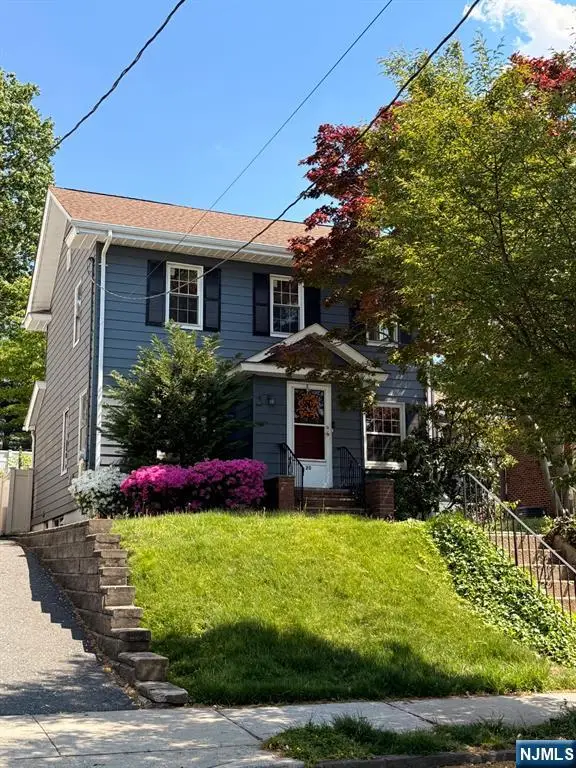
 $549,000Pending3 beds 2 baths
20 Clinton Avenue, Kearny, NJ 07032
MLS# 26013737Listed by: CENTURY 21 SEMIAO & ASSOCIATES- Open Sat, 1 to 3pm
 $795,000Active4 beds 3 baths
132 Argyle Place, Kearny, NJ 07032
MLS# 26015908Listed by: DUARTE HOMES AGENCY LLC  $649,900Pending3 beds 3 baths
21 Park Place, Kearny, NJ 07032
MLS# 26015347Listed by: THE BIXLER GROUP, LLC $425,000Pending2 beds 2 baths
66 Forest Street, Kearny, NJ 07032
MLS# 26015342Listed by: CENTURY 21 SEMIAO & ASSOCIATES $399,000Pending3 beds 1 baths
602 Elm Street, Kearny, NJ 07032
MLS# 26014692Listed by: THE BIXLER GROUP, LLC $789,900Active-- beds 2 baths
29 Magnolia Avenue, Kearny, NJ 07032
MLS# 26015028Listed by: ARLINGTON REAL ESTATE CO., INC $595,000Pending3 beds 2 baths
148 Magnolia Avenue, Kearny, NJ 07032
MLS# 26014268Listed by: COCCIA REALTY BETTER HOMES & GARDENS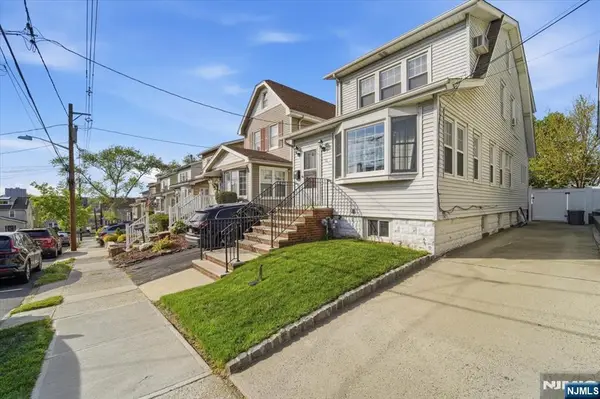 $549,900Pending3 beds 1 baths
13 Butler Place, Kearny, NJ 07032
MLS# 26014362Listed by: THE BIXLER GROUP, LLC $689,000Active3 beds 3 baths
195 Maple St, Kearny Town, NJ 07011
MLS# 4023053Listed by: COLDWELL BANKER REALTY $560,000Pending4 beds 3 baths
728 Devon Street, Kearny, NJ 07032
MLS# 26014466Listed by: NENO-ROSA AGENCY $859,000Pending5 beds 3 baths
397 Davis Ave, Kearny Town, NJ 07032
MLS# 4022509Listed by: NENO-ROSA AGENCY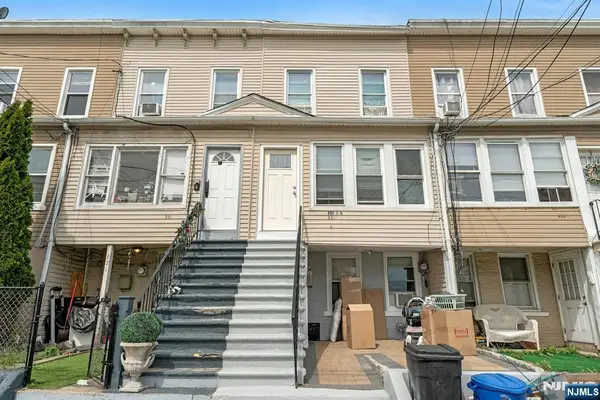 $410,000Active3 beds 1 baths
331 1/2 Forest Street, Kearny, NJ 07032
MLS# 26013935Listed by: NENO-ROSA AGENCY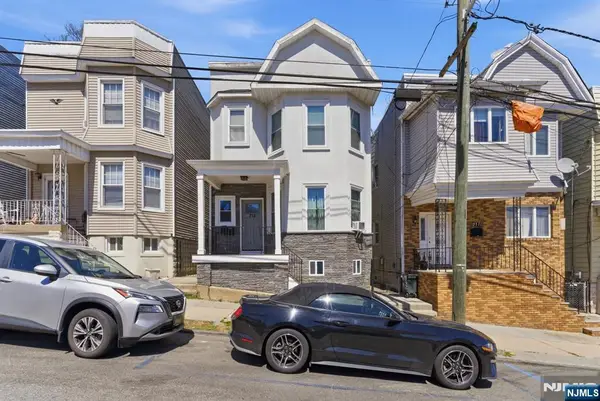 $880,000Active-- beds 3 baths
215 Wilson Avenue, Kearny, NJ 07032
MLS# 26013389Listed by: UNITED REAL ESTATE $599,000Active3 beds 2 baths
656 Devon Street, Kearny, NJ 07032
MLS# 26013373Listed by: REDFIN CORPORATION- Open Sat, 11am to 2pm
 $714,825Active2 beds 3 baths
55 Passaic Avenue 400 Sycamore St, Kearny, NJ 07032
MLS# 26013192Listed by: PULTE COMMUNITIES OF NJ LIMITED PARTNERSHIP  $785,000Active3 beds 3 baths
400 Sycamore Street 405, Kearny, NJ 07032
MLS# 26013204Listed by: PULTE COMMUNITIES OF NJ LIMITED PARTNERSHIP $899,990Active3 beds 3 baths
400 Sycamore Street 402, Kearny, NJ 07032
MLS# 26013220Listed by: PULTE COMMUNITIES OF NJ LIMITED PARTNERSHIP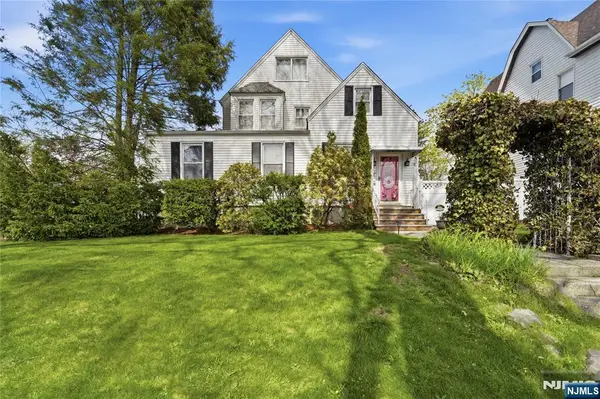 $699,900Pending4 beds 4 baths
3 Stuyvesant Avenue, Kearny, NJ 07032
MLS# 26012497Listed by: THE BIXLER GROUP, LLC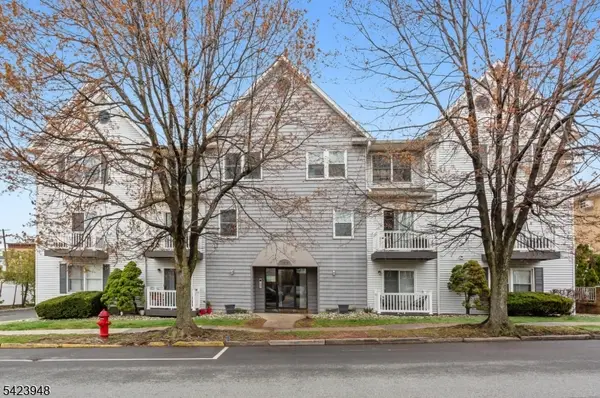 $345,000Pending2 beds 2 baths
483 Forest St #10, Kearny Town, NJ 07032
MLS# 4020320Listed by: MODERN REALTY GROUP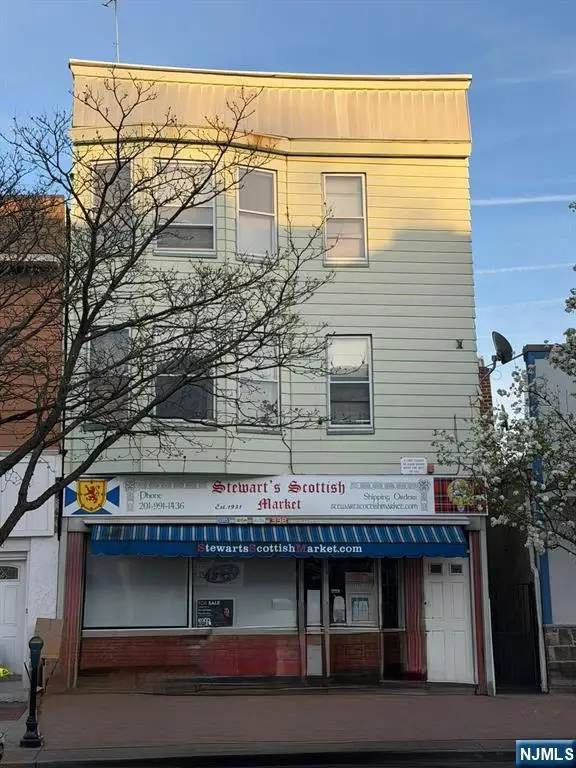 $779,900Pending-- beds -- baths
338 Kearny Avenue, Kearny, NJ 07032
MLS# 26011571Listed by: EXP REALTY, LLC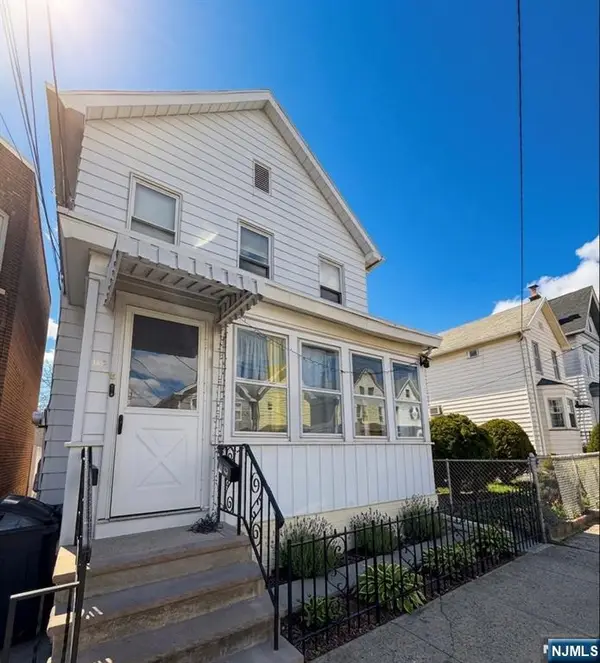 $599,000Active-- beds 2 baths
110 Tappan Street, Kearny, NJ 07032
MLS# 26011779Listed by: REAL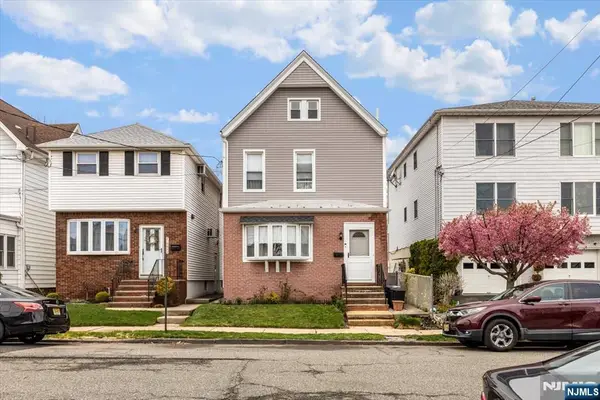 $469,000Pending4 beds 2 baths
513 Hickory Street, Kearny, NJ 07032
MLS# 26010854Listed by: KELLER WILLIAMS PARK VIEWS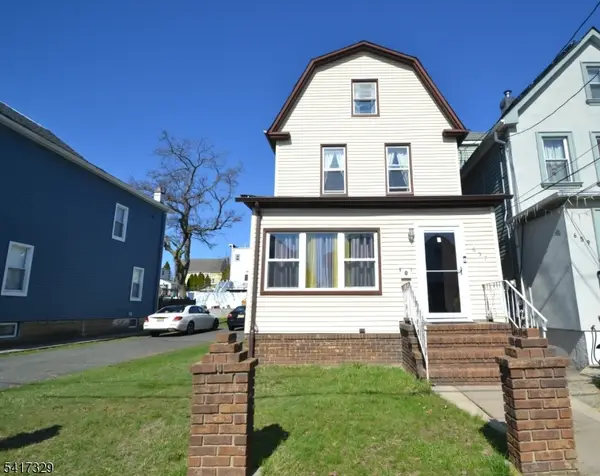 $525,000Pending4 beds 2 baths
655 Chestnut St, Kearny Town, NJ 07032
MLS# 4018244Listed by: JK REALTY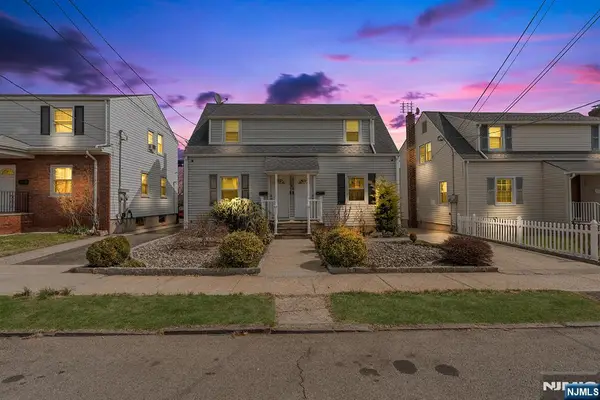 $698,888Pending-- beds 3 baths
240 Ivy, Kearny, NJ 07032
MLS# 26010890Listed by: KELLER WILLIAMS PARK VIEWS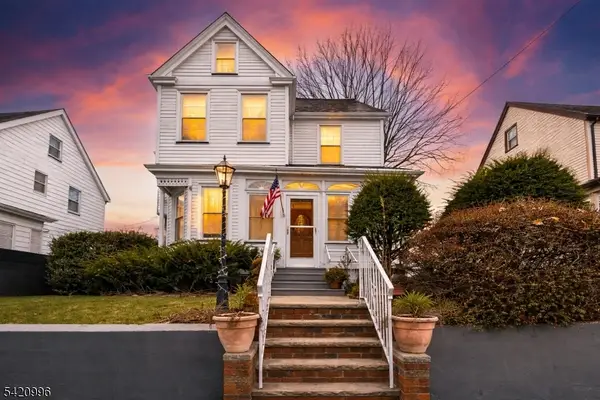 $675,000Pending4 beds 4 baths
144 Stuyvesant Ave, Kearny Town, NJ 07032
MLS# 4017733Listed by: ACCESS HOME REALTY $895,000Active4 beds 4 baths
130A Brighton Ave, Kearny Town, NJ 07032
MLS# 4017737Listed by: CHRISTIE'S INT. REAL ESTATE GROUP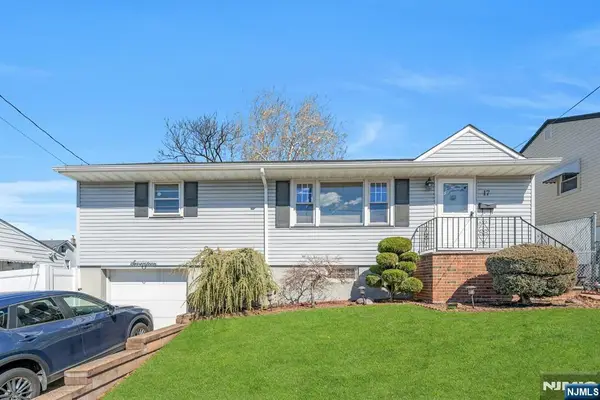 $565,000Pending3 beds 2 baths
17 Peden Terrace, Kearny, NJ 07032
MLS# 26008648Listed by: NENO-ROSA AGENCY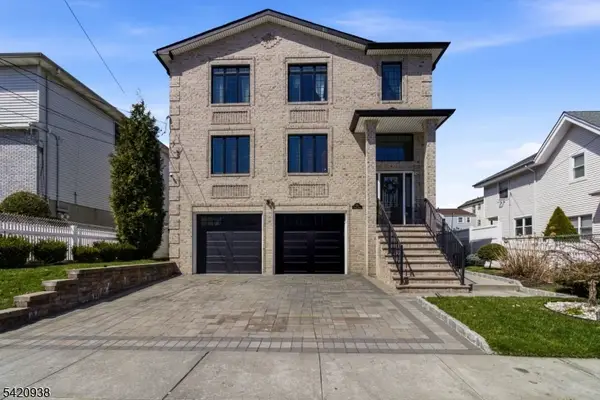 $1,275,000Pending6 beds 5 baths
431 Forest St, Kearny Town, NJ 07032
MLS# 4017695Listed by: C-21 SEMIAO & ASSOCIATES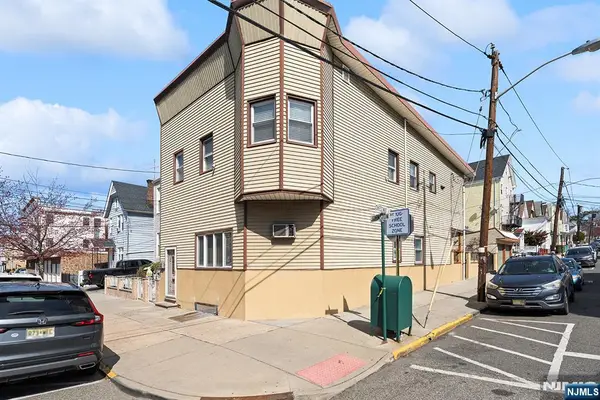 $799,888Pending-- beds 3 baths
131 Johnston Avenue, Kearny, NJ 07032
MLS# 26010569Listed by: KELLER WILLIAMS PARK VIEWS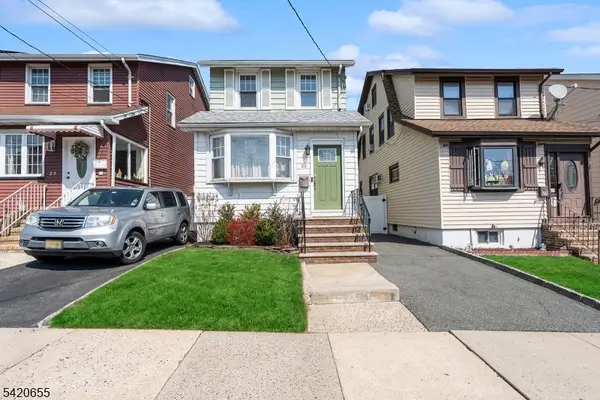 $529,888Active3 beds 1 baths
25 Shepherd Pl, Kearny Town, NJ 07032
MLS# 4017524Listed by: KELLER WILLIAMS PARK VIEWS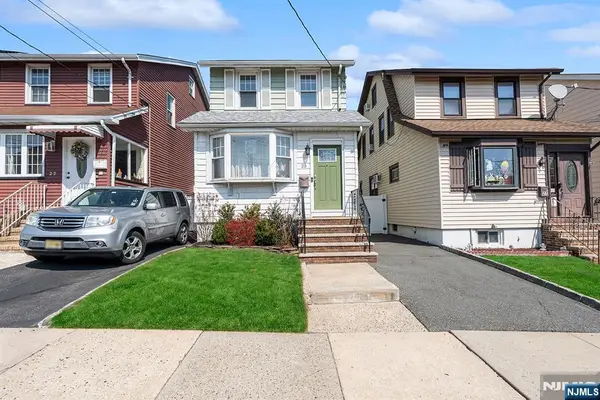 $529,888Active3 beds 1 baths
25 Shepherd, Kearny, NJ 07032
MLS# 26010512Listed by: KELLER WILLIAMS PARK VIEWS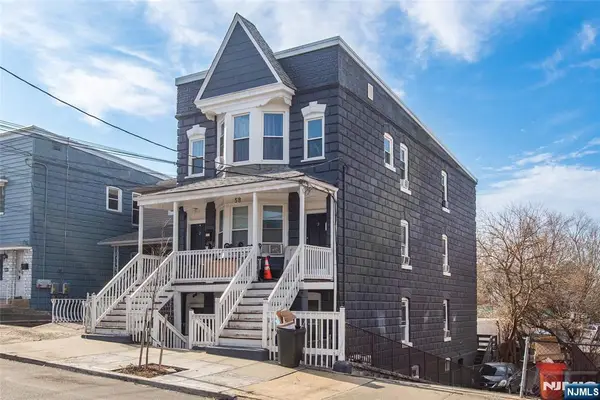 $799,999Pending-- beds 3 baths
58 Wilson Avenue, Kearny, NJ 07032
MLS# 26010213Listed by: COLDWELL BANKER, HILLSDALE $559,000Pending3 beds 3 baths
692 Passaic Ave, Kearny Town, NJ 07032
MLS# 4016987Listed by: COLDWELL BANKER REALTY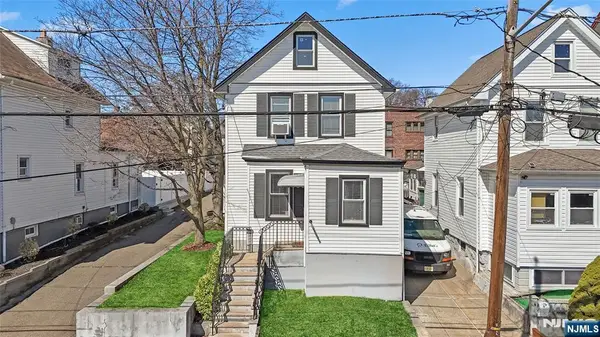 $539,000Active3 beds 2 baths
117 Argyle Place, Kearny, NJ 07032
MLS# 26009610Listed by: PRESTIGE PROPERTY GROUP - MONTCLAIR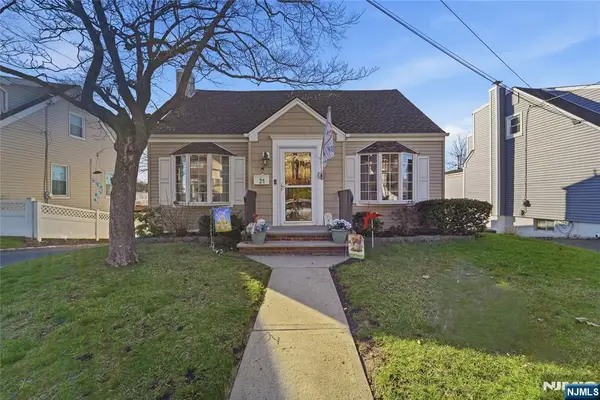 $649,900Active3 beds 3 baths
21 Park Place, Kearny, NJ 07032
MLS# 26009615Listed by: THE BIXLER GROUP, LLC $828,630Pending-- beds 3 baths
26 Halstead Street, Kearny, NJ 07032
MLS# 26009751Listed by: MID-REALTY, INC. $319,000Pending3 beds 1 baths
680 1/2 Chestnut Street, Kearny, NJ 07032
MLS# 26009644Listed by: KELLER WILLIAMS PARK VIEWS $319,000Pending3 beds 1 baths
680 12chestnut St, Kearny Town, NJ 07032
MLS# 4016304Listed by: KELLER WILLIAMS PARK VIEWS $809,900Pending-- beds 3 baths
547 Elm Street, Kearny, NJ 07032
MLS# 26009034Listed by: RE/MAX VILLA REALTORS-NORTH BERGEN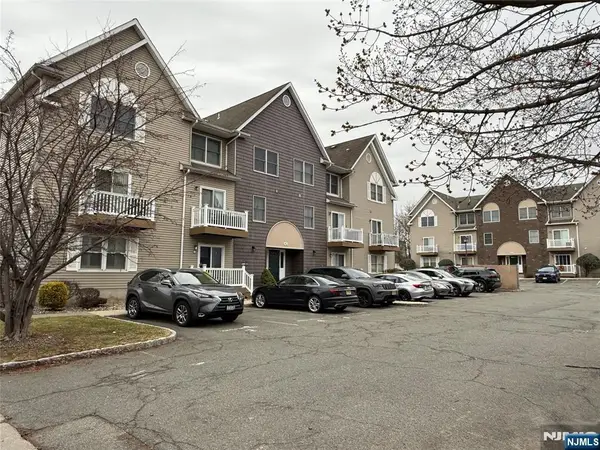 $409,000Pending2 beds 2 baths
474 Forest Street 11, Kearny, NJ 07032
MLS# 26003704Listed by: CENTURY 21 GENTRY REALTORS $795,000Active5 beds 5 baths
23 Pleasant Place, Kearny, NJ 07032
MLS# 26004979Listed by: PRESTIGE PROPERTY GROUP - MONTCLAIR $1,199,000Pending-- beds -- baths
683 Kearny Avenue, Kearny, NJ 07032
MLS# 26007803Listed by: CENTURY 21 SEMIAO & ASSOCIATES $419,999Active2 beds 2 baths
390 Forest St, Kearny Town, NJ 07032
MLS# 4013923Listed by: LIM BANCES REALTY $799,900Active-- beds 2 baths
29 Magnolia Avenue, Kearny, NJ 07032
MLS# 26007694Listed by: ARLINGTON REAL ESTATE CO., INC $799,000Pending7 beds 3 baths
18-20 Rutland Ave, Kearny Town, NJ 07032
MLS# 4013689Listed by: BRIGHT STAR REALTY & RENTALS LLC $550,000Pending4 beds 3 baths
22 Schuyler Ave, Kearny Town, NJ 07032
MLS# 4012497Listed by: KELLER WILLIAMS - NJ METRO GROUP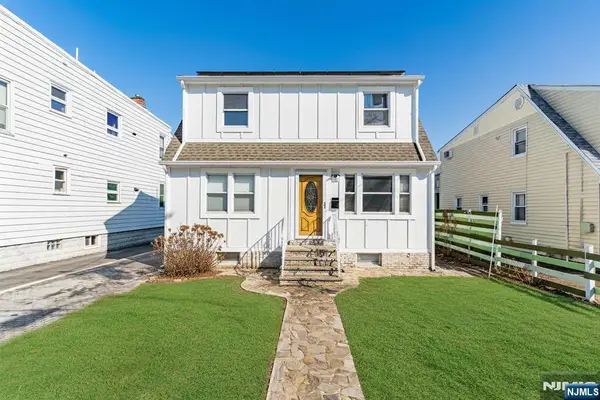 $550,000Pending4 beds 3 baths
22 Schuyler Avenue, Kearny, NJ 07032
MLS# 26006954Listed by: KELLER WILLIAMS REALTY - NJ METRO GROUP- Open Sun, 1 to 3pm
 $985,000Active6 beds 6 baths
632 Belgrove Drive, Kearny, NJ 07032
MLS# 26005640Listed by: CENTURY 21 SEMIAO & ASSOCIATES 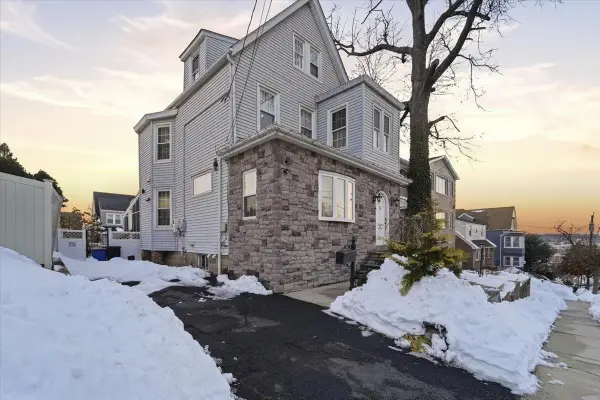 $825,000Active3 beds 4 baths
60 STEWART AVE, Kearny, NJ 07032
MLS# 260003304Listed by: HOWARD HANNA RAND REALTY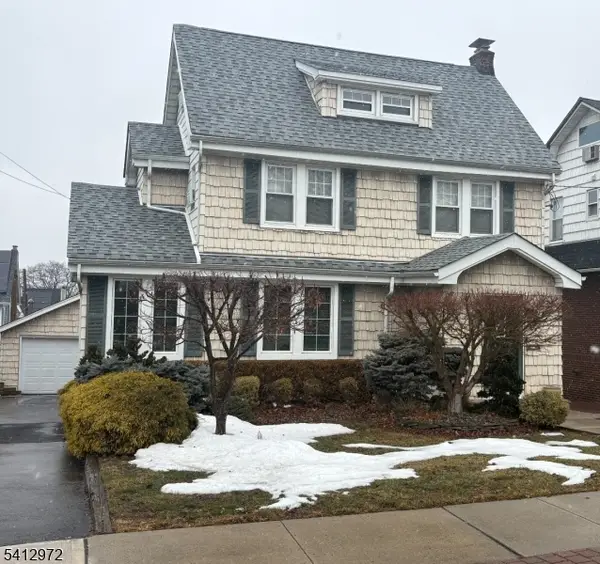 $649,000Pending3 beds 3 baths
5 Hamilton Ave, Kearny Town, NJ 07032
MLS# 4011046Listed by: KELLER WILLIAMS PARK VIEWS $590,000Active4 beds 3 baths
728 Devon Street, Kearny, NJ 07032
MLS# 26005247Listed by: ACCESS HOMES REALTY $744,990Pending3 beds 3 baths
55 Passaic Avenue 100 Balsam St #, Kearny, NJ 07032
MLS# 26004274Listed by: PULTE COMMUNITIES OF NJ LIMITED PARTNERSHIP $699,990Active2 beds 3 baths
55 Passaic Avenue 500 Willow St #, Kearny, NJ 07032
MLS# 26003449Listed by: PULTE COMMUNITIES OF NJ LIMITED PARTNERSHIP $768,990Pending3 beds 3 baths
55 Passaic Avenue 100 Balsam St #, Kearny, NJ 07032
MLS# 26003451Listed by: PULTE COMMUNITIES OF NJ LIMITED PARTNERSHIP $891,990Pending3 beds 3 baths
55 Passaic Avenue 100 Balsam St #, Kearny, NJ 07032
MLS# 26003453Listed by: PULTE COMMUNITIES OF NJ LIMITED PARTNERSHIP $799,900Active-- beds 2 baths
447 Elm Street, Kearny, NJ 07032
MLS# 26000220Listed by: HARRISON REALTY $489,000Pending2 beds 2 baths
835 Chestnut Street, Kearny, NJ 07032
MLS# 25042680Listed by: PROMINENT PROPERTIES SOTHEBY'S INTERNATIONAL REALTY-FRANKLIN LAKES $900,000Active4 beds 3 baths
17 Pleasant Place, Kearny, NJ 07032
MLS# 25042566Listed by: STAR REAL ESTATE AGENCY LLC $690,000Active5 beds 4 baths
251 Highland Ave, Kearny Town, NJ 07032
MLS# 3999543Listed by: COLDWELL BANKER REALTY RDG $519,000Active-- beds 2 baths
89 Ivy Street, Kearny, NJ 07032
MLS# 25038190Listed by: EXP REALTY, LLC $599,000Pending3 beds 2 baths
870 Passaic Avenue, Kearny, NJ 07032
MLS# 25037865Listed by: KELLER WILLIAMS REALTY - NJ METRO GROUP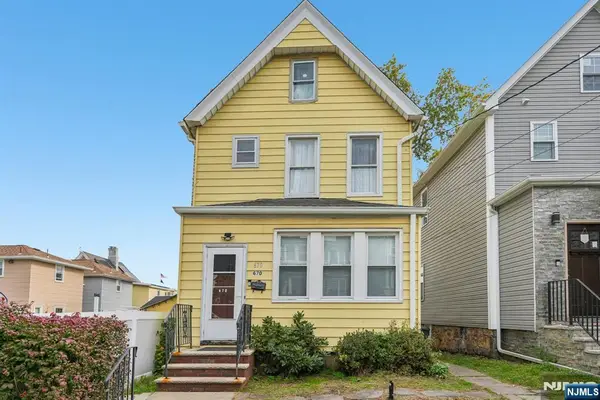 $499,000Pending3 beds 1 baths
670 Devon Street, Kearny, NJ 07032
MLS# 26001171Listed by: WEICHERT HOME CITY REALTY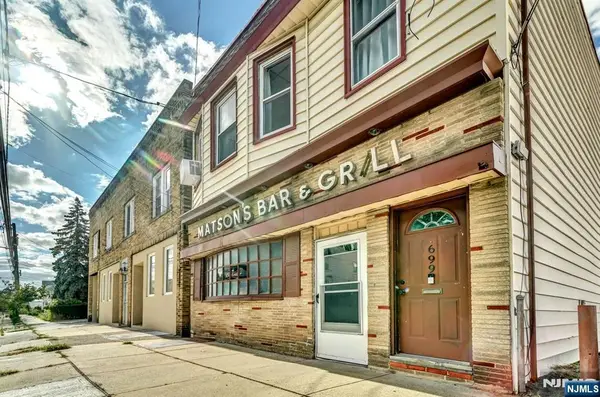 $800,000Active-- beds -- baths
699 Elm Street, Kearny, NJ 07032
MLS# 25037384Listed by: COLDWELL BANKER, HOBOKEN $459,999Pending2 beds 2 baths
390 Forest St, Kearny Town, NJ 07032
MLS# 3992739Listed by: LIM BANCES REALTY $749,000Pending-- beds 3 baths
245 Beech Street #3, Kearny Town, NJ 07032
MLS# 3971773Listed by: AGENCY ON THE AVE $750,000Active-- beds -- baths
699 Kearny Avenue, Kearny, NJ 07032
MLS# 26007252Listed by: CENTURY 21 SEMIAO & ASSOCIATES/KEARNY $450,000Pending-- beds 3 baths
217 Bergen Avenue, Kearny, NJ 07032
MLS# 24017638Listed by: PRIME REAL ESTATE GROUP
Local realty services provided by:CENTURY 21 Concept 100, CENTURY 21 JRS Realty, CENTURY 21 Semiao & Associates
The data relating to the real estate for sale on this web site comes in part from the Internet Data Exchange Program of the NJMLS. Real estate listings held by brokerage firms other than CENTURY 21 Concept 100 are marked with the Internet Data Exchange logo and information about them includes the name of the listing brokers. Some properties listed with the participating brokers do not appear on this website at the request of the seller. Listings of brokers that do not participate in Internet Data Exchange do not appear on this website.
All information deemed reliable but not guaranteed. Last date updated: February 27, 2026. Source: New Jersey Multiple Listing Service, Inc.
2026 New Jersey Multiple Listing Service, Inc. All rights reserved. NJ_MLS Member Broker: Eileen O'Driscoll
The data relating to real estate for sale on this website comes in part from the IDX Program of Garden State Multiple Listing Service, L.L.C. Real estate listings held by other brokerage firms are marked as IDX Listing. Information deemed reliable but not guaranteed. 2026 Garden State Multiple Listing Service, L.L.C. All rights reserved. Notice: The dissemination of listings on this website does not constitute the consent required by N.J.A.C. 11:5.6.1 (n) for the advertisement of listings exclusively for sale by another broker. Any such consent must be obtained in writing from the listing broker. This information is being provided for Consumers' personal, non-commercial use and may not be used for any purpose other than to identify prospective properties Consumers may be interested in purchasing. Date Last Updated October 16, 2025
The data relating to real estate for sale or rent on this website comes in part from the IDX program of the HCMLS. Real estate listings held by brokerage firms other than CENTURY 21 Semiao & Associates are marked with the HCIDX mark and the information about them includes the name of the listing broker. The information provided by this website is for personal, non-commercial use of consumers and may not be used for any purpose other than to identify prospective properties consumers may be interested in purchasing or renting. NJ_HCMLS Member Broker: Fernando G Semiao
Popular searches near 07032
Popular neighborhoods near 07032
- Bergen-Lafayette, Jersey City homes for sale
- Central Ward, Newark homes for sale
- Downtown Newark, Newark homes for sale
- East Ward, Newark homes for sale
- Five Corners, Newark homes for sale
- Forest Hill, Newark homes for sale
- Greenville, Jersey City homes for sale
- Ironbound, Newark homes for sale
- Journal Square, Jersey City homes for sale
- Lincoln Park, Newark homes for sale
- Lower Roseville, Newark homes for sale
- Mount Pleasant/Lower Broadway, Newark homes for sale
- North Broadway, Newark homes for sale
- North Ward, Newark homes for sale
- Seventh Avenue, Newark homes for sale
- Springfield/Belmont, Newark homes for sale
- The Heights, Jersey City homes for sale
- University Heights, Newark homes for sale
- Upper Roseville, Newark homes for sale
- West Side, Jersey City homes for sale
Counties near Kearny, 07032
- Bergen County homes for sale
- Bronx County homes for sale
- Essex County homes for sale
- Hudson County homes for sale
- Hunterdon County homes for sale
- Kings County homes for sale
- Mercer County homes for sale
- Middlesex County homes for sale
- Monmouth County homes for sale
- Morris County homes for sale
- Nassau County homes for sale
- New York County homes for sale
- Passaic County homes for sale
- Queens County homes for sale
- Richmond County homes for sale
- Rockland County homes for sale
- Somerset County homes for sale
- Sussex County homes for sale
- Union County homes for sale
- Westchester County homes for sale
Protect your home and budget from life's surprises with an Assurant Home Warranty, backed by a partner that supports you through every step of homeownership. Explore Plans.
©2026 Century 21 Real Estate LLC. All rights reserved. CENTURY 21®, the CENTURY 21 Logo and C21® are service marks owned by Century 21 Real Estate LLC. Century 21 Real Estate LLC fully supports the principles of the Fair Housing Act and the Equal Opportunity Act. Each office is independently owned and operated. Listing information is deemed reliable but not guaranteed accurate.