- Ampere North homes for sale
- Belleville homes for sale
- Bloomfield homes for sale
- Brookdale homes for sale
- City Of Orange homes for sale
- East Newark homes for sale
- East Orange homes for sale
- Glen Ridge homes for sale
- Harrison homes for sale
- Kearny homes for sale
- Llewellyn Park homes for sale
- Lyndhurst homes for sale
- Montclair homes for sale
- North Arlington homes for sale
- Nutley homes for sale
- Orange homes for sale
- Rutherford homes for sale
- Silver Lake homes for sale
- Upper Montclair homes for sale
- Watsessing homes for sale
07109, NJ - homes for sale
67 of 67 results displayed
- Coming Soon
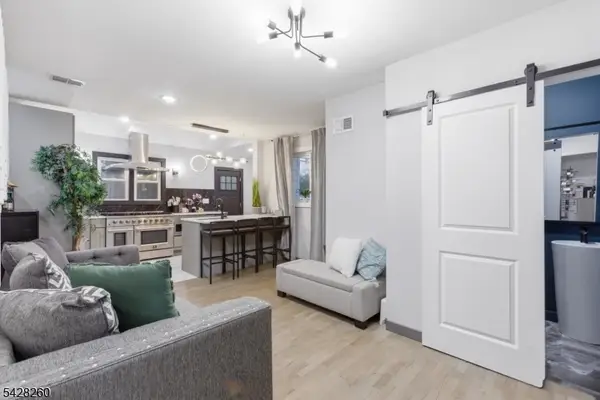 $799,999Coming Soon5 beds 5 baths
600 Belleville Ave, Belleville Twp., NJ 07109
MLS# 4025889Listed by: CONLEY REALTY - New
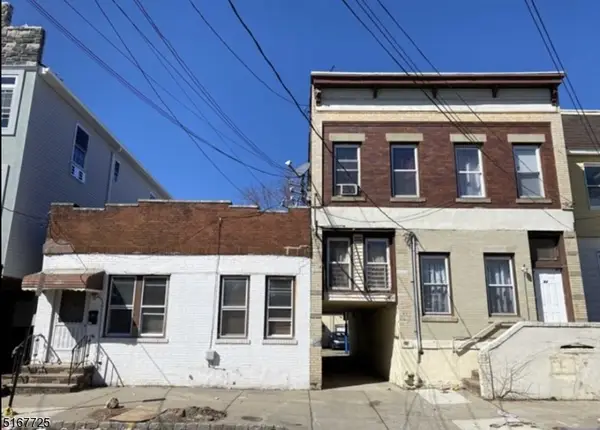 $299,888Active2 beds 1 baths
39 Heckel St, Belleville Twp., NJ 07109
MLS# 4025783Listed by: KELLER WILLIAMS PARK VIEWS - Open Sat, 1 to 3pmNew
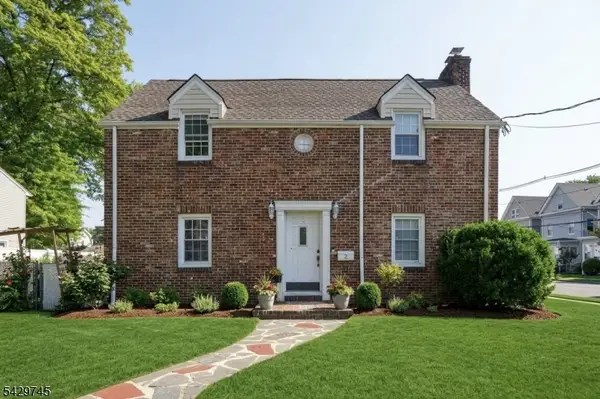 $639,000Active5 beds 2 baths
2 Lloyd Pl, Belleville Twp., NJ 07109
MLS# 4025505Listed by: KELLER WILLIAMS CITY VIEWS REALTY - Coming SoonOpen Sat, 12 to 2pm
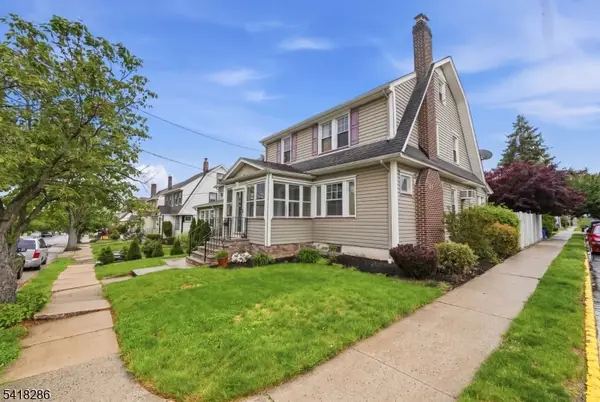 $569,000Coming Soon4 beds 2 baths
219 Overlook Ave, Belleville Twp., NJ 07109
MLS# 4025371Listed by: MONACO REALTY LLC - New
 $349,900Active1 beds 1 baths
78 Beech St, Belleville Twp., NJ 07109
MLS# 4025460Listed by: KELLER WILLIAMS PARK VIEWS - Coming SoonOpen Sat, 1 to 4pm
 $499,000Coming Soon3 beds 1 baths
20 S Wilber St, Belleville Twp., NJ 07109
MLS# 4025175Listed by: EXP REALTY, LLC - Open Sat, 1 to 4pmNew
 $499,000Active3 beds 1 baths
18-20 Wilber Street, Belleville, NJ 07109
MLS# 26015932Listed by: EXP REALTY, LLC
- New
 $615,000Active3 beds 2 baths
153 Smallwood Ave, Belleville Twp., NJ 07109
MLS# 4024639Listed by: CORCORAN SAWYER SMITH - New
 $449,000Active2 beds 2 baths
163 Valley St, Belleville Twp., NJ 07109
MLS# 4024530Listed by: RE/MAX ELITE REALTY - New
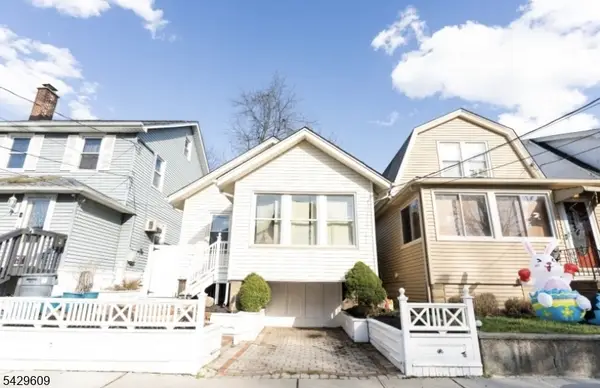
 $479,000Active3 beds 2 baths
192 New St, Belleville Twp., NJ 07109
MLS# 4023822Listed by: SIGNATURE REALTY NJ  $535,000Active3 beds 2 baths1,600 sq. ft.
16 Morse Pl, Belleville Twp., NJ 07109
MLS# 4023166Listed by: RE/MAX PROFESSIONALS I $425,000Active2 beds 1 baths962 sq. ft.
52 Nolton Street, Belleville, NJ 07109
MLS# 22611035Listed by: KELLER WILLIAMS REALTY OCEAN LIVING $629,000Active3 beds 3 baths
265 Union Avenue, Belleville, NJ 07109
MLS# 26013670Listed by: REALTY EXECUTIVES ELITE HOMES $525,000Pending3 beds 2 baths
126 Garden Ave, Belleville Twp., NJ 07109
MLS# 4021829Listed by: VOX REALTY $449,900Pending4 beds 2 baths
270 Dewitt Ave, Belleville Twp., NJ 07109
MLS# 4021876Listed by: NJ HOMES REALTY $559,900Pending3 beds 2 baths
71 May St, Belleville Twp., NJ 07109
MLS# 4021900Listed by: PREMIER AGENT NETWORK $509,000Active2 beds 1 baths
41 Watsessing Avenue, Belleville, NJ 07109
MLS# 26008198Listed by: BRIGHT HOMES REALTY LLC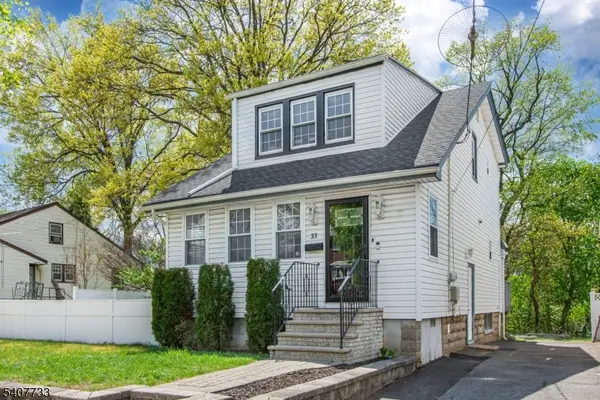 $579,000Pending3 beds 3 baths
31-33 Smallwood Ave, Belleville Twp., NJ 07109
MLS# 4021565Listed by: KELLER WILLIAMS - NJ METRO GROUP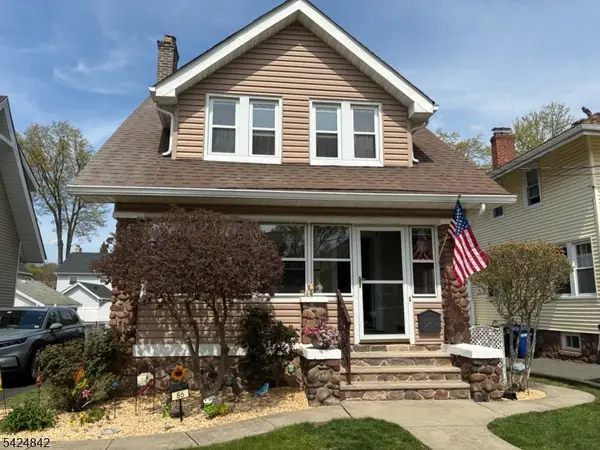 $529,000Pending3 beds 2 baths
86 Van Houten Pl, Belleville Twp., NJ 07109
MLS# 4021212Listed by: MOSCARA REALTY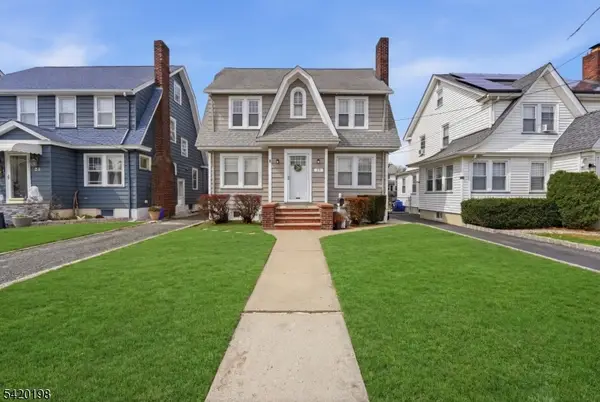 $580,000Active4 beds 2 baths
27 Reservoir Pl, Belleville Twp., NJ 07109
MLS# 4020826Listed by: MONACO REALTY LLC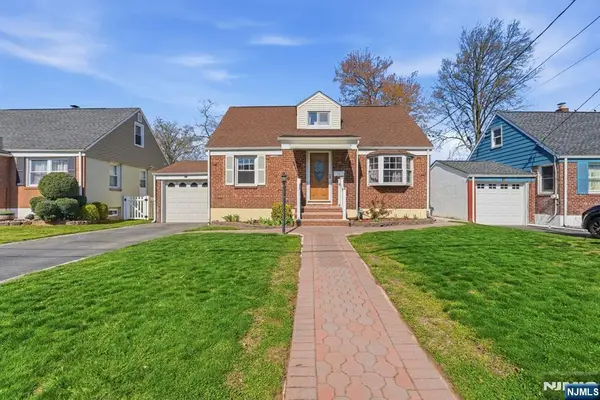 $544,999Pending2 beds 2 baths
201 Floyd Street, Belleville, NJ 07109
MLS# 26012516Listed by: 3SIXTY REALTY $509,900Pending3 beds 2 baths1,457 sq. ft.
12 Overhill Rd, Belleville Twp., NJ 07109
MLS# 4020208Listed by: KELLER WILLIAMS OCEAN LIVING $599,000Active3 beds 2 baths
100 Tiona Ave, Belleville Twp., NJ 07109
MLS# 4020127Listed by: MYD REALTY LLC $450,000Pending5 beds 2 baths
200 William St, Belleville Twp., NJ 07109
MLS# 4020082Listed by: STEWART REALTY GROUP $599,900Pending4 beds 2 baths
1 Charles St, Belleville Twp., NJ 07109
MLS# 4019567Listed by: RE/MAX FIRST REALTY II $599,900Active3 beds 2 baths1,324 sq. ft.
-2 Rutan Road, Belleville, NJ 07109
MLS# 2612929RListed by: RE/MAX 1ST ADVANTAGE $659,999Pending3 beds 2 baths2,500 sq. ft.
61 Bremond St, Belleville Twp., NJ 07109
MLS# 4017664Listed by: YOUR TOWN REALTY $795,000Active4 beds 4 baths
38 Center St, Belleville Twp., NJ 07109
MLS# 4017063Listed by: PRESTIGE PROPERTY GROUP MONTCLAIR $509,000Pending3 beds 2 baths
24 Carolyn Rd, Belleville Twp., NJ 07109
MLS# 4016714Listed by: WEICHERT REALTORS $525,000Pending3 beds 2 baths
22 Cottage St, Belleville Twp., NJ 07109
MLS# 4016586Listed by: EXP REALTY, LLC $575,000Active3 beds 2 baths
88 Columbus Ave, Belleville Twp., NJ 07109
MLS# 4016233Listed by: NEW DIRECTION REALTY $459,900Pending3 beds 1 baths
61-63 Hill St, Belleville Twp., NJ 07109
MLS# 4015755Listed by: RE/MAX PROFESSIONALS I $400,000Active3 beds 1 baths
145 Beech Street, Belleville, NJ 07109
MLS# 26009154Listed by: VRI HOMES $535,000Pending2 beds 2 baths
10 Ogden Road, Belleville, NJ 07109
MLS# 26008735Listed by: WEICHERT REALTORS, MONTCLAIR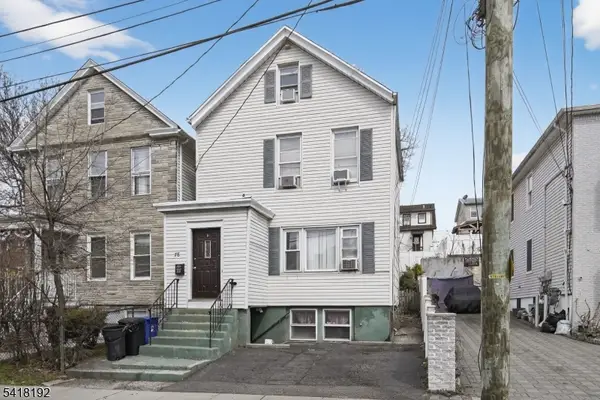 $499,000Active3 beds 2 baths
78 Cleveland St, Belleville Twp., NJ 07109
MLS# 4015364Listed by: WEICHERT REALTORS $439,000Active3 beds 2 baths
21 Moore Pl #1, Belleville Twp., NJ 07109
MLS# 4014878Listed by: COLDWELL BANKER REALTY $649,000Active3 beds 3 baths
3 Terrace Pl, Belleville Twp., NJ 07109
MLS# 4014630Listed by: THE ARENDEL GROUP LLC $699,000Active3 beds 3 baths
31 Mertz Ave, Belleville Twp., NJ 07109
MLS# 4013398Listed by: RE/MAX FIRST REALTY II $529,999Pending3 beds 2 baths
184 Bell St, Belleville Twp., NJ 07109
MLS# 4013275Listed by: PROMINENT PROPERTIES SIR $579,900Active3 beds 2 baths
24 Hewitt Avenue, Belleville, NJ 07109
MLS# 26006361Listed by: RE/MAX FIRST REALTY II
 $579,000Pending3 beds 2 baths1,406 sq. ft.
32 Fairview Pl, Belleville Twp., NJ 07109
MLS# 4011366Listed by: CENTURY 21 PREFERRED REALTY, INC $575,000Active6 beds 2 baths
-353 Main Street, Belleville, NJ 07109
MLS# 2611284RListed by: UNITED R.E. OF NORTH JERSEY $499,999Active2 beds 2 baths
132 Heckel Street, Belleville, NJ 07109
MLS# 26005934Listed by: COLDWELL BANKER, UPPER MONTCLAIR $620,000Active1 beds 2 baths
2 Harrison Street, Belleville, NJ 07109
MLS# 26005864Listed by: EXP REALTY, LLC $435,000Active4 beds 2 baths
25 Heckel Street, Belleville, NJ 07109
MLS# 26005802Listed by: KELLER WILLIAMS CITY VIEWS REALTY $499,000Active4 beds 1 baths
180 Beech Street, Belleville, NJ 07109
MLS# 26005521Listed by: PREMIER HOMES PROS $535,000Pending3 beds 2 baths
71 Wilber St, Belleville Twp., NJ 07109
MLS# 4009852Listed by: WEICHERT REALTORS $575,000Active3 beds 2 baths
66 Garden Avenue, Belleville, NJ 07109
MLS# 26002235Listed by: REALTY OF AMERICA LLC $550,000Active3 beds 3 baths
190 Malone Ave, Belleville Twp., NJ 07109
MLS# 4005976Listed by: REALTY EXECUTIVES EXCEPTIONAL $370,000Pending2 beds 1 baths921 sq. ft.
25 Harvard Pl, Belleville Twp., NJ 07109
MLS# 4005824Listed by: REALMART REALTY $634,998Active2 beds 1 baths
128 White Oak Terrace, Belleville, NJ 07109
MLS# 26002056Listed by: WEICHERT REALTORS, CLIFTON $425,000Pending4 beds 2 baths
89 Union Ave, Belleville Twp., NJ 07109
MLS# 4005414Listed by: NENO-ROSA AGENCY $560,000Active3 beds 2 baths
62 Sycamore Drive, Belleville, NJ 07109
MLS# 25044029Listed by: BERKSHIRE HATHAWAY HOME SERVICES FOX & ROACH REALTORS - SUMMIT $769,000Pending6 beds 3 baths
234 Holmes Street, Belleville Twp., NJ 07109
MLS# 4004943Listed by: SIGNATURE REALTY NJ $839,000Pending4 beds 4 baths3,021 sq. ft.
23 Ralph St, Belleville Twp., NJ 07109
MLS# 4001679Listed by: ELITE REALTORS OF NEW JERSEY $699,000Active4 beds 2 baths
14 Dorothea Ter, Belleville Twp., NJ 07109
MLS# 3998936Listed by: EXP REALTY, LLC $590,000Active4 beds 2 baths
16 Pleasant Ave, Belleville Twp., NJ 07109
MLS# 3998539Listed by: REALTY ONE GROUP PRODIGY $449,900Pending3 beds 2 baths
212 Stephens St, Belleville Twp., NJ 07109
MLS# 3995833Listed by: WEICHERT REALTORS $525,000Pending4 beds 1 baths
111 Belmohr St, Belleville Twp., NJ 07109
MLS# 3993886Listed by: KELLER WILLIAMS - NJ METRO GROUP $565,000Pending3 beds 2 baths
143 Carpenter St, Belleville Twp., NJ 07109
MLS# 3993880Listed by: EXP REALTY, LLC $499,000Pending3 beds 2 baths
14 Smallwood Ave, Belleville Twp., NJ 07109
MLS# 3989035Listed by: RE/MAX LIFETIME REALTORS $449,999Pending2 beds 2 baths
683-685 Mill Street, Belleville, NJ 07109
MLS# 25031313Listed by: WEICHERT REALTORS, JERSEY CITY $449,999Pending2 beds 2 baths
683 Mill St, Belleville Twp., NJ 07109
MLS# 3984347Listed by: WEICHERT REALTORS $650,000Pending3 beds 2 baths
45 Rutan Rd, Belleville Twp., NJ 07109
MLS# 3974816Listed by: THE REAL ESTATE COMPANY $559,999Active3 beds 2 baths
126 Garden Avenue, Belleville, NJ 07109
MLS# 25024465Listed by: KELLER WILLIAMS TEAM REALTY $489,000Pending4 beds 2 baths
420 Dewitt Avenue, Belleville, NJ 07109
MLS# 25004253Listed by: EXP REALTY, LLC - WYCKOFF $449,500Pending3 beds 2 baths
55 Walnut Street, Belleville, NJ 07109
MLS# 23033595Listed by: WEICHERT REALTORS, CLIFTON
Local realty services provided by:CENTURY 21 Gold Properties Realty, Inc, CENTURY 21 Semiao & Associates, CENTURY 21 Mack-Morris Iris Lurie Inc, CENTURY 21 Charles Smith Agency, Inc.
The data relating to real estate for sale on this website comes in part from the IDX Program of Garden State Multiple Listing Service, L.L.C. Real estate listings held by other brokerage firms are marked as IDX Listing. Information deemed reliable but not guaranteed. 2026 Garden State Multiple Listing Service, L.L.C. All rights reserved. Notice: The dissemination of listings on this website does not constitute the consent required by N.J.A.C. 11:5.6.1 (n) for the advertisement of listings exclusively for sale by another broker. Any such consent must be obtained in writing from the listing broker. This information is being provided for Consumers' personal, non-commercial use and may not be used for any purpose other than to identify prospective properties Consumers may be interested in purchasing. Date Last Updated March 19, 2026
The data relating to the real estate for sale on this web site comes in part from the Internet Data Exchange Program of the NJMLS. Real estate listings held by brokerage firms other than CENTURY 21 Semiao & Associates are marked with the Internet Data Exchange logo and information about them includes the name of the listing brokers. Some properties listed with the participating brokers do not appear on this website at the request of the seller. Listings of brokers that do not participate in Internet Data Exchange do not appear on this website.
All information deemed reliable but not guaranteed. Last date updated: May 5, 2026. Source: New Jersey Multiple Listing Service, Inc.
2026 New Jersey Multiple Listing Service, Inc. All rights reserved.
The data relating to real estate for sale on this web-site comes in part from the Internet Listing Display database of the CENTRAL JERSEY MULTIPLE LISTING SYSTEM, INC. Real estate listings held by brokerage firms other than this site-owner are marked with the ILD logo. The CENTRAL JERSEY MULTIPLE LISTING SYSTEM, INC does not warrant the accuracy, quality, reliability, suitability, completeness, usefulness or effectiveness of any information provided. The information being provided is for consumers' personal, non-commercial use and may not be used for any purpose other than to identify properties the consumer may be interested in purchasing or renting. Copyright 2026, CENTRAL JERSEY MULTIPLE LISTING SYSTEM, INC. All rights reserved”. The CENTRAL JERSEY MULTIPLE LISTING SYSTEM, INC retains all rights, title and interest in and to its trademarks, service marks and copyrighted material.
Popular searches near 07109
Popular neighborhoods near 07109
- Allwood, Clifton homes for sale
- Central Ward, Newark homes for sale
- Delawanna, Clifton homes for sale
- Downtown Newark, Newark homes for sale
- Fairmount, Newark homes for sale
- Five Corners, Newark homes for sale
- Forest Hill, Newark homes for sale
- Knollwood, Clifton homes for sale
- Lower Roseville, Newark homes for sale
- Main Avenue, Passaic homes for sale
- Mount Pleasant/Lower Broadway, Newark homes for sale
- North Broadway, Newark homes for sale
- North Ward, Newark homes for sale
- Passaic Park, Passaic homes for sale
- Rosemawr, Clifton homes for sale
- Seventh Avenue, Newark homes for sale
- Springfield/Belmont, Newark homes for sale
- University Heights, Newark homes for sale
- Upper Roseville, Newark homes for sale
- Watchung Heights, West Orange homes for sale
Counties near Belleville, 07109
- Bergen County homes for sale
- Bronx County homes for sale
- Essex County homes for sale
- Hudson County homes for sale
- Kings County homes for sale
- Middlesex County homes for sale
- Monmouth County homes for sale
- Morris County homes for sale
- Nassau County homes for sale
- New York County homes for sale
- Orange County homes for sale
- Passaic County homes for sale
- Queens County homes for sale
- Richmond County homes for sale
- Rockland County homes for sale
- Somerset County homes for sale
- Sussex County homes for sale
- Union County homes for sale
- Warren County homes for sale
- Westchester County homes for sale
Protect your home and budget from life's surprises with an Assurant Home Warranty, backed by a partner that supports you through every step of homeownership. Explore Plans.
©2026 Century 21 Real Estate LLC. All rights reserved. CENTURY 21®, the CENTURY 21 Logo and C21® are service marks owned by Century 21 Real Estate LLC. Century 21 Real Estate LLC fully supports the principles of the Fair Housing Act and the Equal Opportunity Act. Each office is independently owned and operated. Listing information is deemed reliable but not guaranteed accurate.