- Bayonne homes for sale
- Brooklyn homes for sale
- Elmhurst homes for sale
- Glendale homes for sale
- Hoboken homes for sale
- Howard Beach homes for sale
- Jersey City homes for sale
- Long Island City homes for sale
- Long Island City homes for sale
- Maspeth homes for sale
- Middle Village homes for sale
- New York homes for sale
- Ozone Park homes for sale
- Rego Park homes for sale
- Ridgewood homes for sale
- Sunnyside homes for sale
- Union City homes for sale
- Weehawken homes for sale
- Woodhaven homes for sale
- Woodside homes for sale
11215, NY - homes for sale
14 of 14 results displayed
- New
 $1,975,000Active3 beds 2 baths1,542 sq. ft.
249 18th Street #2, Brooklyn, NY 11215
MLS# RLS20095412Listed by: DOUGLAS ELLIMAN REAL ESTATE
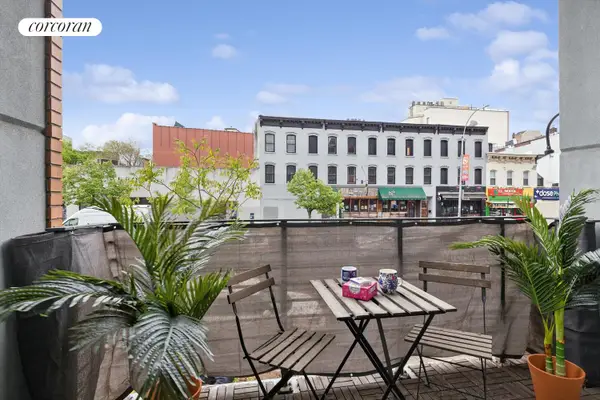
 $2,390,000Pending2 beds 3 baths1,445 sq. ft.
291 6th Avenue #1, Brooklyn, NY 11215
MLS# RLS20090747Listed by: CORCORAN GROUP $2,875,000Active2 beds 3 baths1,407 sq. ft.
6 Garfield Place #PH1201, Brooklyn, NY 11215
MLS# RLS20090759Listed by: R S N Y REALTY LLC- Open Sat, 2 to 3:30pm
 $1,895,000Active3 beds 2 baths1,285 sq. ft.
695 6th Avenue #3G, Brooklyn, NY 11215
MLS# RLS20089558Listed by: CORCORAN GROUP 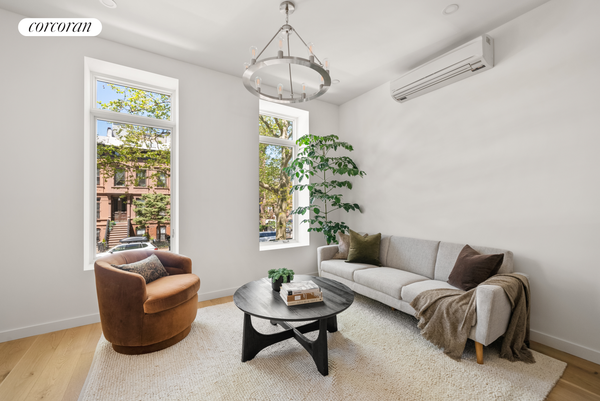 $1,490,000Pending2 beds 2 baths806 sq. ft.
291 6th Avenue #2, Brooklyn, NY 11215
MLS# RLS20088208Listed by: CORCORAN GROUP- Open Sun, 2 to 3pm
 $749,000Active1 beds 1 baths648 sq. ft.
236 17th Street #2C, Brooklyn, NY 11215
MLS# RLS20086477Listed by: CORCORAN GROUP 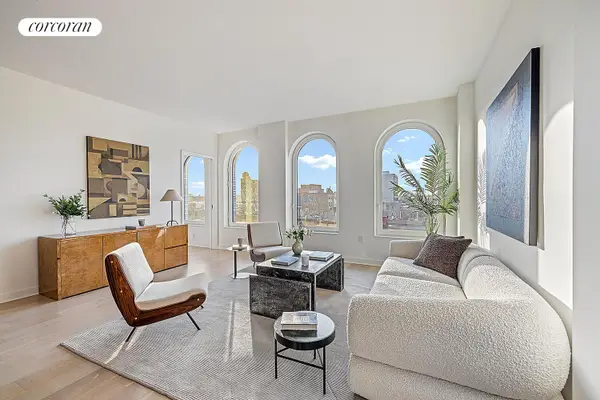 $2,795,000Pending4 beds 4 baths1,903 sq. ft.
243 4th Avenue #6A, Brooklyn, NY 11215
MLS# RLS20080083Listed by: CORCORAN GROUP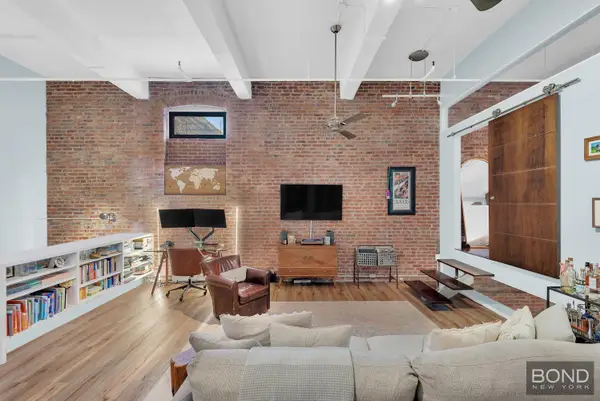 $1,895,000Pending3 beds 2 baths1,830 sq. ft.
443 12th Street #1H, Brooklyn, NY 11215
MLS# RLS20073218Listed by: BOND NEW YORK PROPERTIES LLC $1,595,000Pending3 beds 2 baths1,289 sq. ft.
575 4th Avenue #PHC, Brooklyn, NY 11215
MLS# RLS20056481Listed by: BROWN HARRIS STEVENS RESIDENTIAL SALES LLC $1,450,000Pending2 beds 2 baths803 sq. ft.
291 6th Avenue #3, Brooklyn, NY 11215
MLS# RLS20049593Listed by: CORCORAN GROUP $2,000,000Pending3 beds 3 baths2,220 sq. ft.
319 Prospect Avenue, Brooklyn, NY 11215
MLS# RLS20049016Listed by: BERKSHIRE HATHAWAY HOMESERVICES NEW YORK PROPERTIES $1,490,000Pending2 beds 2 baths806 sq. ft.
291 6th Avenue #2, Brooklyn, NY 11215
MLS# RLS20025671Listed by: CORCORAN GROUP $1,095,000Active1 beds 1 baths842 sq. ft.
575 4th Avenue #PHD, Brooklyn, NY 11215
MLS# RLS10997487Listed by: BROWN HARRIS STEVENS RESIDENTIAL SALES LLC $1,175,000Pending2 beds 1 baths860 sq. ft.
269 4th Avenue #301, Brooklyn, NY 11215
MLS# RLS10911105Listed by: BROWN HARRIS STEVENS RESIDENTIAL SALES LLC
Local realty services provided by:CENTURY 21 Awaye Realty
This information is not verified for authenticity or accuracy and is not guaranteed and may not reflect all real estate activity in the market. © 2026 The Real Estate Board of New York, Inc., All rights reserved. RLS Data display by Coldwell Banker Warburg This advertisement does not suggest that the broker has a listing in this property or properties or that any property is currently available. NY_REBNY Member Broker: Arlene Waye
Popular searches near 11215
Popular neighborhoods near 11215
- Boerum Hill, Brooklyn homes for sale
- Carroll Gardens, Brooklyn homes for sale
- Central Brooklyn, Brooklyn homes for sale
- Cobble Hill, Brooklyn homes for sale
- Ditmas Park, Brooklyn homes for sale
- Flatbush, Brooklyn homes for sale
- Fort Greene, Brooklyn homes for sale
- Gowanus, Brooklyn homes for sale
- Greenwood Heights, Brooklyn homes for sale
- Kensington, Brooklyn homes for sale
- Northwestern Brooklyn, Brooklyn homes for sale
- Park Slope, Brooklyn homes for sale
- Prospect Heights, Brooklyn homes for sale
- Prospect Lefferts Gardens, Brooklyn homes for sale
- Prospect Park South, Brooklyn homes for sale
- Red Hook, Brooklyn homes for sale
- South Brooklyn, Brooklyn homes for sale
- South Slope, Brooklyn homes for sale
- Sunset Park, Brooklyn homes for sale
- Windsor Terrace, Brooklyn homes for sale
Counties near Brooklyn, 11215
- Bergen County homes for sale
- Bronx County homes for sale
- Essex County homes for sale
- Hudson County homes for sale
- Hunterdon County homes for sale
- Kings County homes for sale
- Mercer County homes for sale
- Middlesex County homes for sale
- Monmouth County homes for sale
- Morris County homes for sale
- Nassau County homes for sale
- New York County homes for sale
- Passaic County homes for sale
- Queens County homes for sale
- Richmond County homes for sale
- Rockland County homes for sale
- Somerset County homes for sale
- Sussex County homes for sale
- Union County homes for sale
- Westchester County homes for sale
Protect your home and budget from life's surprises with an Assurant Home Warranty, backed by a partner that supports you through every step of homeownership. Explore Plans.
©2026 Century 21 Real Estate LLC. All rights reserved. CENTURY 21®, the CENTURY 21 Logo and C21® are service marks owned by Century 21 Real Estate LLC. Century 21 Real Estate LLC fully supports the principles of the Fair Housing Act and the Equal Opportunity Act. Each office is independently owned and operated. Listing information is deemed reliable but not guaranteed accurate.