- Ardmore homes for sale
- Bala Cynwyd homes for sale
- Broomall homes for sale
- Bryn Mawr homes for sale
- Bryn Mawr homes for sale
- Drexel Hill homes for sale
- Gladwyne homes for sale
- Haverford homes for sale
- Havertown homes for sale
- Lower Merion Township homes for sale
- Merion Station homes for sale
- Narberth homes for sale
- Penn Valley homes for sale
- Penn Wynne homes for sale
- Radnor Township homes for sale
- Rosemont homes for sale
- Upper Darby homes for sale
- Villanova homes for sale
- Villanova homes for sale
- Wynnewood homes for sale
19003, PA - homes for sale
32 of 32 results displayed
- Coming Soon
 $615,000Coming Soon5 beds 3 baths
32 W Montgomery Ave, ARDMORE, PA 19003
MLS# PAMC2182176Listed by: BHHS FOX & ROACH-ROSEMONT - New
 $665,000Active4 beds 3 baths3,525 sq. ft.
39 Haverford Rd, ARDMORE, PA 19003
MLS# PADE2116506Listed by: LONG & FOSTER REAL ESTATE, INC.  $875,000Pending4 beds 3 baths2,188 sq. ft.
11 E Spring Ave, ARDMORE, PA 19003
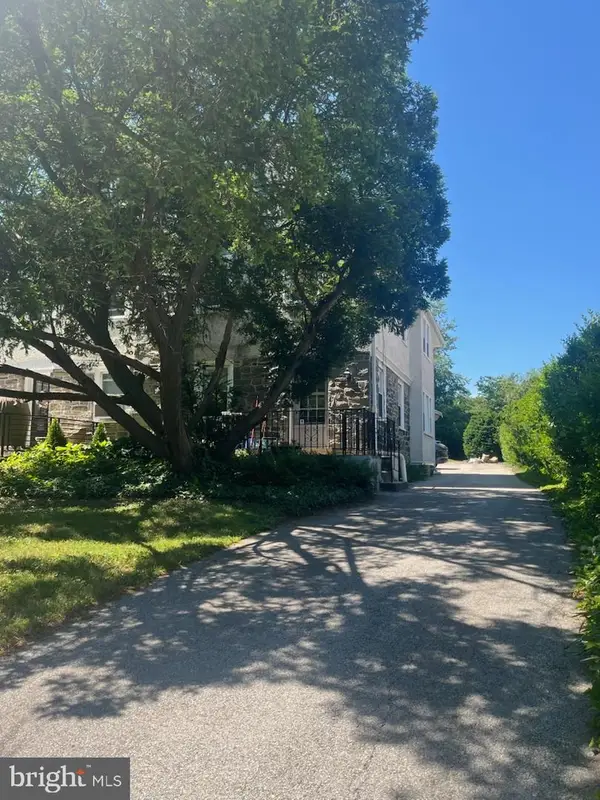
MLS# PAMC2180306Listed by: LONG & FOSTER REAL ESTATE, INC.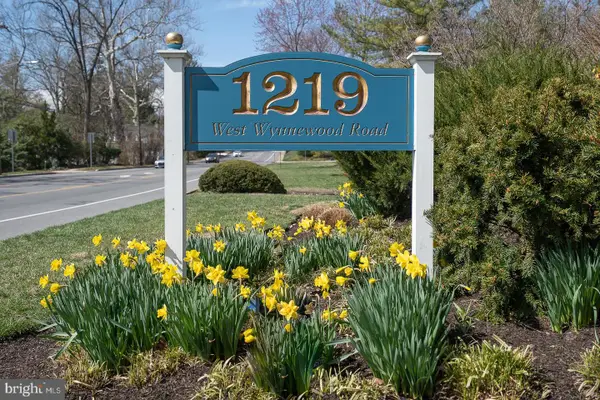 $285,000Active1 beds 2 baths1,046 sq. ft.
1219 W Wynnewood Rd #208, WYNNEWOOD, PA 19096
MLS# PAMC2177958Listed by: BHHS FOX & ROACH-HAVERFORD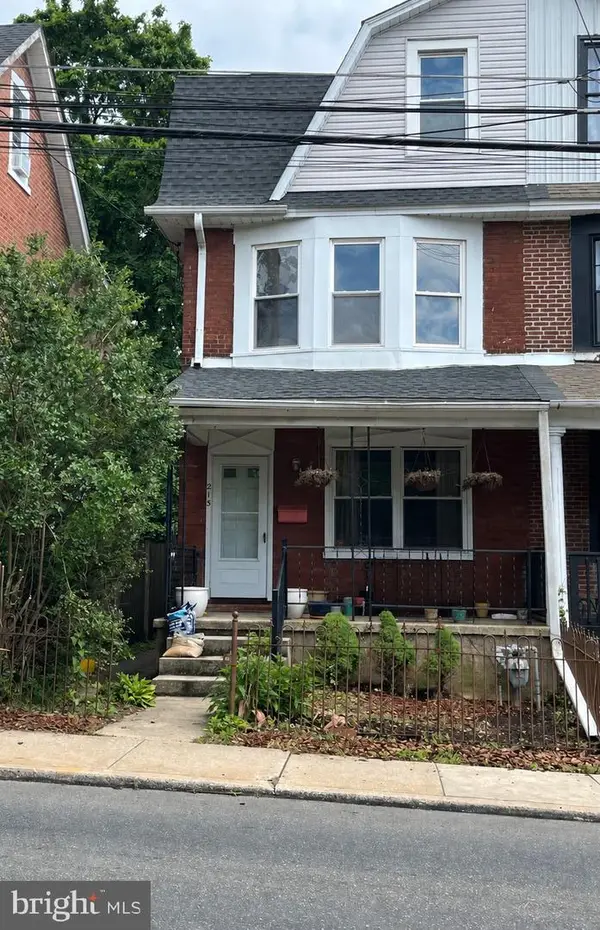 $550,000Active4 beds 3 baths1,930 sq. ft.
213 Ardmore Ave, ARDMORE, PA 19003
MLS# PAMC2180998Listed by: HOMESMART REALTY ADVISORS $450,000Pending5 beds 2 baths1,622 sq. ft.
827 Aubrey Ave, ARDMORE, PA 19003
MLS# PADE2114444Listed by: REAL OF PENNSYLVANIA $780,000Active3 beds 3 baths2,440 sq. ft.
211 Holland Ave, ARDMORE, PA 19003
MLS# PAMC2176508Listed by: HOUWZER, LLC $685,000Pending3 beds 3 baths1,985 sq. ft.
2408 Olcott Ave, ARDMORE, PA 19003
MLS# PADE2115196Listed by: COMPASS PENNSYLVANIA, LLC $600,000Active4 beds 3 baths1,800 sq. ft.
316 Locust Ave, ARDMORE, PA 19003
MLS# PAMC2179320Listed by: SPRINGER REALTY GROUP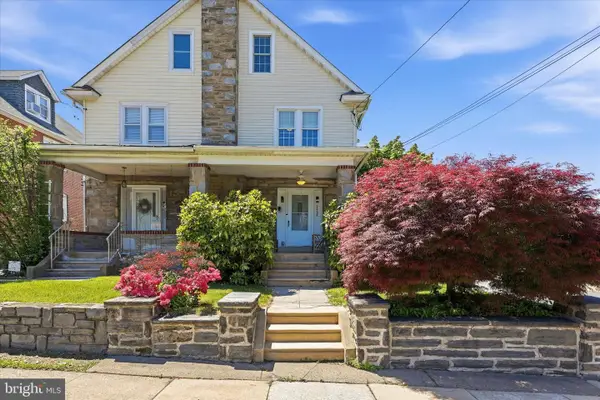 $475,000Pending3 beds 3 baths2,088 sq. ft.
2438 E County Line Rd, ARDMORE, PA 19003
MLS# PADE2114614Listed by: KELLER WILLIAMS REAL ESTATE-BLUE BELL $439,900Pending3 beds 2 baths1,256 sq. ft.
746 Oak View Rd, ARDMORE, PA 19003
MLS# PADE2114884Listed by: KELLER WILLIAMS MAIN LINE $549,000Pending3 beds 1 baths1,332 sq. ft.
21 Chatham Rd, ARDMORE, PA 19003
MLS# PAMC2178954Listed by: KELLER WILLIAMS MAIN LINE $620,000Pending3 beds 2 baths1,834 sq. ft.
154 Grandview Rd, ARDMORE, PA 19003
MLS# PAMC2178422Listed by: COMPASS PENNSYLVANIA, LLC $399,900Pending2 beds 3 baths1,376 sq. ft.
104 Woodside Rd #a-102, HAVERFORD, PA 19041
MLS# PAMC2178644Listed by: COMPASS PENNSYLVANIA, LLC $429,900Pending3 beds 2 baths1,292 sq. ft.
2316 Kenilworth Rd, ARDMORE, PA 19003
MLS# PADE2114616Listed by: BHHS FOX & ROACH-BLUE BELL $375,000Pending2 beds 3 baths1,157 sq. ft.
700 Ardmore Ave #510, ARDMORE, PA 19003
MLS# PADE2114396Listed by: COMPASS PENNSYLVANIA, LLC $539,000Active5 beds 2 baths1,930 sq. ft.
221 Ardmore Ave, ARDMORE, PA 19003
MLS# PAMC2178146Listed by: KELLER WILLIAMS REALTY DEVON-WAYNE $525,000Pending4 beds 2 baths2,302 sq. ft.
618 Georges Ln, ARDMORE, PA 19003
MLS# PADE2111848Listed by: KELLER WILLIAMS MAIN LINE $1,250,000Pending5 beds 5 baths3,279 sq. ft.
186 Lakeside Rd, ARDMORE, PA 19003
MLS# PAMC2171404Listed by: BHHS FOX & ROACH-ROSEMONT $1,650,000Active3 beds 5 baths2,711 sq. ft.
219 E Montgomery Ave #6, ARDMORE, PA 19003
MLS# PAMC2171614Listed by: COMPASS PENNSYLVANIA, LLC $439,900Pending4 beds 2 baths1,845 sq. ft.
2941 Morris Rd, ARDMORE, PA 19003
MLS# PADE2112962Listed by: KELLER WILLIAMS MAIN LINE $610,000Pending4 beds 3 baths1,750 sq. ft.
2508 Chestnut Ave, ARDMORE, PA 19003
MLS# PADE2113152Listed by: KELLER WILLIAMS MAIN LINE $389,900Pending3 beds 1 baths1,152 sq. ft.
2720 Saint Marys Rd, ARDMORE, PA 19003
MLS# PADE2112086Listed by: KELLER WILLIAMS MAIN LINE $425,000Pending3 beds 2 baths1,400 sq. ft.
103 W Montgomery Ave #2-e, ARDMORE, PA 19003
MLS# PAMC2170774Listed by: CRESCENT REAL ESTATE $539,500Active5 beds 2 baths1,547 sq. ft.
801 Ardmore Ave, ARDMORE, PA 19003
MLS# PADE2111158Listed by: WEICHERT, REALTORS - CORNERSTONE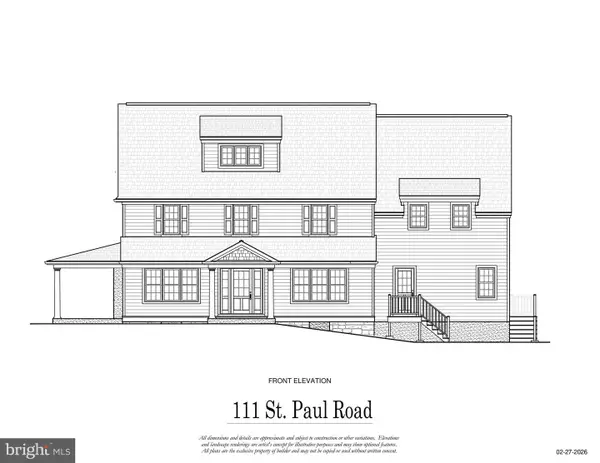 $1,950,000Active5 beds 5 baths4,080 sq. ft.
111 St Pauls Rd, ARDMORE, PA 19003
MLS# PAMC2171410Listed by: DUFFY REAL ESTATE-NARBERTH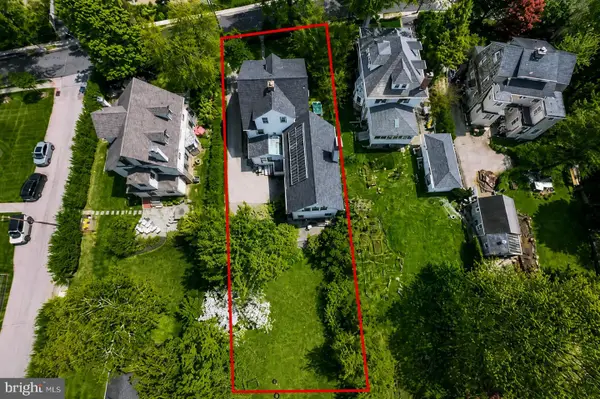 $1,700,000Pending7 beds 5 baths4,700 sq. ft.
114 Llanfair Rd, ARDMORE, PA 19003
MLS# PAMC2174926Listed by: BHHS FOX & ROACH-CENTER CITY WALNUT $1,375,000Pending6 beds 5 baths4,259 sq. ft.
210 Kent Rd, ARDMORE, PA 19003
MLS# PAMC2170652Listed by: BHHS FOX & ROACH-ROSEMONT $725,000Pending3 beds 4 baths2,126 sq. ft.
201 Cobblestone Dr, ARDMORE, PA 19003
MLS# PAMC2170540Listed by: COMPASS PENNSYLVANIA, LLC $1,275,000Pending6 beds 4 baths3,100 sq. ft.
214 Kent Rd, ARDMORE, PA 19003
MLS# PAMC2166280Listed by: BHHS FOX & ROACH-ROSEMONT $455,000Active3 beds 1 baths1,156 sq. ft.
754 Oak View Rd, ARDMORE, PA 19003
MLS# PADE2103744Listed by: SPACE & COMPANY $590,000Active1 beds -- baths1,990 sq. ft.
818 Clifford Ave, ARDMORE, PA 19003
MLS# PADE2103872Listed by: SPACE & COMPANY
Local realty services provided by:CENTURY 21 Downtown
Popular searches near 19003
Popular neighborhoods near 19003
- Ardmore, Ardmore homes for sale
- Bala Cynwyd, Bala Cynwyd homes for sale
- Bryn Mawr, Bryn Mawr homes for sale
- Carroll Park, Philadelphia homes for sale
- Cathedral Park, Philadelphia homes for sale
- Dearnley Park, Philadelphia homes for sale
- East Lansdowne, East Lansdowne homes for sale
- Gladwyne, Gladwyne homes for sale
- Haddington, Philadelphia homes for sale
- Haverford, Haverford homes for sale
- Manayunk, Philadelphia homes for sale
- Merion Station, Merion Station homes for sale
- Narberth, Narberth homes for sale
- Overbrook, Philadelphia homes for sale
- Penn Wynne, Wynnewood homes for sale
- Villanova, Villanova homes for sale
- West Philadelphia, Philadelphia homes for sale
- Wynnefield, Philadelphia homes for sale
- Wynnefield Heights, Philadelphia homes for sale
- Wynnewood, Wynnewood homes for sale
Counties near Ardmore, 19003
- Atlantic County homes for sale
- Berks County homes for sale
- Bucks County homes for sale
- Burlington County homes for sale
- Camden County homes for sale
- Cecil County homes for sale
- Chester County homes for sale
- Cumberland County homes for sale
- Delaware County homes for sale
- Gloucester County homes for sale
- Hunterdon County homes for sale
- Lancaster County homes for sale
- Lehigh County homes for sale
- Mercer County homes for sale
- Montgomery County homes for sale
- New Castle County homes for sale
- Northampton County homes for sale
- Philadelphia County homes for sale
- Salem County homes for sale
- Somerset County homes for sale
Protect your home and budget from life's surprises with an Assurant Home Warranty, backed by a partner that supports you through every step of homeownership. Explore Plans.
©2026 Century 21 Real Estate LLC. All rights reserved. CENTURY 21®, the CENTURY 21 Logo and C21® are service marks owned by Century 21 Real Estate LLC. Century 21 Real Estate LLC fully supports the principles of the Fair Housing Act and the Equal Opportunity Act. Each office is independently owned and operated. Listing information is deemed reliable but not guaranteed accurate.