- Abington homes for sale
- Bryn Athyn homes for sale
- Cheltenham homes for sale
- Cheltenham Village homes for sale
- Eddington homes for sale
- Elkins Park homes for sale
- Feasterville homes for sale
- Feasterville Trevose homes for sale
- Huntingdon Valley homes for sale
- Jenkintown homes for sale
- Lower Moreland homes for sale
- Lower Southampton homes for sale
- McKinley homes for sale
- Melrose Park homes for sale
- Oak Lane homes for sale
- Rockledge homes for sale
- Rydal homes for sale
- Trevose homes for sale
- Willow Grove homes for sale
- Wyncote homes for sale
19115, PA - homes for sale
88 of 88 results displayed
- Coming Soon
 $364,999Coming Soon3 beds 3 baths
1942 Nester St, PHILADELPHIA, PA 19115
MLS# PAPH2631804Listed by: EXP REALTY, LLC - New
 $449,900Active3 beds 3 baths1,600 sq. ft.
615 Artwood Dr, PHILADELPHIA, PA 19115
MLS# PAPH2631264Listed by: KELLER WILLIAMS REAL ESTATE TRI-COUNTY - New
 $389,000Active3 beds 2 baths1,201 sq. ft.
9732 Cowden St, PHILADELPHIA, PA 19115
MLS# PAPH2631280Listed by: CANAAN REALTY INVESTMENT GROUP - Open Sat, 1 to 3pmNew
 $399,900Active3 beds 2 baths1,675 sq. ft.
804 Marchman Rd, PHILADELPHIA, PA 19115
MLS# PAPH2628974Listed by: HOMELINK REALTY - Coming SoonOpen Sun, 12 to 3pm
 $419,999Coming Soon4 beds 3 baths
8906 Sylvia Ln, PHILADELPHIA, PA 19115
MLS# PAPH2630394Listed by: EMMANUEL REALTY 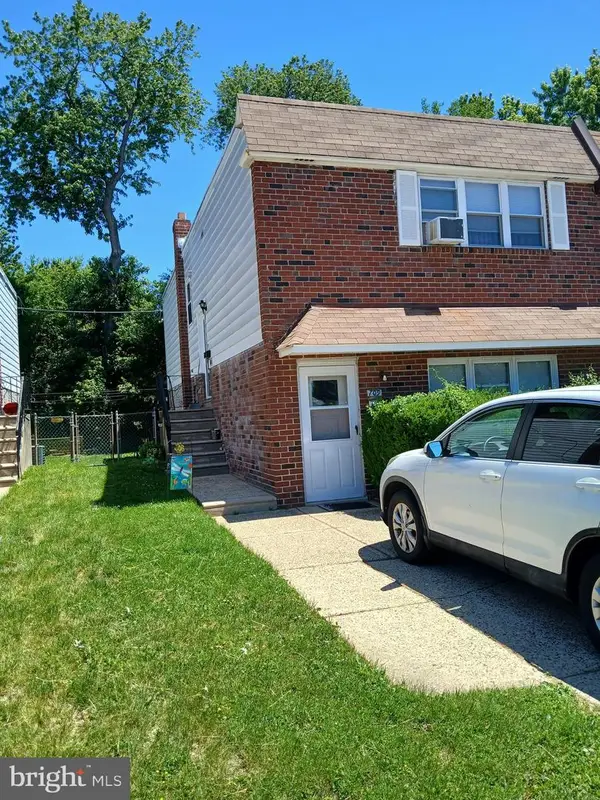 $429,000Pending4 beds -- baths1,846 sq. ft.
709 Red Lion Rd, PHILADELPHIA, PA 19115
MLS# PAPH2622970Listed by: HEYER-KEMNER INC- New
 $409,000Active4 beds 3 baths2,120 sq. ft.
840 Welsh Rd, PHILADELPHIA, PA 19115
MLS# PAPH2629522Listed by: JOSEPH F X FASY REALTORS - New
 $425,000Active3 beds 2 baths2,054 sq. ft.
2132 Grant Ave, PHILADELPHIA, PA 19115
MLS# PAPH2628888Listed by: RE/MAX 2000 - Coming Soon
 $369,000Coming Soon4 beds -- baths
9417 Hilspach St, PHILADELPHIA, PA 19115
MLS# PAPH2628290Listed by: KELLER WILLIAMS REAL ESTATE TRI-COUNTY  $825,000Active4 beds 5 baths2,784 sq. ft.
8905-00 Springview Rd, PHILADELPHIA, PA 19115
MLS# PAPH2627852Listed by: REALTY ONE GROUP SUPREME $355,000Active3 beds 2 baths1,060 sq. ft.
8849 Winchester Ave, PHILADELPHIA, PA 19115
MLS# PAPH2627426Listed by: COLDWELL BANKER HEARTHSIDE REALTORS $599,999Active6 beds 4 baths3,868 sq. ft.
9131 Bustleton Ave, PHILADELPHIA, PA 19115
MLS# PAPH2626844Listed by: REALTY MARK ASSOCIATES $434,000Active3 beds 3 baths1,080 sq. ft.
9514 Rising Sun Ave, PHILADELPHIA, PA 19115
MLS# PAPH2625784Listed by: PARAMOUNT REALTY INC $289,999Active2 beds 2 baths1,234 sq. ft.
8930-00 Krewstown Rd #310, PHILADELPHIA, PA 19115
MLS# PAPH2626390Listed by: HONEST REAL ESTATE $539,900Pending3 beds 3 baths1,978 sq. ft.
9316 Laramie Rd, PHILADELPHIA, PA 19115
MLS# PAPH2625494Listed by: FIRST HERITAGE REALTY ALLIANCE, LLC $1,249,900Active7 beds 7 baths7,200 sq. ft.
9739 Krewstown, PHILADELPHIA, PA 19115
MLS# PAPH2624590Listed by: SPACE & COMPANY $549,900Active7 beds 4 baths2,708 sq. ft.
9966 Verree Rd, PHILADELPHIA, PA 19115
MLS# PAPH2624560Listed by: KW EMPOWER- Open Sat, 12 to 3pm
 $1,249,999Active6 beds 5 baths7,200 sq. ft.
9741 Krewstown Rd, PHILADELPHIA, PA 19115
MLS# PAPH2623416Listed by: 20/20 REAL ESTATE - BENSALEM 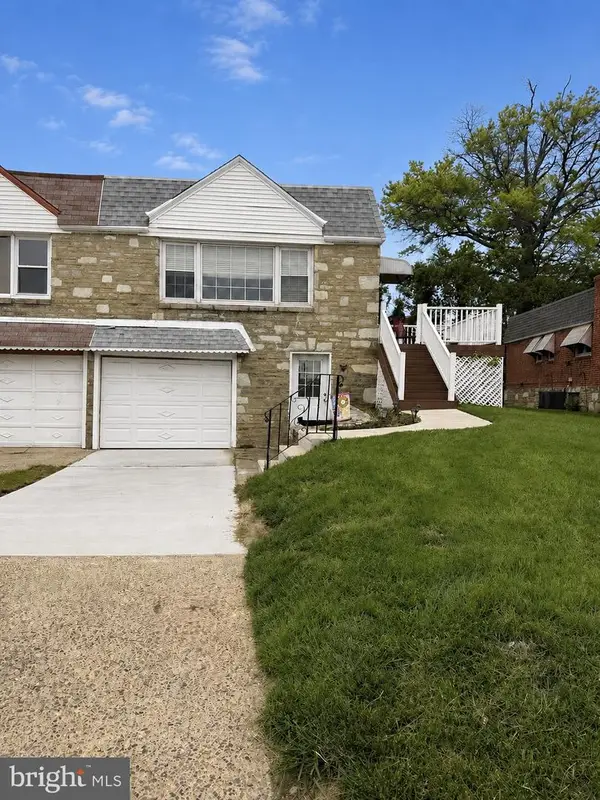 $420,000Pending3 beds 3 baths1,107 sq. ft.
9968 Woodfern Rd, PHILADELPHIA, PA 19115
MLS# PAPH2610274Listed by: KELLER WILLIAMS REAL ESTATE-LANGHORNE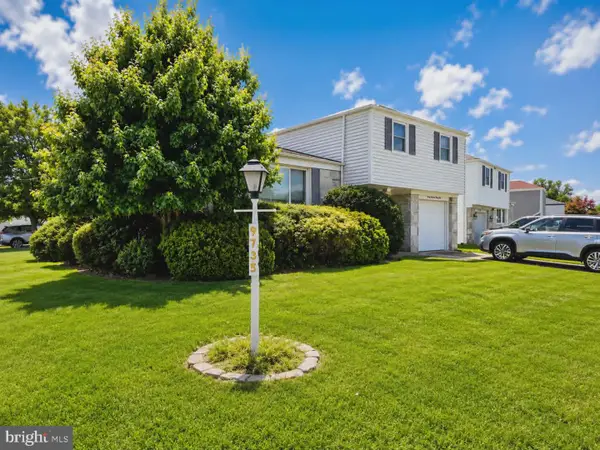 $399,900Pending3 beds 3 baths2,144 sq. ft.
9735 Glenhope Rd, PHILADELPHIA, PA 19115
MLS# PAPH2623054Listed by: KELLER WILLIAMS REAL ESTATE-MONTGOMERYVILLE $459,900Active3 beds 2 baths1,700 sq. ft.
601 Sharon Ln, PHILADELPHIA, PA 19115
MLS# PAPH2622884Listed by: EXP REALTY, LLC $430,000Pending3 beds 2 baths1,086 sq. ft.
2201 Lott St, PHILADELPHIA, PA 19115
MLS# PAPH2620736Listed by: ELITE REALTY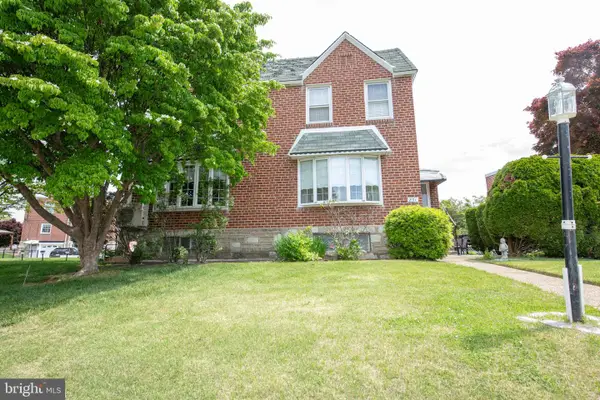 $365,000Active3 beds 2 baths1,248 sq. ft.
831 Medway Rd, PHILADELPHIA, PA 19115
MLS# PAPH2621538Listed by: KELLER WILLIAMS REAL ESTATE-LANGHORNE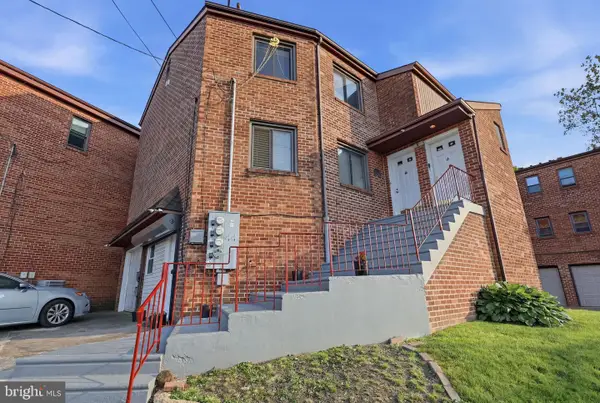 $550,000Active5 beds -- baths2,234 sq. ft.
9101 Old Newtown Rd, PHILADELPHIA, PA 19115
MLS# PAPH2621698Listed by: EQUITY PENNSYLVANIA REAL ESTATE $400,000Pending4 beds -- baths1,886 sq. ft.
1829 Beyer Ave, PHILADELPHIA, PA 19115
MLS# PAPH2619764Listed by: ELITE REALTY GROUP UNL. INC. $429,999Pending4 beds -- baths1,936 sq. ft.
1975 Beyer Ave, PHILADELPHIA, PA 19115
MLS# PAPH2621260Listed by: REALTY MARK ASSOCIATES $294,000Active2 beds 2 baths1,250 sq. ft.
2015-00 Welsh Rd #d52, PHILADELPHIA, PA 19115
MLS# PAPH2620968Listed by: SKYLINE REALTORS, LLC $185,000Active2 beds 1 baths634 sq. ft.
9921-00 Bustleton Ave #f3, PHILADELPHIA, PA 19115
MLS# PAPH2620468Listed by: KW EMPOWER $207,000Pending2 beds 1 baths834 sq. ft.
9921-00 Bustleton Ave #w4, PHILADELPHIA, PA 19115
MLS# PAPH2619734Listed by: DAN REALTY
 $419,900Pending3 beds 3 baths1,701 sq. ft.
9747 Hoff St, PHILADELPHIA, PA 19115
MLS# PAPH2619634Listed by: CENTURY 21 VETERANS-NEWTOWN $459,900Pending3 beds 2 baths1,730 sq. ft.
9965 Hardy Rd, PHILADELPHIA, PA 19115
MLS# PAPH2618062Listed by: RE/MAX 2000 $289,900Pending2 beds 1 baths867 sq. ft.
2005 Murray St, PHILADELPHIA, PA 19115
MLS# PAPH2618780Listed by: RE/MAX ONE REALTY $395,000Active4 beds 2 baths1,740 sq. ft.
1718 Kohl, PHILADELPHIA, PA 19115
MLS# PAPH2618858Listed by: KELLER WILLIAMS - MAIN STREET $449,900Pending3 beds 2 baths1,730 sq. ft.
9960 Wistaria St, PHILADELPHIA, PA 19115
MLS# PAPH2618170Listed by: RE/MAX ONE REALTY $380,000Pending3 beds 3 baths1,148 sq. ft.
9825 Clark St, PHILADELPHIA, PA 19115
MLS# PAPH2617756Listed by: RE/MAX ONE REALTY $369,990Pending3 beds 3 baths1,201 sq. ft.
1903 Morrell St, PHILADELPHIA, PA 19115
MLS# PAPH2615004Listed by: KW EMPOWER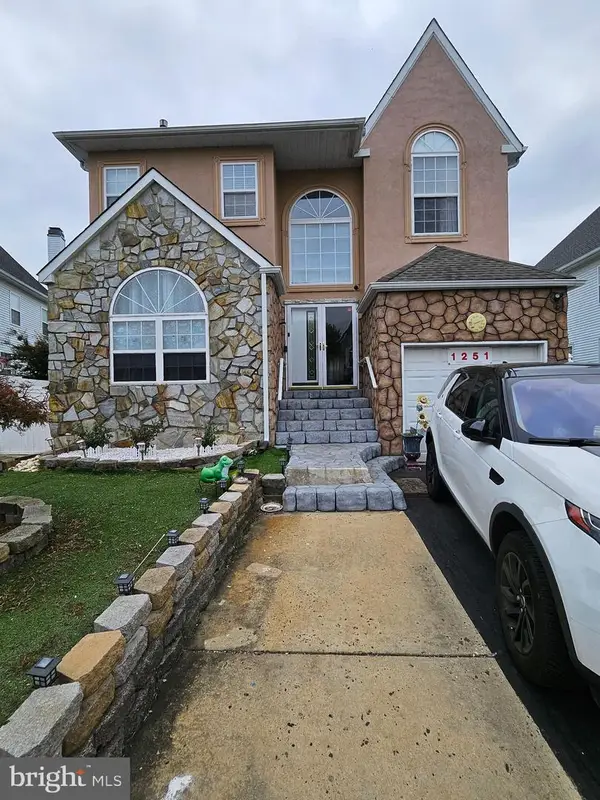 $725,000Active5 beds 4 baths3,000 sq. ft.
1251 Serota Pl, PHILADELPHIA, PA 19115
MLS# PAPH2616516Listed by: HK99 REALTY LLC $299,900Pending3 beds 2 baths1,170 sq. ft.
9930 Alicia St, PHILADELPHIA, PA 19115
MLS# PAPH2614888Listed by: KELLER WILLIAMS REAL ESTATE-LANGHORNE $349,000Pending3 beds 2 baths1,080 sq. ft.
1106 Grant Ave, PHILADELPHIA, PA 19115
MLS# PAPH2614412Listed by: REALTY MARK CITYSCAPE-HUNTINGDON VALLEY $489,900Active3 beds 3 baths2,178 sq. ft.
9967 Verree Rd, PHILADELPHIA, PA 19115
MLS# PAPH2614960Listed by: ROI NATIONAL REALTY CORP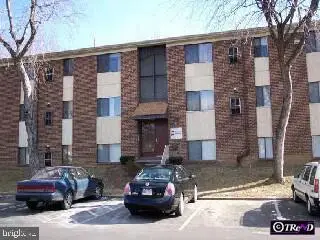 $149,944Pending1 beds 1 baths654 sq. ft.
9921 Bustleton Ave #q-4, PHILADELPHIA, PA 19115
MLS# PAPH2612796Listed by: RE/MAX ONE REALTY $380,000Pending3 beds 2 baths1,312 sq. ft.
9717 Dedaker St, PHILADELPHIA, PA 19115
MLS# PAPH2613284Listed by: GEORGE WEISS REALTY $289,900Pending2 beds 1 baths1,107 sq. ft.
9347 Neil Rd #a, PHILADELPHIA, PA 19115
MLS# PAPH2612838Listed by: RE/MAX SIGNATURE $289,900Active2 beds 2 baths1,105 sq. ft.
2089 Welsh Rd #f2, PHILADELPHIA, PA 19115
MLS# PAPH2612746Listed by: RE/MAX SELECT GROUP $325,000Pending3 beds 3 baths1,087 sq. ft.
9115 Ferndale St, PHILADELPHIA, PA 19115
MLS# PAPH2607554Listed by: HOMESTARR REALTY $336,000Pending3 beds 3 baths1,011 sq. ft.
1028 Grant Ave, PHILADELPHIA, PA 19115
MLS# PAPH2610520Listed by: REALTY MARK ASSOCIATES $347,500Pending3 beds 3 baths1,664 sq. ft.
1569-00 Stoney Ln #b, PHILADELPHIA, PA 19115
MLS# PAPH2606242Listed by: AMERICAN VISTA REAL ESTATE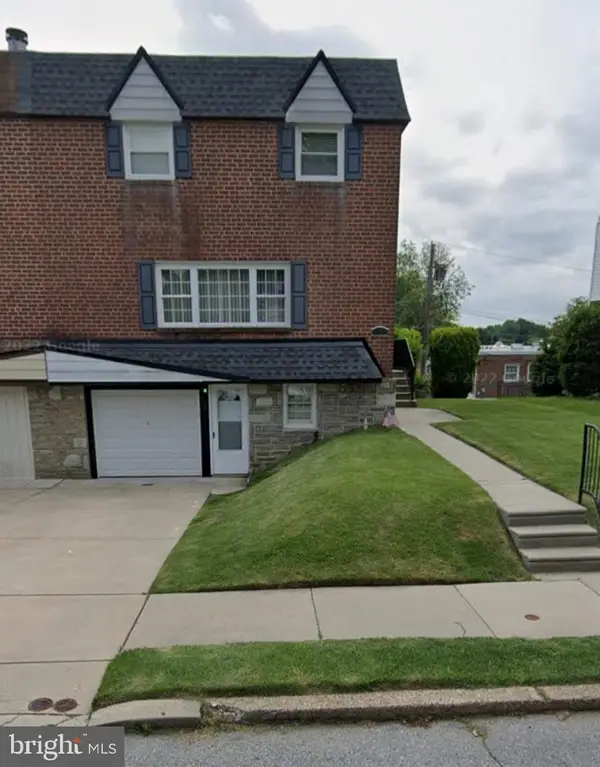 $449,900Pending4 beds 3 baths2,186 sq. ft.
630 Artwood Dr, PHILADELPHIA, PA 19115
MLS# PAPH2605658Listed by: REAL OF PENNSYLVANIA $530,000Pending3 beds 3 baths1,804 sq. ft.
1044 Bloomfield Ave, PHILADELPHIA, PA 19115
MLS# PAPH2607446Listed by: KELLER WILLIAMS REALTY GROUP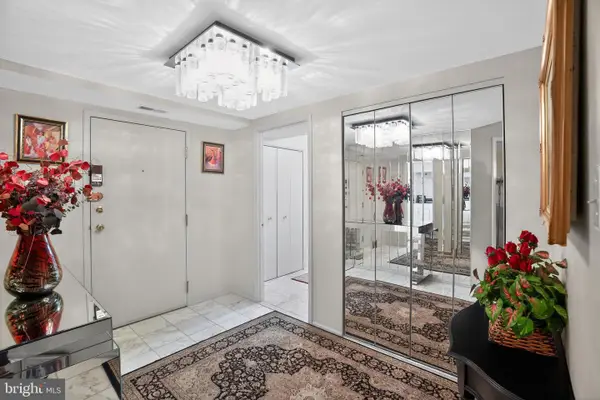 $260,000Active1 beds 2 baths1,854 sq. ft.
2131 Welsh Rd #312, PHILADELPHIA, PA 19115
MLS# PAPH2608446Listed by: COLDWELL BANKER REALTY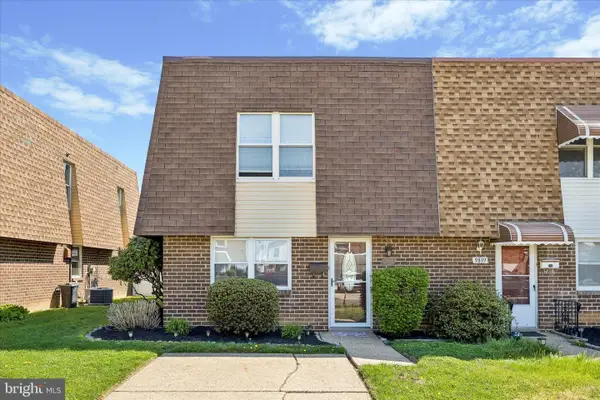 $369,900Pending3 beds 3 baths1,720 sq. ft.
9841 Cowden St, PHILADELPHIA, PA 19115
MLS# PAPH2608142Listed by: BHHS FOX & ROACH-JENKINTOWN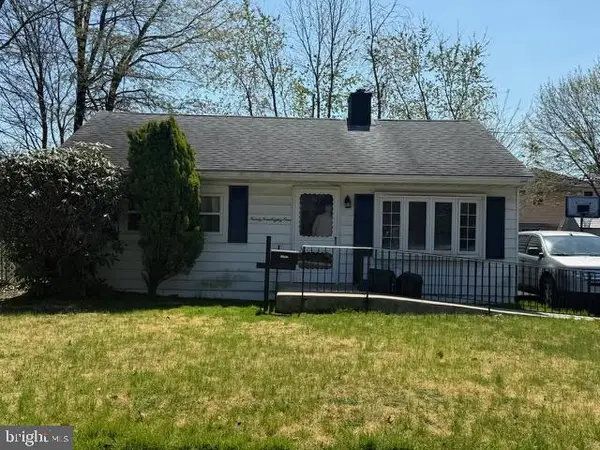 $259,900Active2 beds 1 baths768 sq. ft.
9981 Haldeman Ave, PHILADELPHIA, PA 19115
MLS# PAPH2607202Listed by: HOME SOLUTIONS REALTY GROUP $360,000Active4 beds -- baths2,000 sq. ft.
9926 Haldeman Unit#133 Ave, PHILADELPHIA, PA 19115
MLS# PAPH2543742Listed by: MARKET FORCE REALTY $457,000Pending3 beds 3 baths1,201 sq. ft.
1944 Morrell St, PHILADELPHIA, PA 19115
MLS# PAPH2605662Listed by: MARKET FORCE REALTY $329,900Pending3 beds 2 baths1,128 sq. ft.
1149 Glenn St, PHILADELPHIA, PA 19115
MLS# PAPH2605528Listed by: RE/MAX 2000 $595,000Pending3 beds 3 baths2,840 sq. ft.
1901 Murray St, PHILADELPHIA, PA 19115
MLS# PAPH2604864Listed by: HONEST REAL ESTATE $299,000Active2 beds 2 baths1,344 sq. ft.
1630-90 Welsh Rd #3a, PHILADELPHIA, PA 19115
MLS# PAPH2604576Listed by: LEGAL REAL ESTATE LLC $559,000Pending3 beds 3 baths2,400 sq. ft.
124 Delia Ln, PHILADELPHIA, PA 19115
MLS# PAPH2603770Listed by: KW EMPOWER $350,000Active4 beds -- baths2,000 sq. ft.
9926-00 Haldeman Ave, PHILADELPHIA, PA 19115
MLS# PAPH2602240Listed by: URBAN REALTY CORPORATION $570,000Active4 beds 4 baths1,890 sq. ft.
870 Morefield Rd, PHILADELPHIA, PA 19115
MLS# PAPH2599170Listed by: PHILLY REAL ESTATE $550,000Active4 beds 3 baths1,804 sq. ft.
1036 Camas Dr, PHILADELPHIA, PA 19115
MLS# PAPH2597612Listed by: COMPASS PENNSYLVANIA, LLC $429,900Active3 beds 3 baths1,804 sq. ft.
1100 Surrey Rd, PHILADELPHIA, PA 19115
MLS# PAPH2602048Listed by: EMMANUEL REALTY $360,000Pending3 beds 2 baths1,458 sq. ft.
840 Bartlett St, PHILADELPHIA, PA 19115
MLS# PAPH2601760Listed by: RE/MAX ONE REALTY $745,500Active4 beds 4 baths3,536 sq. ft.
8908 Springview Rd, PHILADELPHIA, PA 19115
MLS# PAPH2599552Listed by: BHHS FOX & ROACH-CENTER CITY WALNUT $475,000Active3 beds 3 baths2,287 sq. ft.
123 Pocasset Rd, PHILADELPHIA, PA 19115
MLS# PAPH2599074Listed by: KELLER WILLIAMS REAL ESTATE-DOYLESTOWN $365,000Pending3 beds 3 baths1,201 sq. ft.
1203 Fenwick Pl, PHILADELPHIA, PA 19115
MLS# PAPH2600544Listed by: EXP REALTY, LLC $349,900Active2 beds 3 baths1,752 sq. ft.
1630-90 Welsh Rd #40e, PHILADELPHIA, PA 19115
MLS# PAPH2599140Listed by: ELITE REALTY GROUP UNL. INC. $835,000Active5 beds 4 baths3,224 sq. ft.
38 Magnolia Pl, PHILADELPHIA, PA 19115
MLS# PAPH2597622Listed by: TCS MANAGEMENT, LLC $499,900Active3 beds 2 baths1,509 sq. ft.
1112 Kent Ln, PHILADELPHIA, PA 19115
MLS# PAPH2587766Listed by: HOMESTARR REALTY $176,000Pending1 beds 1 baths672 sq. ft.
9921-00 Bustleton Ave #y10, PHILADELPHIA, PA 19115
MLS# PAPH2594518Listed by: HI REALTY INC $409,000Pending4 beds 3 baths1,720 sq. ft.
9860 Bonner St, PHILADELPHIA, PA 19115
MLS# PAPH2593194Listed by: REALTY MARK ASSOCIATES $259,900Pending3 beds 2 baths1,046 sq. ft.
8834 Bradford St, PHILADELPHIA, PA 19115
MLS# PAPH2592350Listed by: KW EMPOWER $460,000Active3 beds 3 baths1,507 sq. ft.
601 Colebrook Rd, PHILADELPHIA, PA 19115
MLS# PAPH2592608Listed by: KELLER WILLIAMS REAL ESTATE-HORSHAM $512,900Active3 beds 2 baths1,730 sq. ft.
9947 Montour St, PHILADELPHIA, PA 19115
MLS# PAPH2589482Listed by: LEGACY LANDMARK REALTY LLC $469,900Active3 beds 3 baths2,000 sq. ft.
9200 Old Newtown Rd, PHILADELPHIA, PA 19115
MLS# PAPH2586556Listed by: MARKET FORCE REALTY $459,999Pending4 beds 4 baths1,424 sq. ft.
1152 Morefield Rd, PHILADELPHIA, PA 19115
MLS# PAPH2578104Listed by: HOME SOLUTIONS REALTY GROUP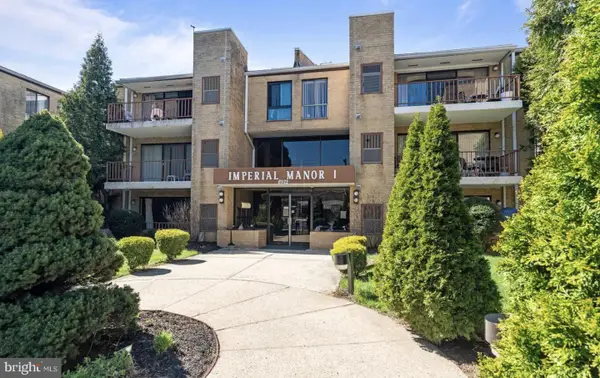 $249,900Pending2 beds 2 baths1,234 sq. ft.
8910-00 Krewstown Rd #118, PHILADELPHIA, PA 19115
MLS# PAPH2574544Listed by: OPUS ELITE REAL ESTATE $339,000Active2 beds 2 baths1,344 sq. ft.
1630-90 Welsh Rd #25d, PHILADELPHIA, PA 19115
MLS# PAPH2574564Listed by: SCOPE COMMERCIAL REAL ESTATE SERVICES, INC. $649,900Active3 beds 3 baths2,214 sq. ft.
1127 Hower Ln, PHILADELPHIA, PA 19115
MLS# PAPH2564996Listed by: MAIN LINE INVESTORS GROUP $350,000Pending3 beds 2 baths1,302 sq. ft.
1500 Creswood Rd, PHILADELPHIA, PA 19115
MLS# PAPH2560752Listed by: CENTURY 21 ADVANTAGE GOLD-SOUTHAMPTON $435,900Pending3 beds 3 baths1,600 sq. ft.
621 Artwood Dr, PHILADELPHIA, PA 19115
MLS# PAPH2556556Listed by: HOMECOIN.COM- $196,000Active0.21 Acres
9105 Bustleton Ave, PHILADELPHIA, PA 19115
MLS# PAPH2552066Listed by: HOMESMART NEXUS REALTY GROUP - BLUE BELL  $355,000Pending3 beds 3 baths1,718 sq. ft.
9336 Neil Rd #b, PHILADELPHIA, PA 19115
MLS# PAPH2546074Listed by: CENTURY 21 ADVANTAGE GOLD-CASTOR $94,500Pending0.14 Acres
9231 Grace Ln, PHILADELPHIA, PA 19115
MLS# PAPH2543110Listed by: ELITE REALTY GROUP UNL. INC. $250,000Pending2 beds 2 baths1,105 sq. ft.
2089 Welsh Rd #f1, PHILADELPHIA, PA 19115
MLS# PAPH2589888Listed by: CENTURY 21 ADVANTAGE GOLD-ELKINS PARK $175,000Pending3 beds 2 baths1,484 sq. ft.
9617 Hilspach St, PHILADELPHIA, PA 19115
MLS# PAPH2470066Listed by: KW EMPOWER- $372,500Pending3 beds 3 baths1,908 sq. ft.
8870 Alton St, PHILADELPHIA, PA 19115
MLS# PAPH2452088Listed by: DAN REAL ESTATE, INC.  $240,000Pending3 beds 2 baths1,046 sq. ft.
8816 Bradford St, PHILADELPHIA, PA 19115
MLS# PAPH2422540Listed by: AMERICAN DESTINY REAL ESTATE-PHILADELPHIA
Local realty services provided by:CENTURY 21 Harbor Realty
Popular searches near 19115
Popular neighborhoods near 19115
- Academy Gardens, Philadelphia homes for sale
- Burholme, Philadelphia homes for sale
- Bustleton, Philadelphia homes for sale
- Far Northeast Philadelphia, Philadelphia homes for sale
- Fox Chase, Philadelphia homes for sale
- Huntingdon Valley, Huntingdon Valley homes for sale
- Krewstown, Philadelphia homes for sale
- Lawndale, Philadelphia homes for sale
- Lexington Park, Philadelphia homes for sale
- Modena Park, Philadelphia homes for sale
- Morrell Park, Philadelphia homes for sale
- Near Northeast Philadelphia, Philadelphia homes for sale
- Oxford Circle, Philadelphia homes for sale
- Pennypack, Philadelphia homes for sale
- Pennypack Woods, Philadelphia homes for sale
- Rhawnhurst, Philadelphia homes for sale
- Rockledge, Jenkintown homes for sale
- Somerton, Philadelphia homes for sale
- Walton Park, Philadelphia homes for sale
- Winchester Park, Philadelphia homes for sale
Counties near Philadelphia, 19115
- Atlantic County homes for sale
- Berks County homes for sale
- Bucks County homes for sale
- Burlington County homes for sale
- Camden County homes for sale
- Chester County homes for sale
- Delaware County homes for sale
- Gloucester County homes for sale
- Hunterdon County homes for sale
- Lehigh County homes for sale
- Mercer County homes for sale
- Middlesex County homes for sale
- Monmouth County homes for sale
- Montgomery County homes for sale
- New Castle County homes for sale
- Northampton County homes for sale
- Ocean County homes for sale
- Philadelphia County homes for sale
- Salem County homes for sale
- Somerset County homes for sale
Protect your home and budget from life's surprises with an Assurant Home Warranty, backed by a partner that supports you through every step of homeownership. Explore Plans.
©2026 Century 21 Real Estate LLC. All rights reserved. CENTURY 21®, the CENTURY 21 Logo and C21® are service marks owned by Century 21 Real Estate LLC. Century 21 Real Estate LLC fully supports the principles of the Fair Housing Act and the Equal Opportunity Act. Each office is independently owned and operated. Listing information is deemed reliable but not guaranteed accurate.