- 1, Elkridge homes for sale
- Arbutus homes for sale
- Baltimore Highlands homes for sale
- Brooklyn homes for sale
- Brooklyn Park homes for sale
- Curtis Bay homes for sale
- Elkridge homes for sale
- Ferndale homes for sale
- Gambrills homes for sale
- Glen Burnie homes for sale
- Halethorpe homes for sale
- Hanover homes for sale
- Harmans homes for sale
- Lansdowne homes for sale
- Linthicum homes for sale
- Linthicum Heights homes for sale
- Millersville homes for sale
- Pasadena homes for sale
- Severn homes for sale
- Severna Park homes for sale
21061, MD - homes for sale
149 of 149 results displayed
- Coming SoonOpen Sat, 12 to 2pm
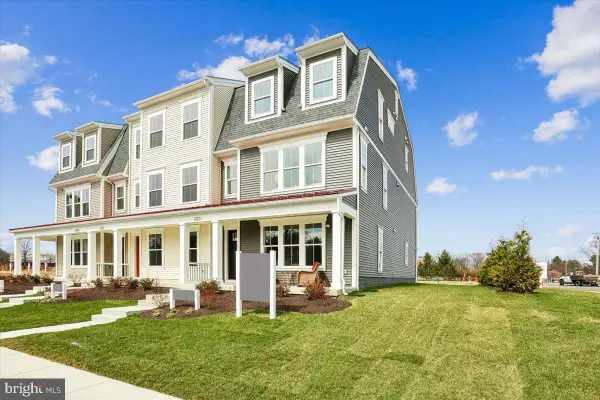
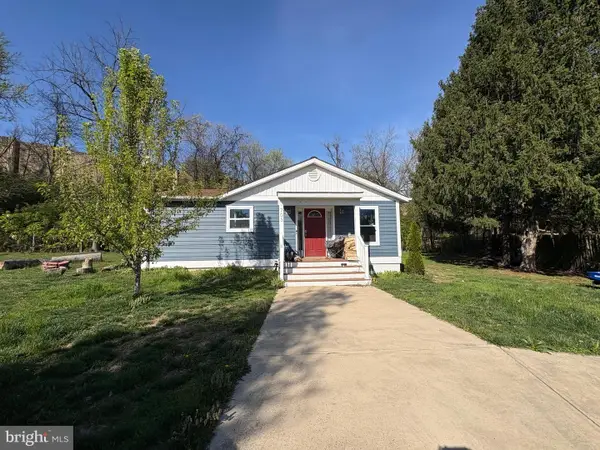
 $312,900Coming Soon2 beds 2 baths
547 Dahlgreen Rd, GLEN BURNIE, MD 21061
MLS# MDAA2143376Listed by: CUMMINGS & CO. REALTORS - Coming Soon
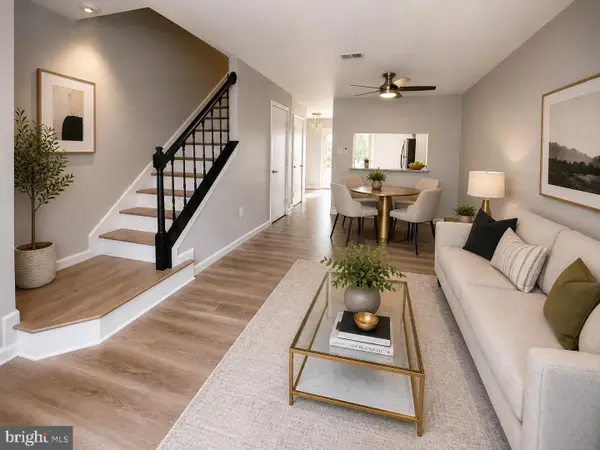
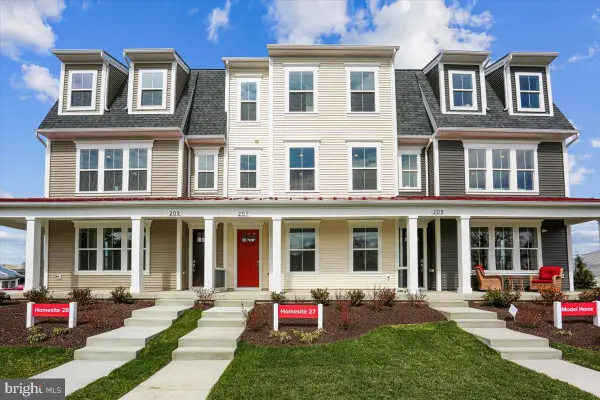
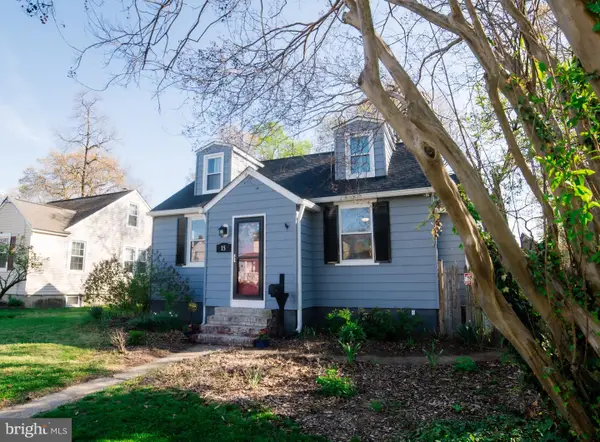
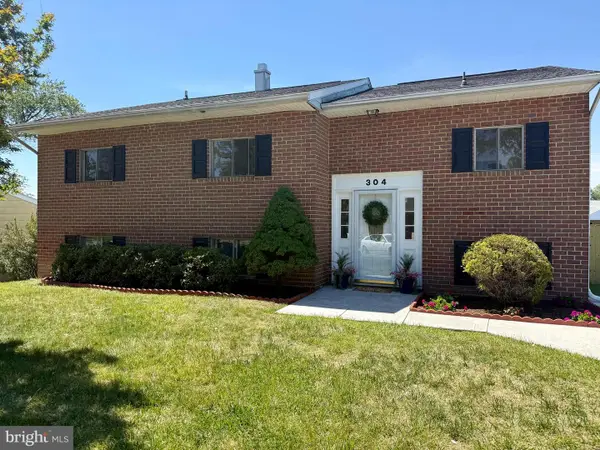 $529,000Coming Soon5 beds 3 baths
304 Lionsheart Gln, GLEN BURNIE, MD 21061
MLS# MDAA2142602Listed by: KELLER WILLIAMS LEGACY - New
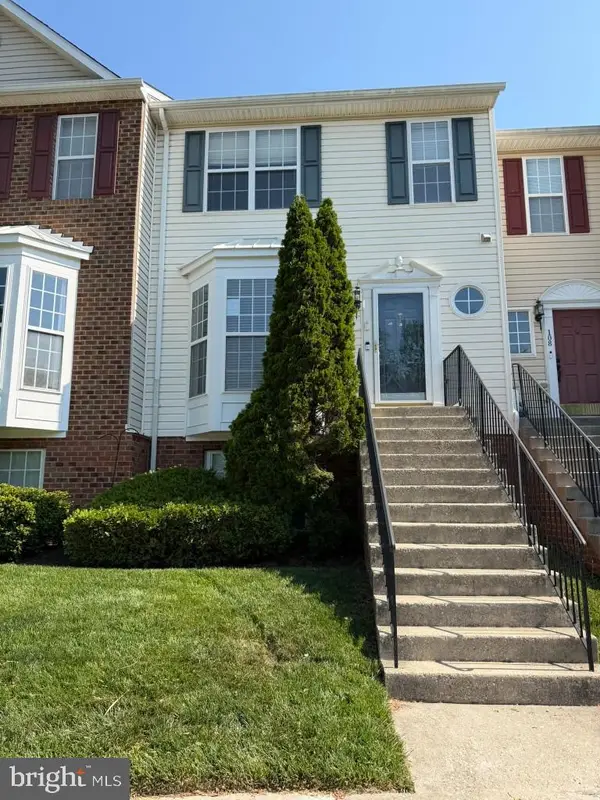 $325,000Active3 beds 3 baths1,360 sq. ft.
106 Heather Stone Way #43, GLEN BURNIE, MD 21061
MLS# MDAA2144058Listed by: NORTHROP REALTY - Coming Soon
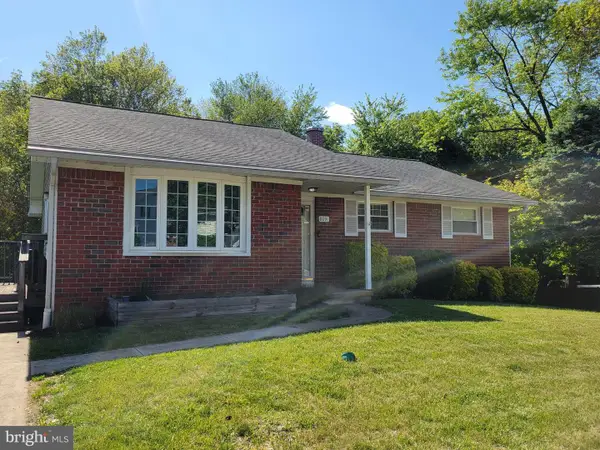 $399,900Coming Soon3 beds 3 baths
8091 Phirne Rd E, GLEN BURNIE, MD 21061
MLS# MDAA2144360Listed by: COLDWELL BANKER REALTY - New
 $635,999Active4 beds 4 baths2,379 sq. ft.
5722 Howard Dr, GLEN BURNIE, MD 21061
MLS# MDAA2144354Listed by: LPT REALTY, LLC - Coming SoonOpen Sat, 12 to 2pm
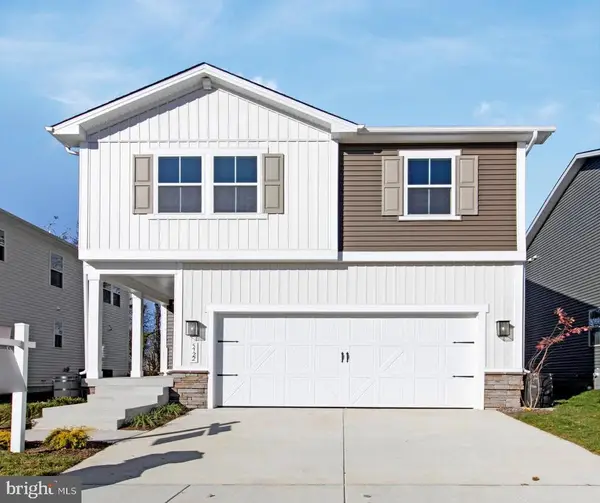
 $419,900Coming Soon3 beds 3 baths
708 Glenview Ave, GLEN BURNIE, MD 21061
MLS# MDAA2144244Listed by: COMPASS - New
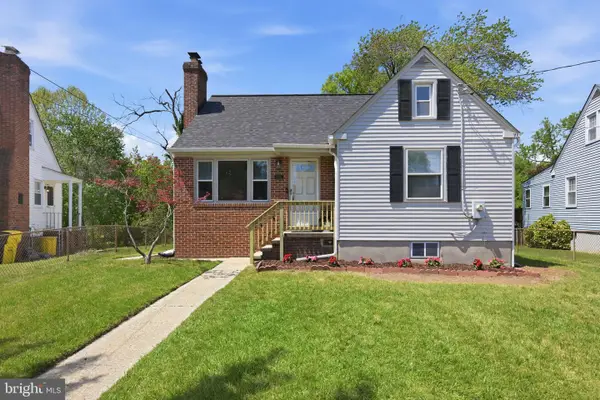
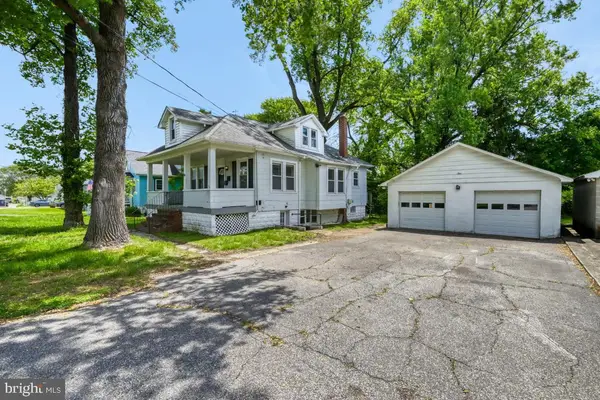
 $359,900Active3 beds 1 baths1,253 sq. ft.
1715 Saunders Way, GLEN BURNIE, MD 21061
MLS# MDAA2144024Listed by: DOUGLAS REALTY - Coming Soon
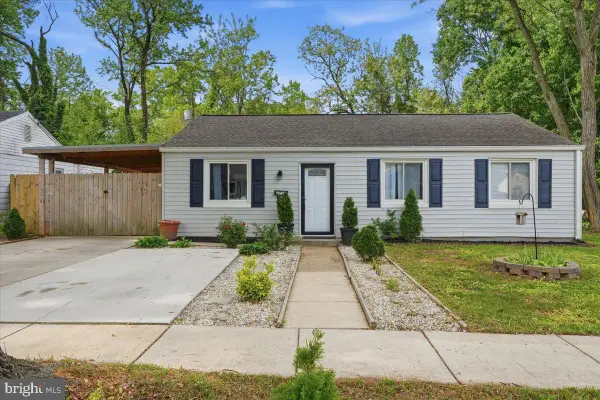
 $355,000Coming Soon3 beds 2 baths
7911 Foxbridge Dr, GLEN BURNIE, MD 21061
MLS# MDAA2144268Listed by: CUMMINGS & CO. REALTORS - Coming Soon
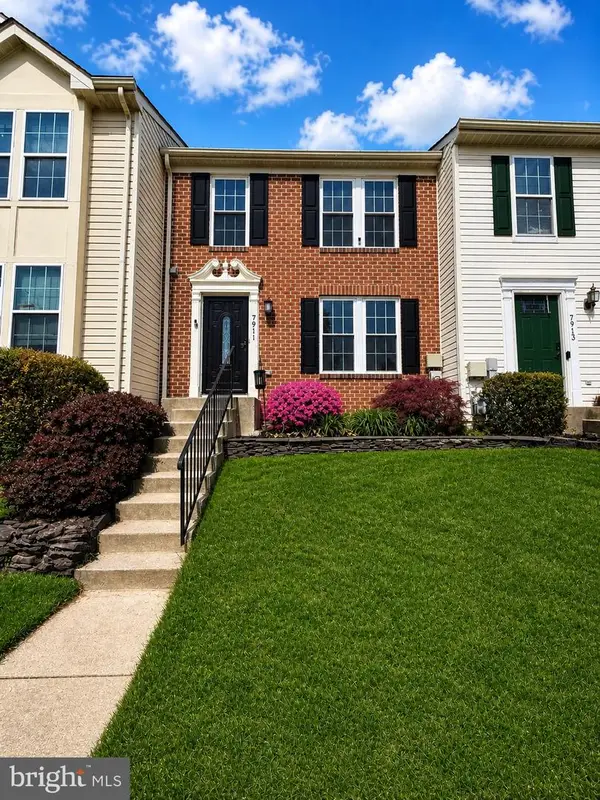
 $317,500Coming Soon3 beds 3 baths
1467 Braden Loop, GLEN BURNIE, MD 21061
MLS# MDAA2143528Listed by: KELLER WILLIAMS REALTY CENTRE - New
 $325,000Active3 beds 1 baths1,404 sq. ft.
1 Eugenia Ave, GLEN BURNIE, MD 21061
MLS# MDAA2143956Listed by: RE/MAX EXPERIENCE - Coming Soon
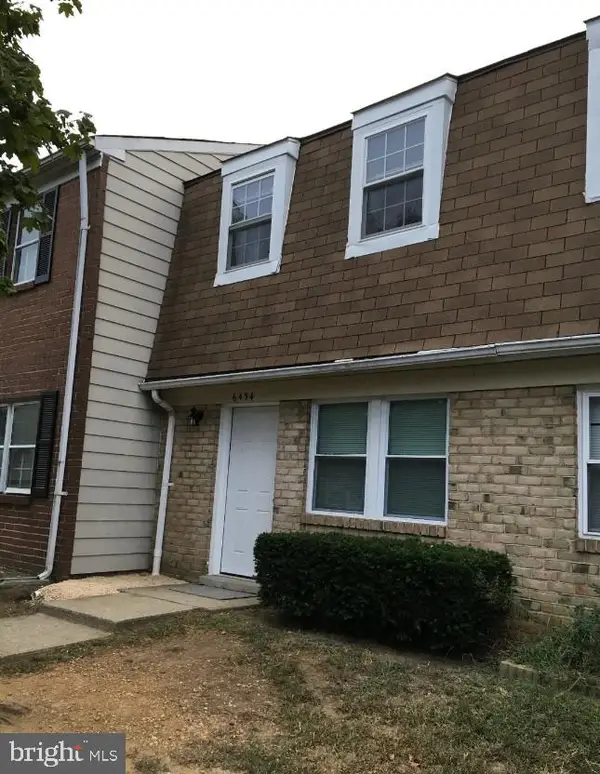 $218,000Coming Soon2 beds 1 baths
6454 Colonial Knls, GLEN BURNIE, MD 21061
MLS# MDAA2144044Listed by: REDFIN CORP - New
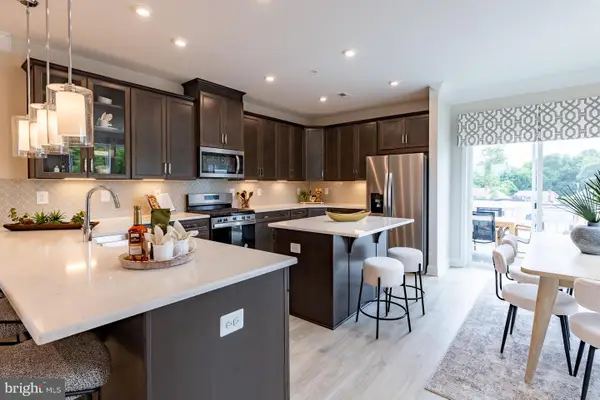
 $325,000Active3 beds 2 baths1,550 sq. ft.
7508 Whaler Ct, GLEN BURNIE, MD 21061
MLS# MDAA2143994Listed by: LPT REALTY, LLC 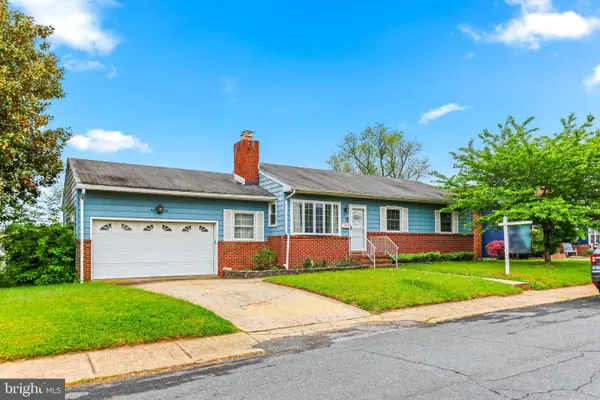 $400,000Pending3 beds 1 baths1,040 sq. ft.
1137 Mchenry Dr, GLEN BURNIE, MD 21061
MLS# MDAA2141002Listed by: NEXT STEP REALTY- New
 $475,000Active4 beds 3 baths2,017 sq. ft.
7969 Crownsway, GLEN BURNIE, MD 21061
MLS# MDAA2143634Listed by: KELLER WILLIAMS FLAGSHIP - New
 $385,000Active2 beds 2 baths1,878 sq. ft.
1710 Pleasantville Dr, GLEN BURNIE, MD 21061
MLS# MDAA2143082Listed by: SAMSON PROPERTIES  $400,000Pending4 beds 2 baths1,852 sq. ft.
5810 Ritchie St, GLEN BURNIE, MD 21061
MLS# MDAA2142578Listed by: NORTHROP REALTY- New
 $439,900Active3 beds 2 baths2,183 sq. ft.
812 Glenview Ave, GLEN BURNIE, MD 21061
MLS# MDAA2143860Listed by: HYATT & COMPANY REAL ESTATE, LLC - Coming Soon
 $395,000Coming Soon4 beds 2 baths
8 Eastern St, GLEN BURNIE, MD 21061
MLS# MDAA2143692Listed by: SAMSON PROPERTIES - Open Sat, 11am to 3pmNew
 $495,000Active3 beds 2 baths1,898 sq. ft.
415 Irene Dr, GLEN BURNIE, MD 21061
MLS# MDAA2143674Listed by: BENNETT REALTY SOLUTIONS - New

 $299,900Active3 beds 2 baths2,150 sq. ft.
311 Ferndale Rd, GLEN BURNIE, MD 21061
MLS# MDAA2143626Listed by: CENTURY 21 DOWNTOWN - New
 $365,000Active3 beds 2 baths988 sq. ft.
1903 Norwich Rd, GLEN BURNIE, MD 21061
MLS# MDAA2143494Listed by: TAYLOR PROPERTIES - New
 $574,900Active4 beds 4 baths2,825 sq. ft.
100 3rd Ave Se, GLEN BURNIE, MD 21061
MLS# MDAA2138620Listed by: DOUGLAS REALTY LLC - New
 $349,000Active3 beds 3 baths1,404 sq. ft.
650 Sprite Way, GLEN BURNIE, MD 21061
MLS# MDAA2143440Listed by: FAIRFAX REALTY SELECT - New
 $375,000Active3 beds 2 baths1,840 sq. ft.
601 W. Furnace Rd, GLEN BURNIE, MD 21061
MLS# MDAA2143302Listed by: LPT REALTY, LLC  $499,999Active3 beds 3 baths1,598 sq. ft.
7956 Oakwood Rd, GLEN BURNIE, MD 21061
MLS# MDAA2142794Listed by: REAL ESTATE PROFESSIONALS, INC.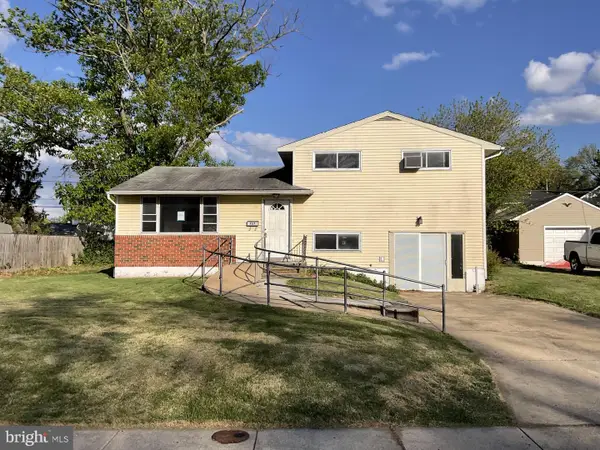 $290,000Pending3 beds 2 baths1,612 sq. ft.
727 Delmar Ave, GLEN BURNIE, MD 21061
MLS# MDAA2143242Listed by: VYLLA HOME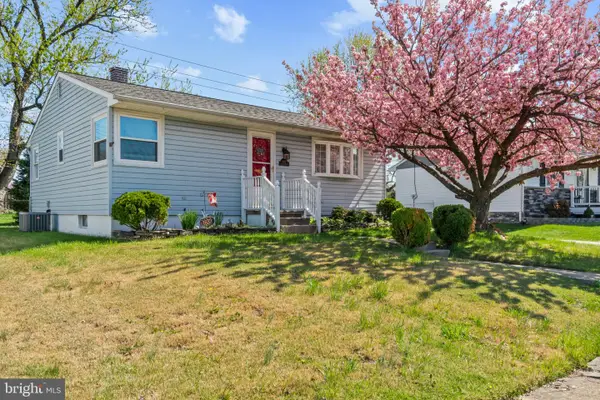 $339,900Pending3 beds 1 baths1,344 sq. ft.
1633 Tieman Dr, GLEN BURNIE, MD 21061
MLS# MDAA2141382Listed by: CORNER HOUSE REALTY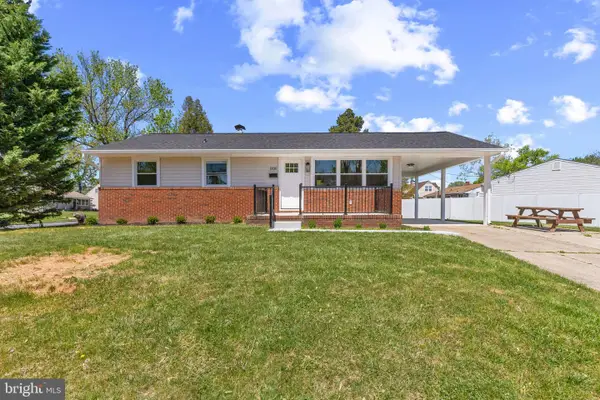 $410,000Pending4 beds 2 baths1,280 sq. ft.
1830 Norfolk Rd, GLEN BURNIE, MD 21061
MLS# MDAA2143080Listed by: KELLER WILLIAMS LUCIDO AGENCY- Open Sat, 12 to 4pm
 $499,990Active3 beds 3 baths2,122 sq. ft.
8291 Longford Rd, MILLERSVILLE, MD 21108
MLS# MDAA2143078Listed by: KELLER WILLIAMS REALTY CENTRE  $574,990Active3 beds 4 baths2,202 sq. ft.
8288 Longford Rd, MILLERSVILLE, MD 21108
MLS# MDAA2143052Listed by: KELLER WILLIAMS REALTY CENTRE- Open Wed, 11am to 5pm
 $795,653Active3 beds 4 baths2,228 sq. ft.
207 Allen Ln, POOLESVILLE, MD 20837
MLS# MDMC2223720Listed by: RORY S. COAKLEY REALTY, INC. 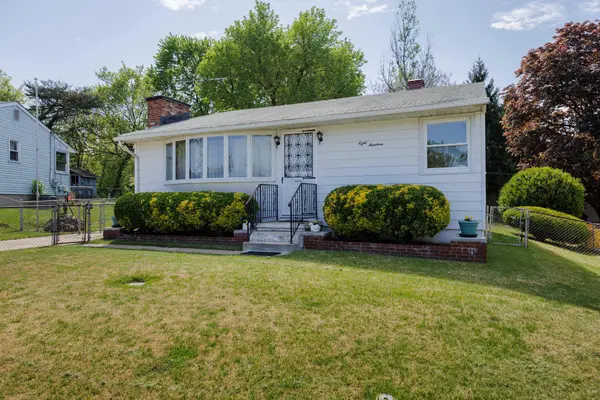 $360,000Active3 beds 1 baths1,346 sq. ft.
819 Bentwillow Dr, GLEN BURNIE, MD 21061
MLS# MDAA2143008Listed by: LONG & FOSTER REAL ESTATE, INC.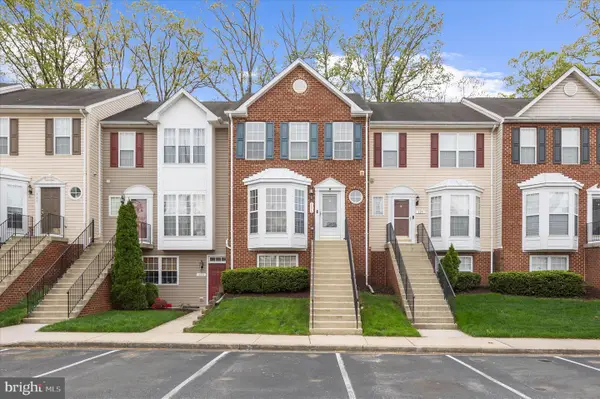 $325,000Active2 beds 2 baths1,372 sq. ft.
131 Heather Stone Way #11, GLEN BURNIE, MD 21061
MLS# MDAA2142926Listed by: COLDWELL BANKER REALTY- Open Wed, 11am to 5pm
 $847,058Active3 beds 4 baths2,175 sq. ft.
205 Allen Ln, POOLESVILLE, MD 20837
MLS# MDMC2223724Listed by: RORY S. COAKLEY REALTY, INC.  $299,900Pending3 beds 2 baths1,498 sq. ft.
1002 Rosedale Ave, GLEN BURNIE, MD 21061
MLS# MDAA2142740Listed by: MD REAL ESTATE BROKERAGE $465,000Active3 beds 4 baths1,812 sq. ft.
7503 Resch Loop, GLEN BURNIE, MD 21061
MLS# MDAA2142836Listed by: COMPASS- Coming Soon
 $459,900Coming Soon4 beds 2 baths
306 Shetlands Ln, GLEN BURNIE, MD 21061
MLS# MDAA2142598Listed by: RE/MAX EXECUTIVE  $565,000Pending4 beds 3 baths2,832 sq. ft.
132 Red Fox Cir, GLEN BURNIE, MD 21061
MLS# MDAA2142096Listed by: COMPASS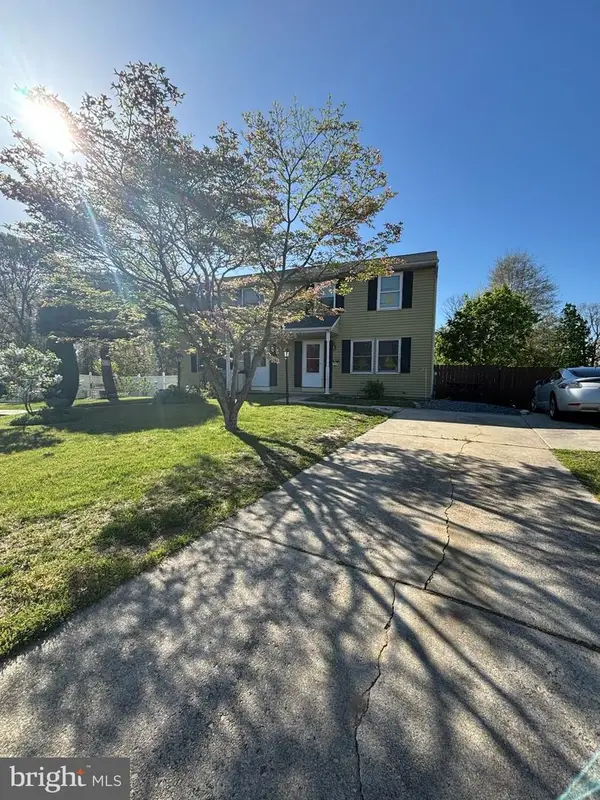 $365,000Pending4 beds 2 baths1,456 sq. ft.
8041 Bosley Ct, GLEN BURNIE, MD 21061
MLS# MDAA2142844Listed by: REDFIN CORP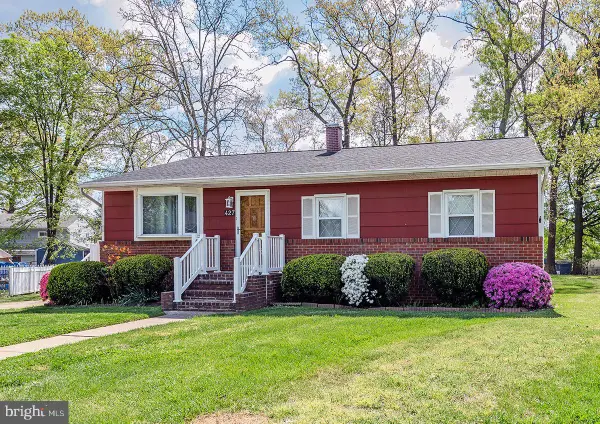 $385,000Pending3 beds 2 baths1,120 sq. ft.
427 Carol Ct, GLEN BURNIE, MD 21061
MLS# MDAA2142748Listed by: TAYLOR PROPERTIES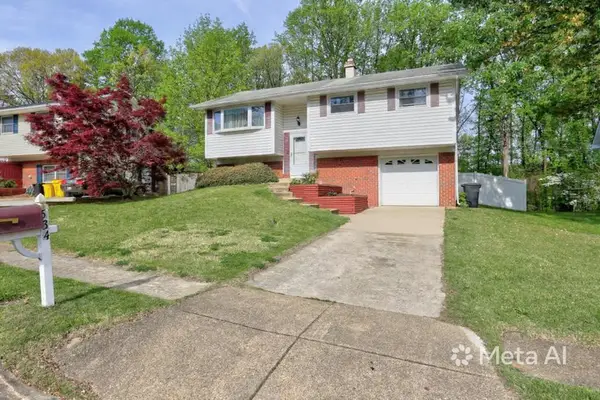 $400,000Pending3 beds 2 baths1,559 sq. ft.
534 Crestpark Dr, GLEN BURNIE, MD 21061
MLS# MDAA2102368Listed by: COMPASS $435,900Active4 beds 2 baths1,405 sq. ft.
7121 Baltimore Annapolis Blvd, GLEN BURNIE, MD 21061
MLS# MDAA2142778Listed by: COLDWELL BANKER REALTY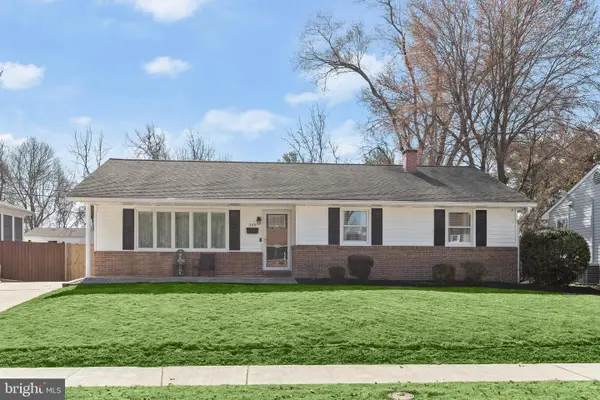 $445,000Pending3 beds 3 baths1,728 sq. ft.
388 Fleagle Rd, GLEN BURNIE, MD 21061
MLS# MDAA2142676Listed by: REDFIN CORP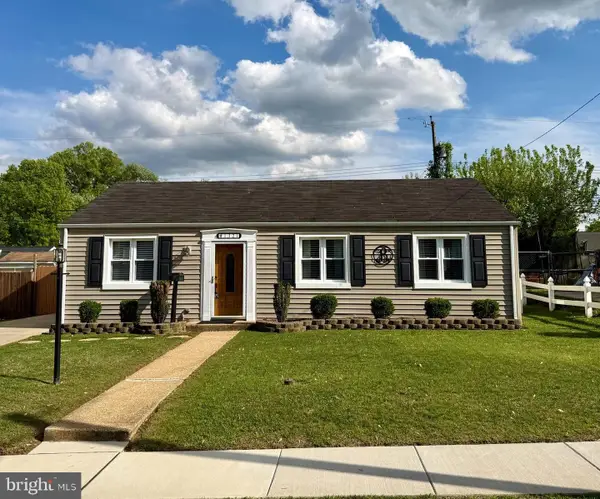 $340,000Pending3 beds 1 baths988 sq. ft.
1321 Gatwick Rd, GLEN BURNIE, MD 21061
MLS# MDAA2142714Listed by: SYNERGY REALTY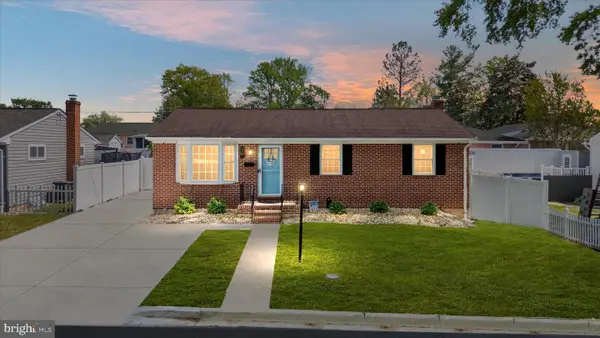 $464,000Pending3 beds 3 baths1,440 sq. ft.
3 Belvedere Ave, GLEN BURNIE, MD 21061
MLS# MDAA2142712Listed by: DOUGLAS REALTY LLC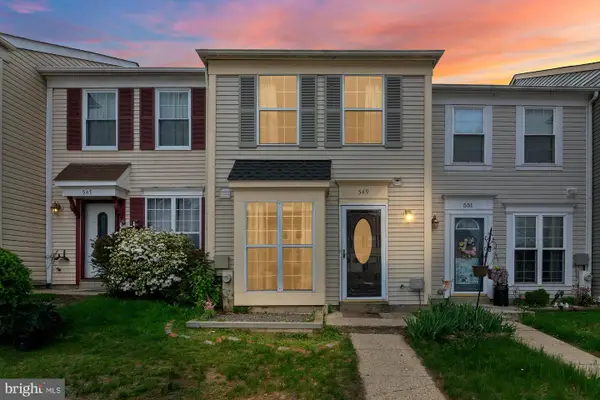 $300,000Pending2 beds 2 baths972 sq. ft.
549 Dahlgreen Rd, GLEN BURNIE, MD 21061
MLS# MDAA2142560Listed by: KELLER WILLIAMS FLAGSHIP $599,999Active3 beds 4 baths2,065 sq. ft.
5723 Howard Dr, GLEN BURNIE, MD 21061
MLS# MDAA2142570Listed by: LPT REALTY, LLC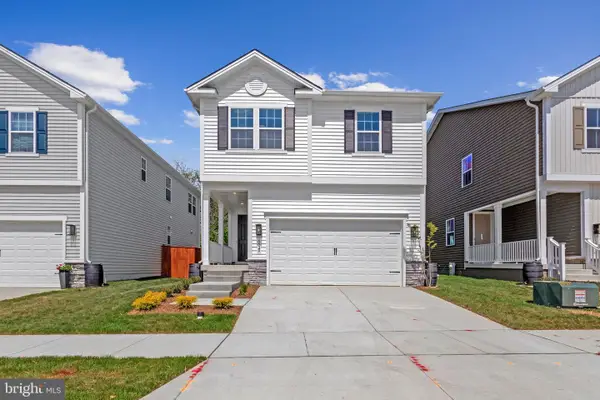 $614,999Active4 beds 4 baths2,346 sq. ft.
5720 Howard Dr, GLEN BURNIE, MD 21061
MLS# MDAA2142500Listed by: LPT REALTY, LLC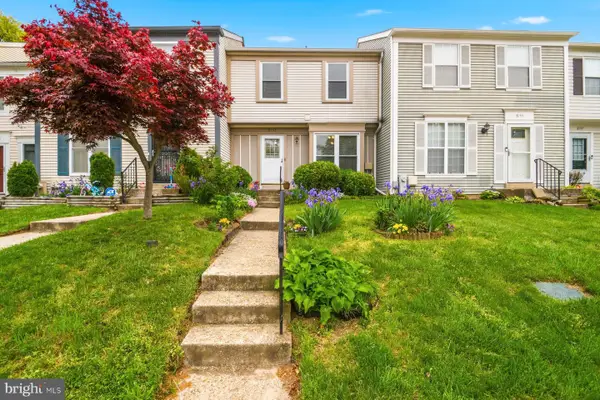 $315,500Pending3 beds 3 baths1,454 sq. ft.
8153 Turn Loop Rd, GLEN BURNIE, MD 21061
MLS# MDAA2142478Listed by: BERKSHIRE HATHAWAY HOMESERVICES PENFED REALTY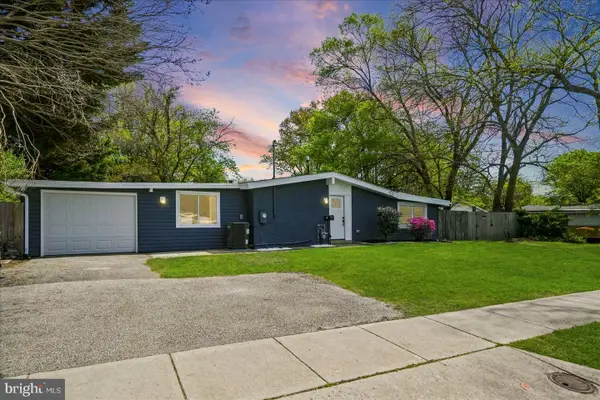 $459,000Pending4 beds 3 baths1,732 sq. ft.
214 Saint James Dr, GLEN BURNIE, MD 21061
MLS# MDAA2142444Listed by: DEAUSEN REALTY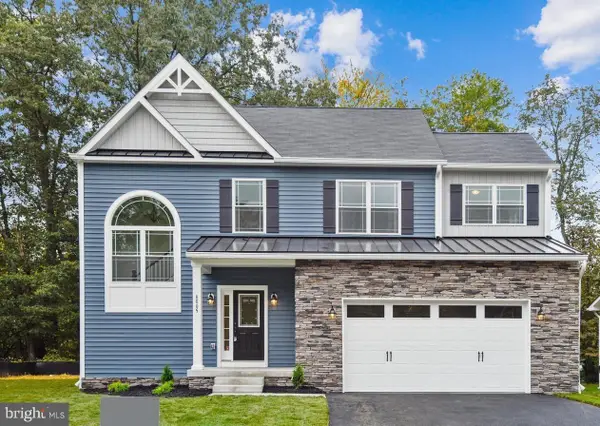 $659,900Active4 beds 2 baths2,103 sq. ft.
104 Euphoria Ct, GLEN BURNIE, MD 21061
MLS# MDAA2142354Listed by: DOUGLAS REALTY LLC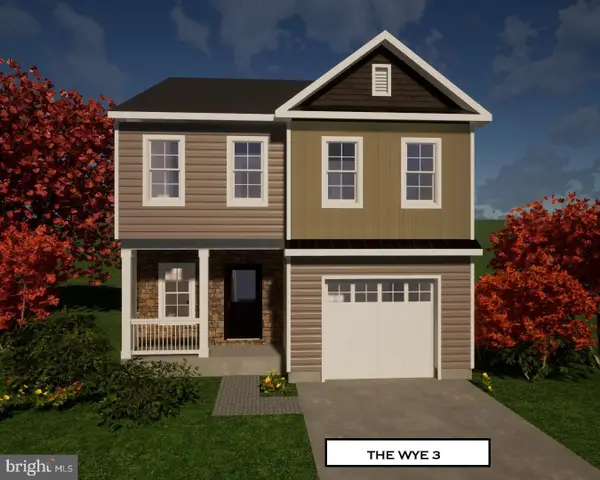 $639,900Active3 beds 2 baths2,030 sq. ft.
106 Euphoria Ct, GLEN BURNIE, MD 21061
MLS# MDAA2142374Listed by: DOUGLAS REALTY LLC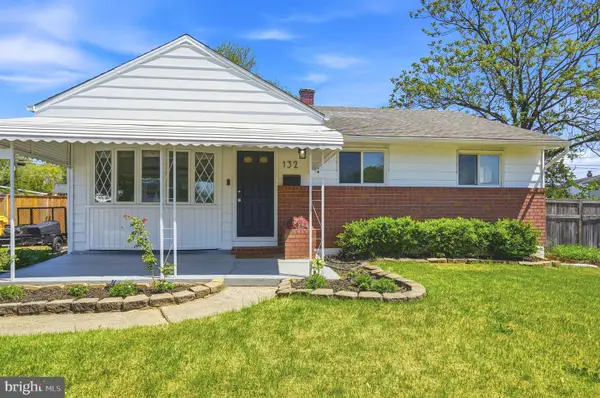 $389,000Pending3 beds 2 baths1,749 sq. ft.
132 Janelin Ct, GLEN BURNIE, MD 21061
MLS# MDAA2141876Listed by: EXP REALTY, LLC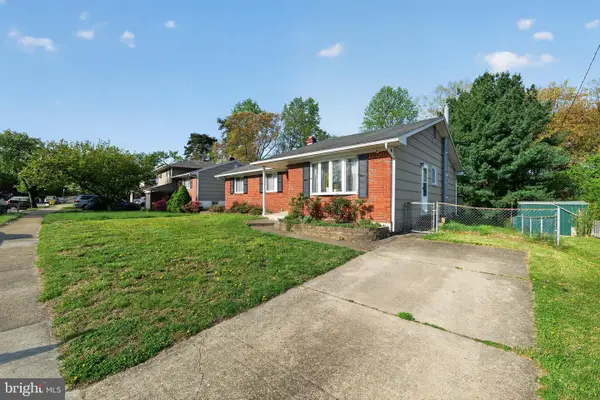 $410,000Active3 beds 2 baths1,870 sq. ft.
8113 Phirne Rd E, GLEN BURNIE, MD 21061
MLS# MDAA2142250Listed by: SAMSON PROPERTIES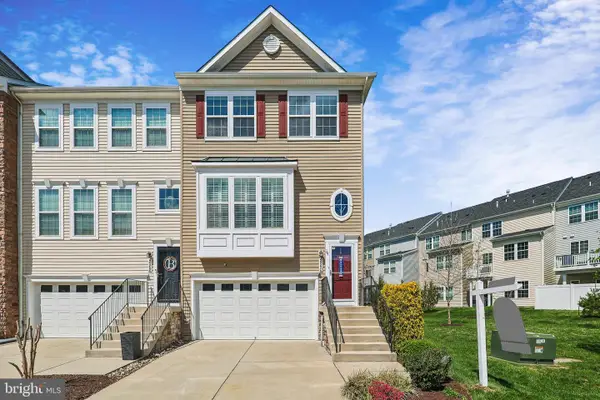 $565,000Pending3 beds 4 baths2,932 sq. ft.
220 Cabernet St, MILLERSVILLE, MD 21108
MLS# MDAA2140660Listed by: BERKSHIRE HATHAWAY HOMESERVICES HOMESALE REALTY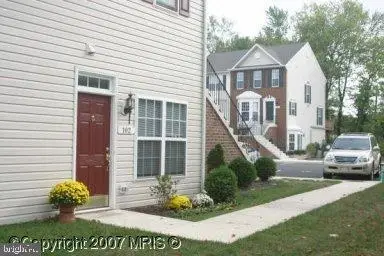 $285,000Active2 beds 2 baths1,360 sq. ft.
102 Heather Stone Way #82, GLEN BURNIE, MD 21061
MLS# MDAA2142110Listed by: S & S ASSET MANAGEMENT GROUP LLC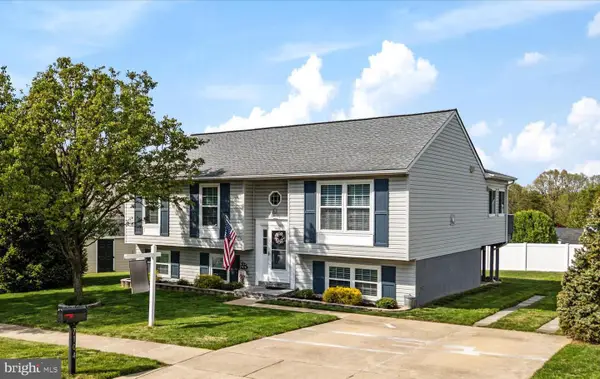 $517,500Pending3 beds 3 baths2,370 sq. ft.
7104 Rumford Dr, GLEN BURNIE, MD 21061
MLS# MDAA2141996Listed by: SYNERGY REALTY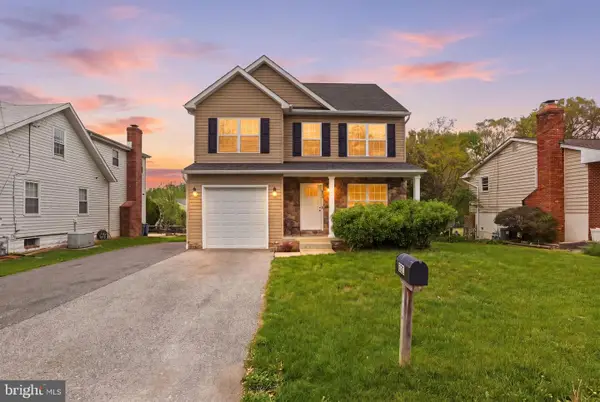 $499,000Pending3 beds 3 baths2,364 sq. ft.
821 N Broadview Blvd, GLEN BURNIE, MD 21061
MLS# MDAA2141972Listed by: SMART REALTY, LLC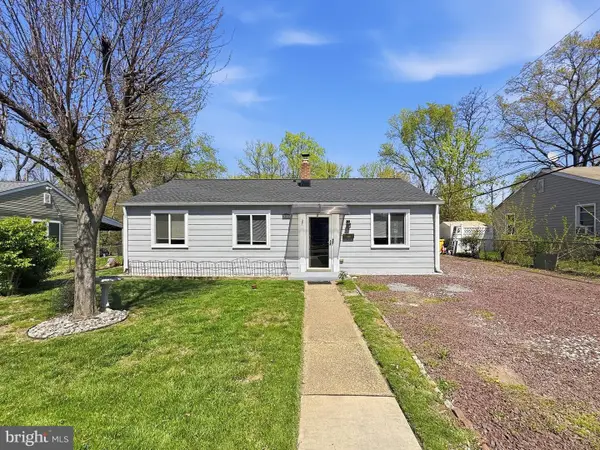 $339,900Pending3 beds 1 baths988 sq. ft.
1616 Lorimer Rd, GLEN BURNIE, MD 21061
MLS# MDAA2141966Listed by: SMART REALTY, LLC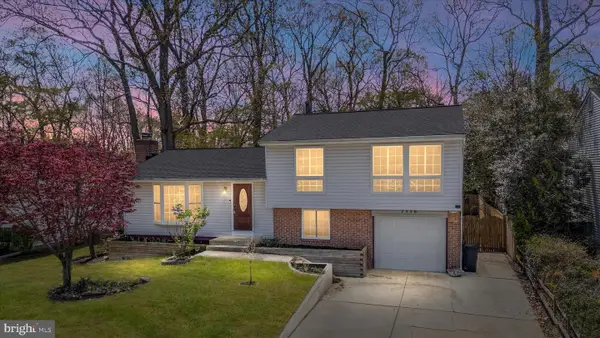 $445,000Pending3 beds 2 baths1,776 sq. ft.
7958 Covington Ave, GLEN BURNIE, MD 21061
MLS# MDAA2141912Listed by: KELLER WILLIAMS FLAGSHIP- Open Sat, 12 to 2pm
 $415,000Active4 beds 2 baths1,140 sq. ft.
15 Georgia Ave Nw, GLEN BURNIE, MD 21061
MLS# MDAA2141942Listed by: RE/MAX CONCIERGE REALTY 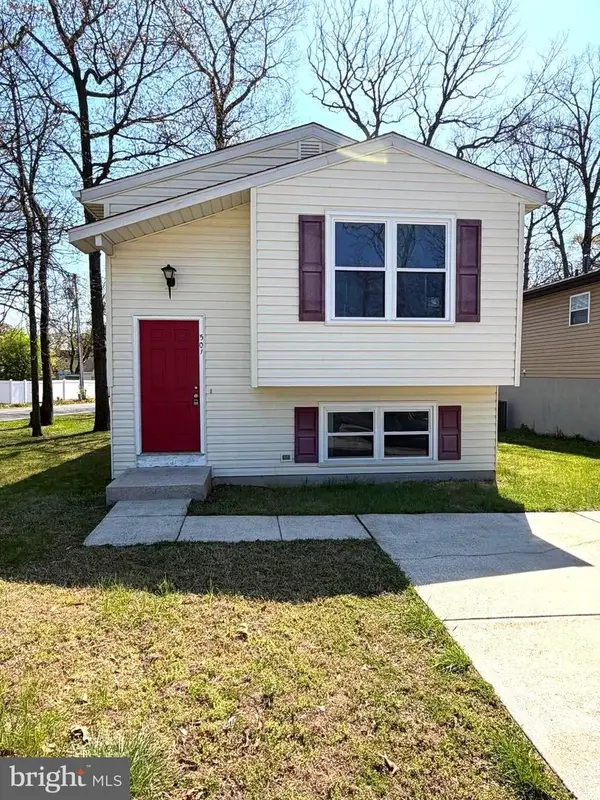 $315,000Pending3 beds 2 baths1,026 sq. ft.
501 Glen Heights Ave, GLEN BURNIE, MD 21061
MLS# MDAA2141932Listed by: TAYLOR PROPERTIES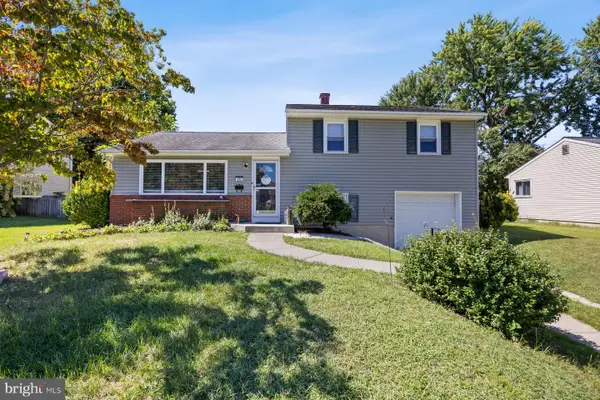 $450,000Pending6 beds 2 baths1,344 sq. ft.
612 Carolyn Rd, GLEN BURNIE, MD 21061
MLS# MDAA2141812Listed by: EXP REALTY, LLC- Coming Soon
 $400,000Coming Soon2 beds 2 baths
703 Cedar Ave, GLEN BURNIE, MD 21061
MLS# MDAA2141788Listed by: REDFIN CORP  $445,000Pending4 beds 3 baths1,786 sq. ft.
216 Allwood Dr, GLEN BURNIE, MD 21061
MLS# MDAA2141784Listed by: LONG & FOSTER REAL ESTATE, INC.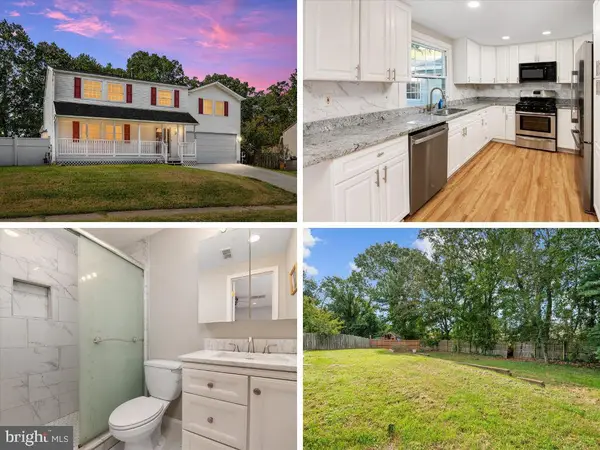 $575,000Pending6 beds 4 baths2,903 sq. ft.
720 Hyde Park Dr, GLEN BURNIE, MD 21061
MLS# MDAA2141738Listed by: KELLER WILLIAMS FLAGSHIP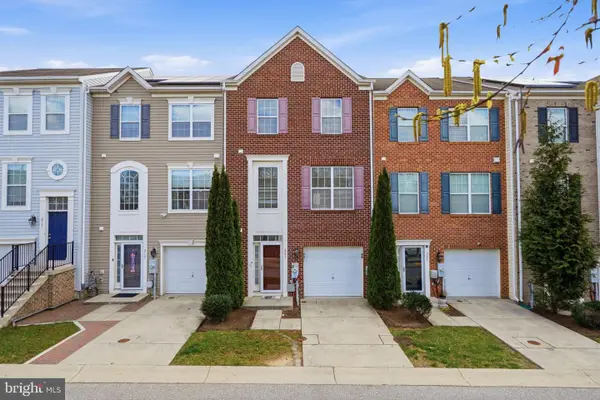 $442,000Active3 beds 4 baths2,200 sq. ft.
221 Truck Farm Dr, GLEN BURNIE, MD 21061
MLS# MDAA2141420Listed by: BRICK AND QUILL REALTY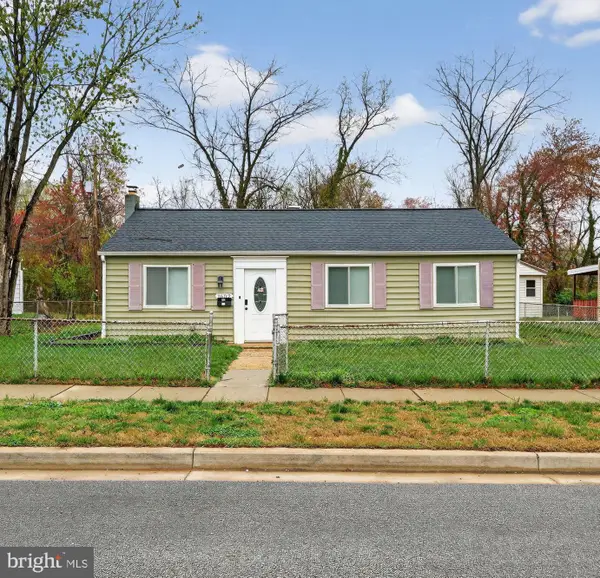 $339,900Pending3 beds 2 baths988 sq. ft.
1602 Lorimer Rd, GLEN BURNIE, MD 21061
MLS# MDAA2141358Listed by: HOUWZER, LLC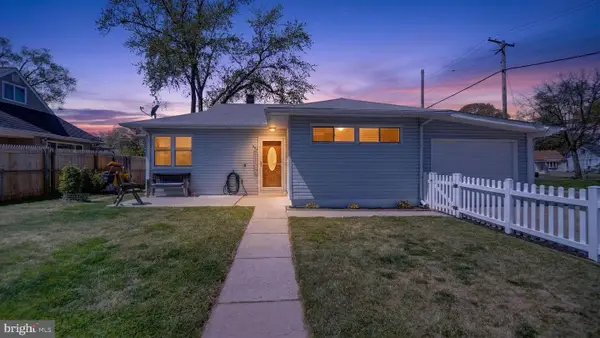 $350,000Pending3 beds 1 baths1,190 sq. ft.
502 Wimmer Rd, GLEN BURNIE, MD 21061
MLS# MDAA2141398Listed by: RE/MAX EXECUTIVE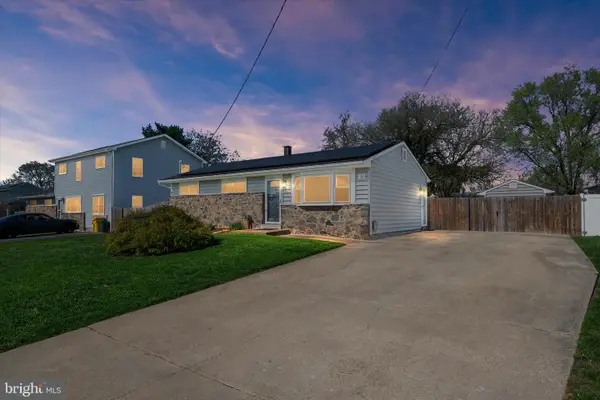 $459,000Pending3 beds 2 baths1,710 sq. ft.
10 Idlewood St, GLEN BURNIE, MD 21061
MLS# MDAA2141234Listed by: RE/MAX EXECUTIVE $529,900Pending3 beds 3 baths2,620 sq. ft.
730 Snowdon Ln, GLEN BURNIE, MD 21061
MLS# MDAA2141226Listed by: COLDWELL BANKER REALTY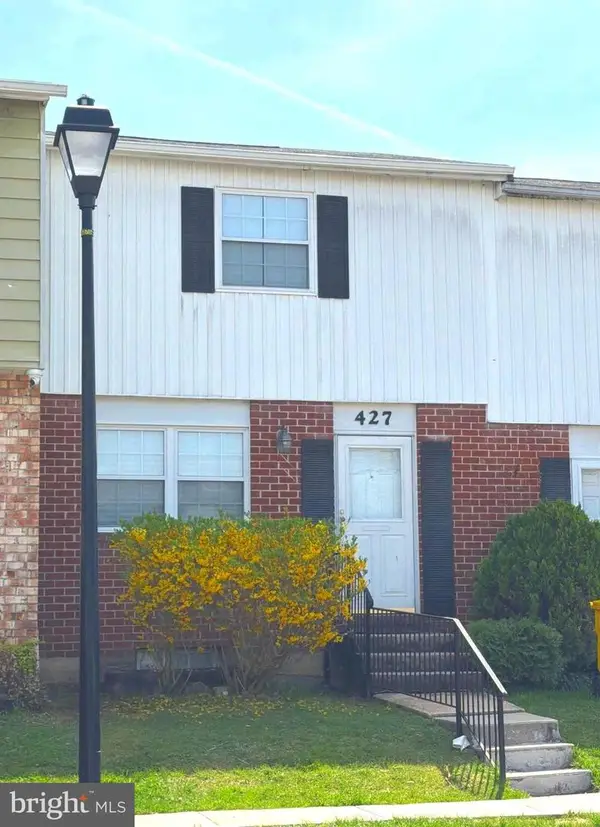 $199,999Pending2 beds 2 baths1,128 sq. ft.
427 Hardmoore Ct, GLEN BURNIE, MD 21061
MLS# MDAA2141036Listed by: RE/MAX EXECUTIVE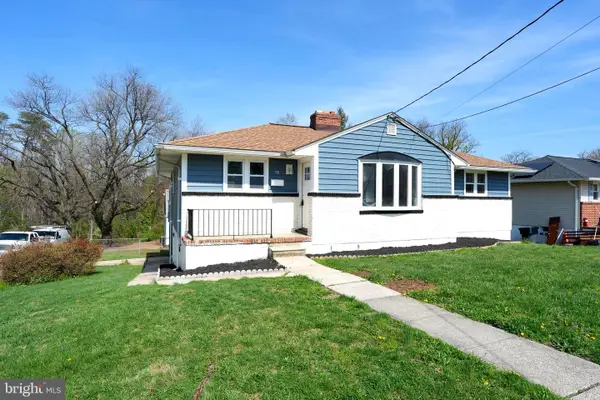 $495,000Active5 beds 2 baths2,256 sq. ft.
18 Magnolia Ave, GLEN BURNIE, MD 21061
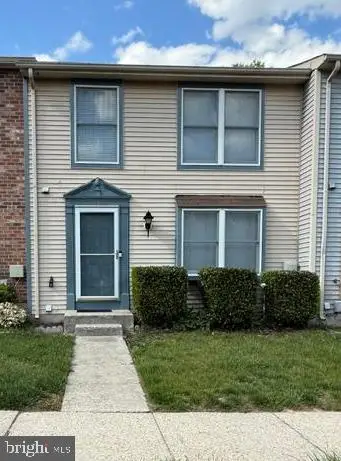
MLS# MDAA2141082Listed by: SPRING HILL REAL ESTATE, LLC.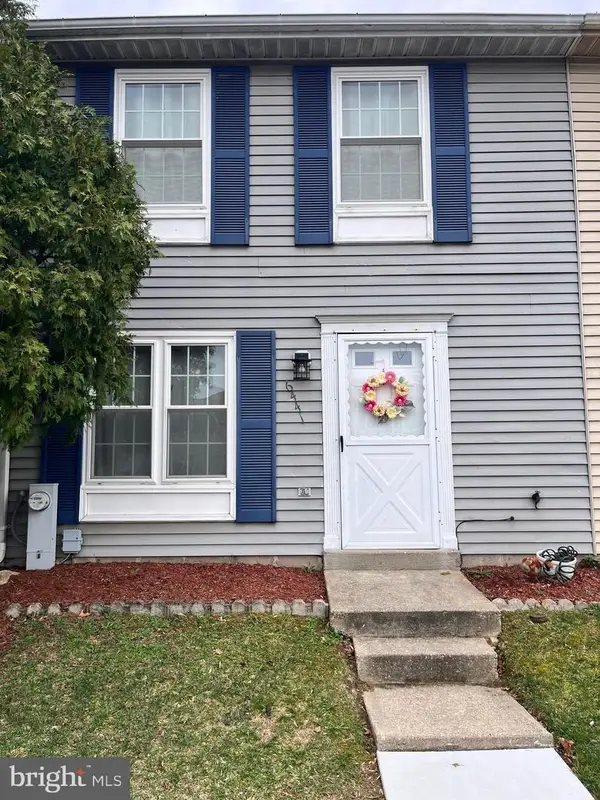 $265,000Pending3 beds 2 baths1,116 sq. ft.
6441 Grafton Garth Ct, GLEN BURNIE, MD 21061
MLS# MDAA2140980Listed by: REAL BROKER, LLC $382,500Pending3 beds 2 baths1,558 sq. ft.
312 Sw Pershing Ave, GLEN BURNIE, MD 21061
MLS# MDAA2140904Listed by: DOUGLAS REALTY LLC $325,000Pending3 beds 2 baths1,180 sq. ft.
526 Bend Circle Rd, GLEN BURNIE, MD 21061
MLS# MDAA2140812Listed by: DOUGLAS REALTY LLC $390,000Pending3 beds 2 baths1,406 sq. ft.
600 Oakwood Rd, GLEN BURNIE, MD 21061
MLS# MDAA2140612Listed by: FAIRFAX REALTY PREMIER $498,500Active3 beds 4 baths1,817 sq. ft.
307 Broad Ave, GLEN BURNIE, MD 21061
MLS# MDAA2140124Listed by: ABR $299,999Pending3 beds 2 baths1,440 sq. ft.
457 Mainview Ct, GLEN BURNIE, MD 21061
MLS# MDAA2140540Listed by: CUMMINGS & CO. REALTORS $229,000Pending2 beds 2 baths1,054 sq. ft.
200 Juneberry Way #2c, GLEN BURNIE, MD 21061
MLS# MDAA2140464Listed by: CENTURY 21 NEW MILLENNIUM $434,900Active3 beds 2 baths1,840 sq. ft.
307 Oxford Dr, GLEN BURNIE, MD 21061
MLS# MDAA2140294Listed by: SIMMS AND ASSOCIATES $345,000Active3 beds 1 baths1,068 sq. ft.
301 8th Ave Se, GLEN BURNIE, MD 21061
MLS# MDAA2140472Listed by: DOUGLAS REALTY LLC $440,000Active5 beds 2 baths1,764 sq. ft.
306a Montfield Ln, GLEN BURNIE, MD 21061
MLS# MDAA2140186Listed by: HYATT & COMPANY REAL ESTATE LLC $439,900Pending4 beds 2 baths2,030 sq. ft.
1302 Whitman Dr, GLEN BURNIE, MD 21061
MLS# MDAA2139154Listed by: LONG & FOSTER REAL ESTATE, INC. $609,999Active3 beds 4 baths2,065 sq. ft.
5737 Howard Dr, GLEN BURNIE, MD 21061
MLS# MDAA2140308Listed by: LPT REALTY, LLC $355,900Pending3 beds 1 baths912 sq. ft.
1011 Londonderry Dr, GLEN BURNIE, MD 21061
MLS# MDAA2139618Listed by: TAYLOR PROPERTIES $299,950Active2 beds 2 baths960 sq. ft.
8114 Cloverhurst Rd, GLEN BURNIE, MD 21061
MLS# MDAA2139588Listed by: EXECUHOME REALTY $539,900Pending5 beds 4 baths3,284 sq. ft.
107 Ferndale Ave, GLEN BURNIE, MD 21061
MLS# MDAA2140152Listed by: DOUGLAS REALTY LLC $550,000Pending4 beds 3 baths2,072 sq. ft.
645 Ridgefield Ct, GLEN BURNIE, MD 21061
MLS# MDAA2140198Listed by: CUMMINGS & CO. REALTORS $380,000Pending3 beds 2 baths1,696 sq. ft.
804 Bentwillow Dr, GLEN BURNIE, MD 21061
MLS# MDAA2139832Listed by: COMPASS $384,900Pending3 beds 2 baths1,438 sq. ft.
258 Heartwood Ct, GLEN BURNIE, MD 21061
MLS# MDAA2140004Listed by: COLDWELL BANKER CHESAPEAKE REAL ESTATE COMPANY $399,999Pending3 beds 3 baths2,656 sq. ft.
114 2nd Ave N, GLEN BURNIE, MD 21061
MLS# MDAA2139990Listed by: RE/MAX EXECUTIVE $415,000Active3 beds 2 baths1,872 sq. ft.
711 Wellham Ave, GLEN BURNIE, MD 21061
MLS# MDAA2135504Listed by: BERKSHIRE HATHAWAY HOMESERVICES PENFED REALTY $499,990Active3 beds 4 baths2,122 sq. ft.
8291 Longford Rd, MILLERSVILLE, MD 21108
MLS# MDAA2139784Listed by: KELLER WILLIAMS REALTY CENTRE $610,999Pending3 beds 4 baths2,065 sq. ft.
5731 Howard Dr, GLEN BURNIE, MD 21060
MLS# MDAA2139762Listed by: LPT REALTY, LLC $634,999Active4 beds 4 baths2,346 sq. ft.
5726 Howard Dr, GLEN BURNIE, MD 21060
MLS# MDAA2139764Listed by: LPT REALTY, LLC $459,900Active4 beds 4 baths1,170 sq. ft.
619 Old Stage Rd, GLEN BURNIE, MD 21061
MLS# MDAA2139216Listed by: WEICHERT REALTORS - MCKENNA & VANE $425,000Pending3 beds 2 baths1,924 sq. ft.
413 Elm Ave, GLEN BURNIE, MD 21061
MLS# MDAA2135890Listed by: NORTHROP REALTY $375,000Pending3 beds 4 baths1,762 sq. ft.
7838 Foxfarm Ln, GLEN BURNIE, MD 21061
MLS# MDAA2139382Listed by: COLDWELL BANKER REALTY $235,000Active3 beds 1 baths1,056 sq. ft.
544 Glen Ct, GLEN BURNIE, MD 21061
MLS# MDAA2139642Listed by: INNOVATIVE PROPERTIES, INC.- Open Sat, 10am to 12pm
 $429,900Active3 beds 2 baths1,015 sq. ft.
1200 Whitman Dr, GLEN BURNIE, MD 21061
MLS# MDAA2139402Listed by: RE/MAX COMPONENTS 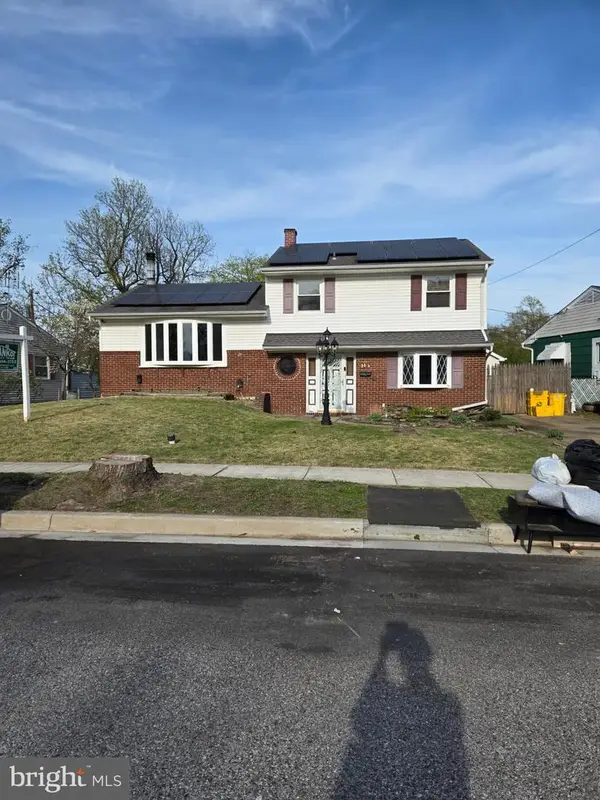 $379,900Pending3 beds 2 baths2,232 sq. ft.
513 Joy Cir, GLEN BURNIE, MD 21061
MLS# MDAA2138706Listed by: DOUGLAS REALTY LLC $356,000Active3 beds 1 baths1,132 sq. ft.
1412 Houghton Rd, GLEN BURNIE, MD 21061
MLS# MDAA2138188Listed by: MR. LISTER REALTY $409,999Active5 beds 2 baths1,710 sq. ft.
402 Glenmont Ave, GLEN BURNIE, MD 21061
MLS# MDAA2138480Listed by: LONG & FOSTER REAL ESTATE, INC. $250,000Pending4 beds 1 baths1,627 sq. ft.
1210 Cathedral Dr, GLEN BURNIE, MD 21061
MLS# MDAA2136876Listed by: KELLER WILLIAMS LEGACY $574,990Pending4 beds 4 baths2,202 sq. ft.
8278 Longford Rd, MILLERSVILLE, MD 21108
MLS# MDAA2138142Listed by: KELLER WILLIAMS REALTY CENTRE $599,990Pending3 beds 3 baths2,202 sq. ft.
8284 Longford Rd, MILLERSVILLE, MD 21108
MLS# MDAA2138146Listed by: KELLER WILLIAMS REALTY CENTRE $400,000Pending3 beds 2 baths1,621 sq. ft.
7980 Phirne Rd E, GLEN BURNIE, MD 21061
MLS# MDAA2137890Listed by: NORTHROP REALTY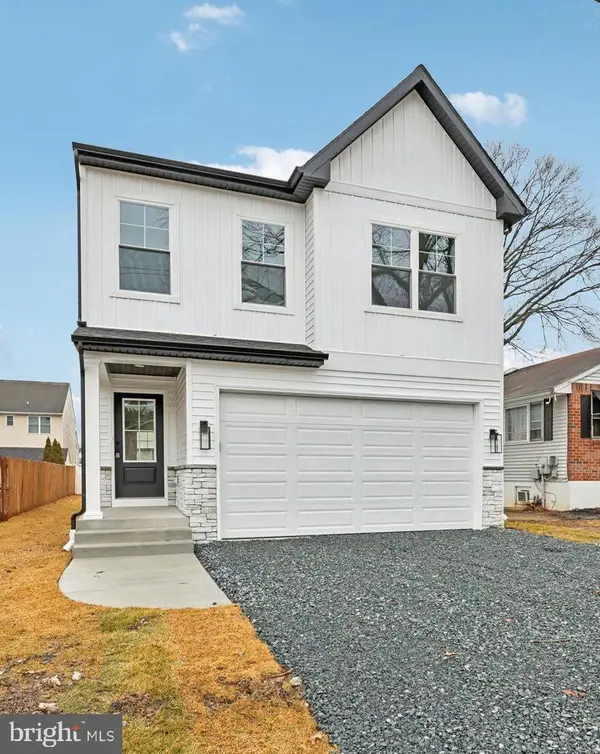 $605,000Active4 beds 4 baths2,388 sq. ft.
326 Thelma Ave, GLEN BURNIE, MD 21061
MLS# MDAA2138092Listed by: DOUGLAS REALTY LLC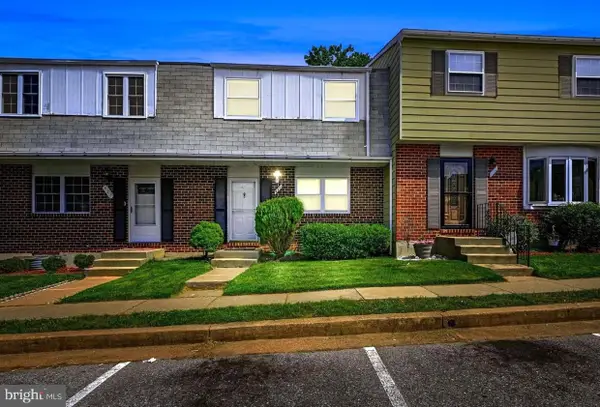 $300,000Active3 beds 2 baths1,580 sq. ft.
470 Long Towne Ct, GLEN BURNIE, MD 21061
MLS# MDAA2137454Listed by: EXP REALTY, LLC $465,000Pending4 beds 2 baths1,005 sq. ft.
1208 Branch Ln, GLEN BURNIE, MD 21061
MLS# MDAA2137132Listed by: KELLER WILLIAMS GATEWAY LLC $369,000Active3 beds 2 baths1,849 sq. ft.
208 Gloucester Dr, GLEN BURNIE, MD 21061
MLS# MDAA2137404Listed by: BERKSHIRE HATHAWAY HOMESERVICES PENFED REALTY $370,000Active3 beds 1 baths896 sq. ft.
1622 Tieman Dr, GLEN BURNIE, MD 21061
MLS# MDAA2137130Listed by: LONG & FOSTER REAL ESTATE, INC. $70,000Active0.1 Acres
Lots 13 & 14 Jeffrey Avenue, GLEN BURNIE, MD 21061
MLS# MDAA2136742Listed by: ARAGON REAL ESTATE LLC $489,900Active4 beds 3 baths1,812 sq. ft.
7940 Covington Ave, GLEN BURNIE, MD 21061
MLS# MDAA2136664Listed by: COLDWELL BANKER REALTY $589,999Active3 beds 4 baths2,065 sq. ft.
5729 Howard Dr, GLEN BURNIE, MD 21061
MLS# MDAA2136466Listed by: LPT REALTY, LLC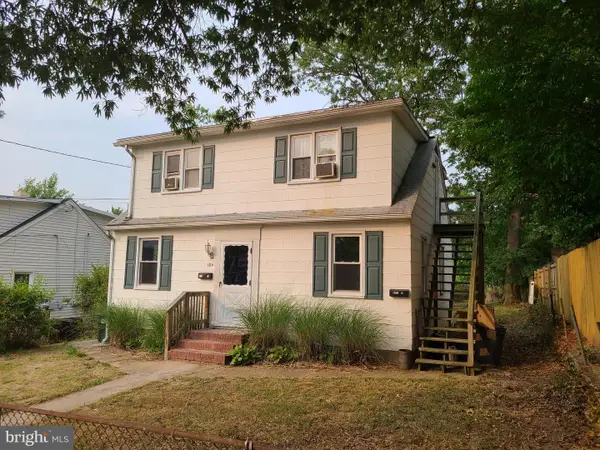 $440,000Active4 beds 2 baths1,088 sq. ft.
104 New Jersey Ave, GLEN BURNIE, MD 21061
MLS# MDAA2136646Listed by: DOUGLAS REALTY LLC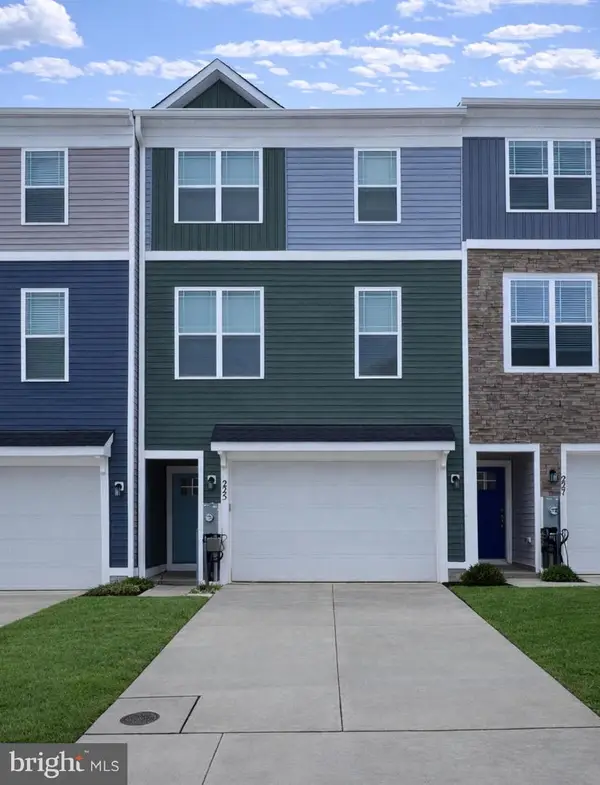 $525,000Active3 beds 4 baths2,275 sq. ft.
225 Jenkins Way, GLEN BURNIE, MD 21061
MLS# MDAA2135600Listed by: THE PINNACLE REAL ESTATE CO.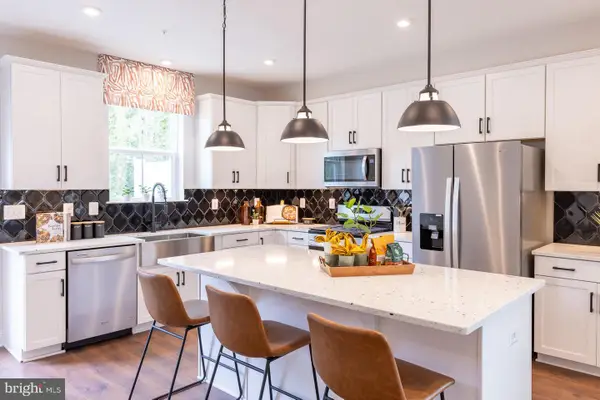 $574,990Pending3 beds 3 baths2,202 sq. ft.
8280 Longford Rd, MILLERSVILLE, MD 21108
MLS# MDAA2136194Listed by: KELLER WILLIAMS REALTY CENTRE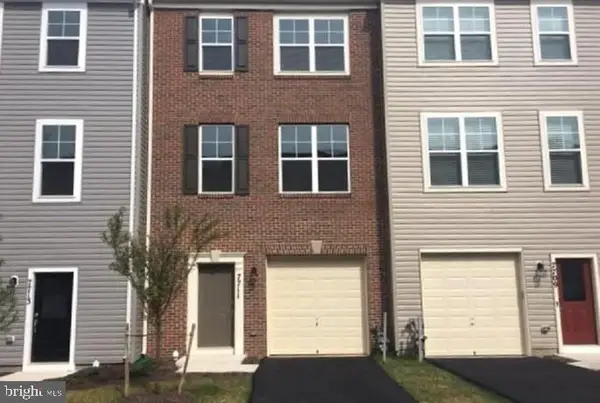 $424,900Active3 beds 4 baths2,040 sq. ft.
7711 Allen Wood Ct, GLEN BURNIE, MD 21061
MLS# MDAA2136120Listed by: VZZ BROKERAGE $420,000Pending5 beds 4 baths2,788 sq. ft.
1409 Tieman Dr, GLEN BURNIE, MD 21061
MLS# MDAA2135482Listed by: KW METRO CENTER- Open Sat, 12 to 4pm
 $499,990Active3 beds 4 baths2,122 sq. ft.
8287 Longford Rd, MILLERSVILLE, MD 21108
MLS# MDAA2135428Listed by: KELLER WILLIAMS REALTY CENTRE - Open Sat, 12 to 4pm
 $546,990Active3 beds 4 baths2,202 sq. ft.
647 Eastland Row, MILLERSVILLE, MD 21108
MLS# MDAA2135432Listed by: KELLER WILLIAMS REALTY CENTRE  $365,000Pending3 beds 1 baths1,416 sq. ft.
1420 Rowe Dr, GLEN BURNIE, MD 21061
MLS# MDAA2135436Listed by: COLDWELL BANKER REALTY $455,000Pending3 beds 4 baths1,880 sq. ft.
7819 Five Oaks Ct, GLEN BURNIE, MD 21061
MLS# MDAA2133996Listed by: SMART REALTY, LLC $340,000Pending3 beds 3 baths1,720 sq. ft.
7546 Whaler Ct, GLEN BURNIE, MD 21061
MLS# MDAA2137858Listed by: SMART REALTY, LLC $275,000Pending3 beds 2 baths1,470 sq. ft.
214 Christos Ct, GLEN BURNIE, MD 21061
MLS# MDAA2134238Listed by: DOUGLAS REALTY LLC $54,900Pending2 beds 1 baths756 sq. ft.
8049 Veterans Hwy #22, MILLERSVILLE, MD 21108
MLS# MDAA2134184Listed by: ABR $410,000Pending4 beds 2 baths1,810 sq. ft.
303 Oxford Dr, GLEN BURNIE, MD 21061
MLS# MDAA2134058Listed by: CAPRIKA REALTY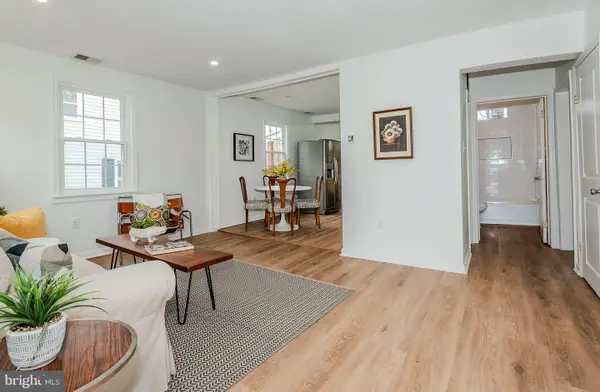 $329,900Pending3 beds 1 baths1,088 sq. ft.
108 New Jersey Ave Nw, GLEN BURNIE, MD 21061
MLS# MDAA2133836Listed by: DOUGLAS REALTY LLC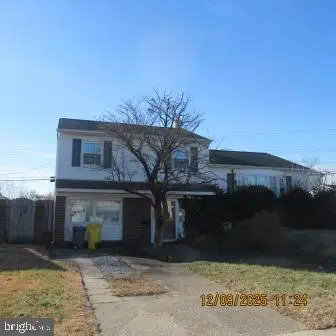 $340,000Active4 beds 3 baths2,688 sq. ft.
718 Mayo Rd, GLEN BURNIE, MD 21061
MLS# MDAA2133730Listed by: METRO BAY REALTY $439,900Pending5 beds 3 baths1,970 sq. ft.
237 Poplar Ave, GLEN BURNIE, MD 21061
MLS# MDAA2137766Listed by: LAZAR REAL ESTATE $461,900Pending4 beds 2 baths2,030 sq. ft.
1103 Rosedale Ave, GLEN BURNIE, MD 21061
MLS# MDAA2133264Listed by: CORNERSTONE REAL ESTATE $202,800Active2 beds 1 baths880 sq. ft.
528 Glen Ct, GLEN BURNIE, MD 21061
MLS# MDAA2132560Listed by: SAMSON PROPERTIES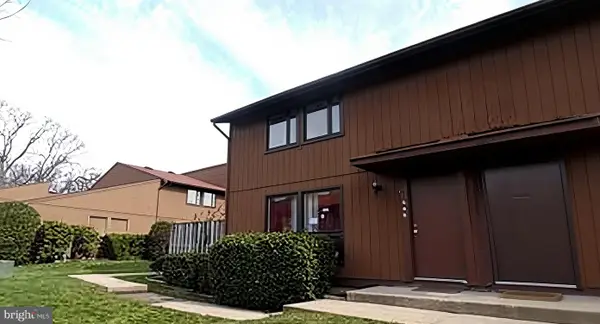 $229,900Pending2 beds 2 baths1,320 sq. ft.
450 West Ct #14i, GLEN BURNIE, MD 21061
MLS# MDAA2132290Listed by: LPT REALTY, LLC $339,900Active3 beds 1 baths1,466 sq. ft.
538 Elizabeth Ln, GLEN BURNIE, MD 21061
MLS# MDAA2131944Listed by: MAY REALTY $485,000Active4 beds 4 baths2,425 sq. ft.
207 Jenkins Way, GLEN BURNIE, MD 21061
MLS# MDAA2131534Listed by: ULTIMATE PROPERTIES, LLC. $530,000Pending4 beds 2 baths1,632 sq. ft.
8918 Twin Ridge Dr, GLEN BURNIE, MD 21061
MLS# MDAA2131264Listed by: KELLER WILLIAMS REALTY CENTRE $455,321Active3 beds 3 baths1,747 sq. ft.
106 3rd Ave Se, GLEN BURNIE, MD 21061
MLS# MDAA2127868Listed by: HOMESOURCE UNITED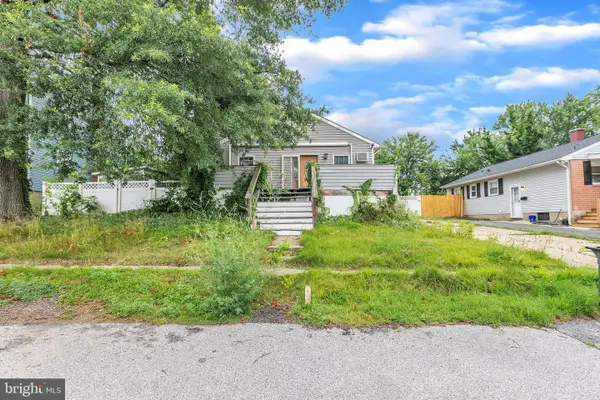 $230,000Pending2 beds 2 baths1,248 sq. ft.
104 Elm Ave, GLEN BURNIE, MD 21061
MLS# MDAA2118644Listed by: SELL YOUR HOME SERVICES $249,945Pending0.26 Acres
Jeffrey Ave, GLEN BURNIE, MD 21061
MLS# MDAA2115638Listed by: J. J. ROGERS REAL ESTATE $787,500Pending0.79 Acres
535 Arundel Ave, GLEN BURNIE, MD 21061
MLS# MDAA2115606Listed by: J. J. ROGERS REAL ESTATE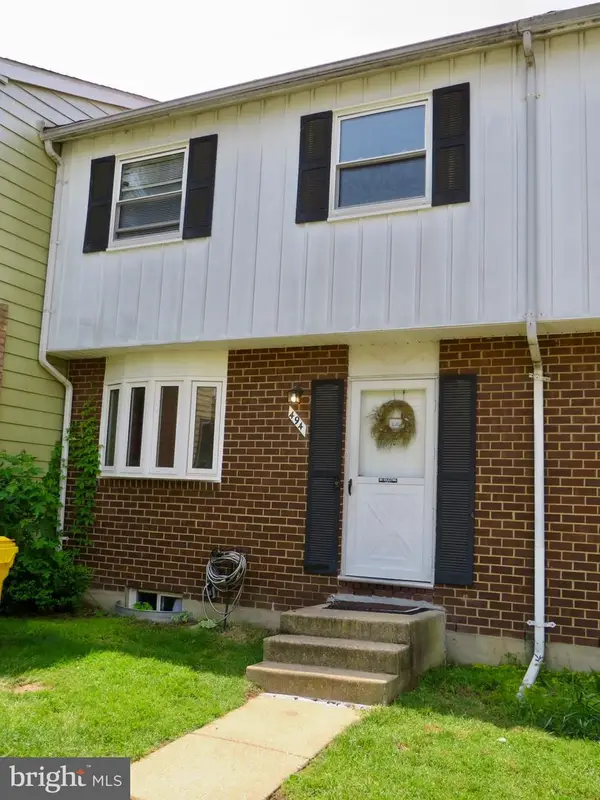 $270,000Pending3 beds 2 baths1,608 sq. ft.
494 Kenilworth Ct, GLEN BURNIE, MD 21061
MLS# MDAA2137030Listed by: DOUGLAS REALTY LLC $449,900Pending0.48 Acres
0 Bertram Ave, GLEN BURNIE, MD 21061
MLS# MDAA2112598Listed by: J. J. ROGERS REAL ESTATE $899,900Active3 beds 2 baths2,122 sq. ft.
7911 Ritchie Hwy, GLEN BURNIE, MD 21061
MLS# MDAA2110474Listed by: HSA REAL ESTATE GROUP, INC $210,000Pending4 beds 2 baths1,596 sq. ft.
1702 Manning Rd, GLEN BURNIE, MD 21061
MLS# MDAA2103782Listed by: DOUGLAS REALTY LLC $209,990Pending2 beds 1 baths880 sq. ft.
528 Glen Ct, GLEN BURNIE, MD 21061
MLS# MDAA2116376Listed by: EXP REALTY, LLC $300,000Pending4 beds 1 baths1,566 sq. ft.
103 Vista Ave, GLEN BURNIE, MD 21061
MLS# MDAA2137368Listed by: VYBE REALTY $750,000Pending5.59 Acres
7940 East Park Dr, GLEN BURNIE, MD 21061
MLS# MDAA2070152Listed by: THE REAL ESTATE AUTHORITY
Local realty services provided by:CENTURY 21 Downtown
Popular searches near 21061
Popular neighborhoods near 21061
- Brooklyn, Brooklyn homes for sale
- Brooklyn Park, Brooklyn homes for sale
- Cherry Hill, Brooklyn homes for sale
- Curtis Bay, Curtis Bay homes for sale
- Elkridge, Elkridge homes for sale
- Ferndale, Glen Burnie homes for sale
- Fort Meade, Fort George G Meade homes for sale
- Gambrills, Severn homes for sale
- Glen Burnie, Glen Burnie homes for sale
- Jessup, Jessup homes for sale
- Lakeland, Baltimore homes for sale
- Linthicum, Linthicum Heights homes for sale
- Morrell Park, Baltimore homes for sale
- Pasadena, Glen Burnie homes for sale
- Port Covington, Baltimore homes for sale
- Riviera Beach, Pasadena homes for sale
- Severn, Severn homes for sale
- Severna Park, Severna Park homes for sale
- South, Curtis Bay homes for sale
- Westport, Baltimore homes for sale
Counties near Glen Burnie, 21061
- Alexandria city County homes for sale
- Anne Arundel County homes for sale
- Arlington County homes for sale
- Baltimore County homes for sale
- Baltimore city County homes for sale
- Calvert County homes for sale
- Carroll County homes for sale
- Cecil County homes for sale
- District of Columbia County homes for sale
- Fairfax County homes for sale
- Fairfax city County homes for sale
- Falls Church city County homes for sale
- Frederick County homes for sale
- Harford County homes for sale
- Howard County homes for sale
- Kent County homes for sale
- Montgomery County homes for sale
- Prince George's County homes for sale
- Queen Anne's County homes for sale
- Talbot County homes for sale
Protect your home and budget from life's surprises with an Assurant Home Warranty, backed by a partner that supports you through every step of homeownership. Explore Plans.
©2026 Century 21 Real Estate LLC. All rights reserved. CENTURY 21®, the CENTURY 21 Logo and C21® are service marks owned by Century 21 Real Estate LLC. Century 21 Real Estate LLC fully supports the principles of the Fair Housing Act and the Equal Opportunity Act. Each office is independently owned and operated. Listing information is deemed reliable but not guaranteed accurate.