- Central Volusia homes for sale
- Daytona Beach homes for sale
- De Leon Springs homes for sale
- Debary homes for sale
- DeBary-Orange City homes for sale
- Deland homes for sale
- DeLand Southwest homes for sale
- Deltona homes for sale
- Enterprise homes for sale
- Glencoe homes for sale
- Lake Helen homes for sale
- Lake Mack-Forest Hills homes for sale
- North DeLand homes for sale
- Orange City homes for sale
- Osteen homes for sale
- Pine Lakes homes for sale
- Port Orange homes for sale
- Samsula-Spruce Creek homes for sale
- South Daytona homes for sale
- West DeLand homes for sale
32724, FL - homes for sale
300 of 534 results displayed
- New
 $410,000Active2 beds 2 baths1,820 sq. ft.
1689 Victoria Gardens Drive, DELAND, FL 32724
MLS# O6414512Listed by: BETTER HOMES AND GARDENS REAL ESTATE MANN GLOBAL P - New
 $475,000Active3 beds 2 baths2,078 sq. ft.
386 Lake Charles Road, DELAND, FL 32724
MLS# V4949517Listed by: BEE REALTY CORP - New
 $395,000Active3 beds 2 baths1,992 sq. ft.
1543 Chaucer Court, DELAND, FL 32724
MLS# O6412620Listed by: OPENDOOR BROKERAGE LLC  $385,000Active3 beds 2 baths1,625 sq. ft.
1582 7th Avenue, DELAND, FL 32724
MLS# V4948712Listed by: TRAPP REAL ESTATE INC- Open Sat, 11am to 1pmNew
 $339,000Active3 beds 2 baths1,472 sq. ft.
305 Ridgeway Boulevard, DELAND, FL 32724
MLS# O6414339Listed by: EASY STREET REALTY FLORIDA,INC - New
 $400,000Active3 beds 2 baths1,991 sq. ft.
1409 Sutton Island Drive, DeLand, FL 32724
MLS# 1227257Listed by: ADAMS, CAMERON & CO., REALTORS - New
 $300,000Active4 beds 3 baths1,676 sq. ft.
501 Camelia Lane, DELAND, FL 32724
MLS# V4949502Listed by: GLORY INTL. REAL ESTATE CO - New
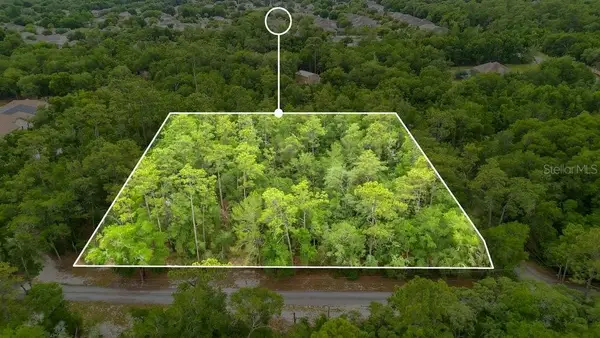
 $200,000Active2.58 Acres
S Blue Lake Avenue, DELAND, FL 32724
MLS# G5113380Listed by: HOMERUN REALTY, LLC - New
 $400,000Active7.05 Acres
1295 S Blue Lake Avenue, DELAND, FL 32724
MLS# G5113374Listed by: HOMERUN REALTY, LLC - New
 $380,000Active3 beds 2 baths2,029 sq. ft.
695 Champions Gate Boulevard, DELAND, FL 32724
MLS# V4949480Listed by: GLORY INTL. REAL ESTATE CO - New
 $19,999Active0.36 Acres
0000 7th Avenue, DELAND, FL 32724
MLS# TB8515959Listed by: A-WARD WINNING REALTY LLC - New
 $331,990Active3 beds 2 baths1,443 sq. ft.
1580 1st Avenue, DeLand, FL 32724
MLS# 1079114Listed by: NEW HOME STAR FLORIDA LLC - Open Mon, 9am to 7pmNew
 $515,000Active5 beds 4 baths3,263 sq. ft.
432 Nowell Loop, DELAND, FL 32724
MLS# O6414008Listed by: OPENDOOR BROKERAGE LLC - New
 $260,000Active3 beds 2 baths1,274 sq. ft.
820 E Wisconsin Avenue, DELAND, FL 32724
MLS# O6414012Listed by: OPENDOOR BROKERAGE LLC - New
 $304,900Active3 beds 2 baths1,308 sq. ft.
312 Albany Avenue, DELAND, FL 32724
MLS# O6413959Listed by: HOMETOWN REALTY GROUP INC - New
 $249,900Active2 beds 2 baths1,257 sq. ft.
840 Shady Branch Trail, DELAND, FL 32724
MLS# V4949416Listed by: WATSON REALTY CORP - New
 $158,000Active2 beds 2 baths1,091 sq. ft.
239 N Hill Avenue #110, DELAND, FL 32724
MLS# O6413021Listed by: KELLER WILLIAMS ADVANTAGE 2 REALTY - New
 $374,900Active3 beds 2 baths1,511 sq. ft.
1395 Riley Circle, DELAND, FL 32724
MLS# V4949439Listed by: BEE REALTY CORP - New
 $425,000Active4 beds 3 baths2,268 sq. ft.
11 S University Circle, DELAND, FL 32724
MLS# A4695939Listed by: SAVVY AVENUE, LLC - New
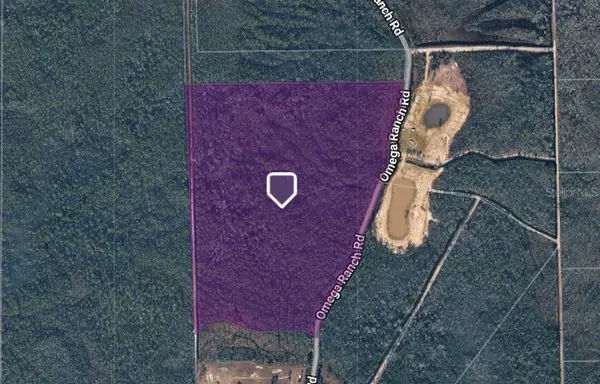 $125,000Active50.76 Acres
1135 Omega Ranch Road #4&5, NEW SMYRNA BEACH, FL 32168
MLS# O6413477Listed by: INVESTOR'S REAL ESTATE LLC - New
 $520,000Active3 beds 2 baths1,725 sq. ft.
2530 E New York Avenue, DELAND, FL 32724
MLS# O6411149Listed by: LPT REALTY, LLC - New
 $365,000Active4 beds 3 baths2,013 sq. ft.
657 Preakness Circle, DELAND, FL 32724
MLS# O6413056Listed by: EXP REALTY LLC - New
 $249,900Active3 beds 1 baths1,000 sq. ft.
226 S Hill Avenue, DELAND, FL 32724
MLS# O6413072Listed by: 407 PROPERTIES - New
 $349,900Active3 beds 2 baths1,530 sq. ft.
3515 Jerathan Drive, DELAND, FL 32724
MLS# O6413371Listed by: REALTY HUB - New
 $409,000Active3 beds 2 baths2,014 sq. ft.
1465 Bent Oaks Boulevard, DELAND, FL 32724
MLS# V4949413Listed by: SOUTHERN EXCLUSIVE REALTY CORP - New
 $432,990Active4 beds 2 baths1,819 sq. ft.
725 Farfields Street, DELAND, FL 32724
MLS# O6413646Listed by: RISEWELL HOMES FLORIDA LLC - New
 $170,000Active31.57 Acres
2429 Old Train Road, Deltona, FL 32738
MLS# B26036635Listed by: ANTHONY E. FITZGERALD - New
 $489,900Active3 beds 2 baths2,319 sq. ft.
111 Point Pleasant Road, DELAND, FL 32724
MLS# V4949427Listed by: ADAMS, CAMERON & CO., REALTORS - New
 $331,990Active3 beds 2 baths1,443 sq. ft.
1691 2nd Avenue, DeLand, FL 32724
MLS# 1078992Listed by: NEW HOME STAR FLORIDA LLC - Open Sat, 1 to 3pmNew
 $374,900Active3 beds 2 baths1,735 sq. ft.
126 Birchmont Drive, DELAND, FL 32724
MLS# V4949377Listed by: COLDWELL BANKER REALTY - New
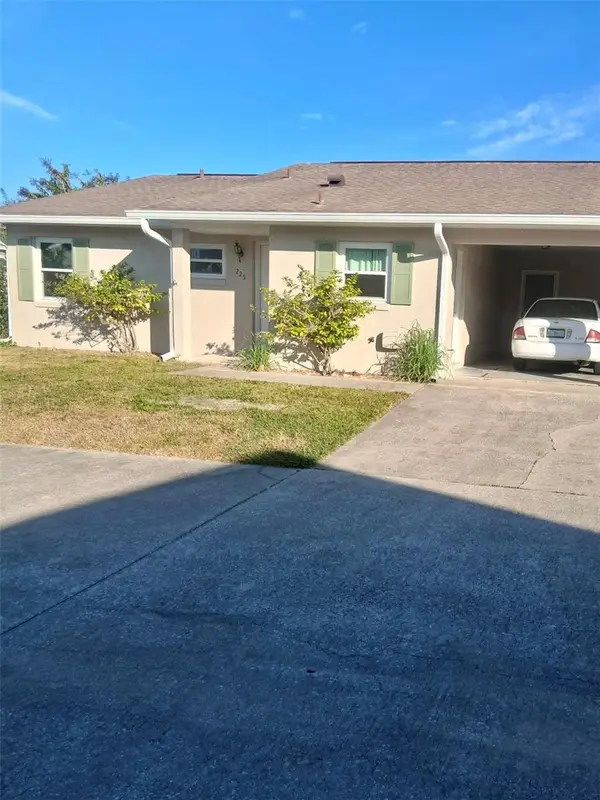 $186,000Active2 beds 2 baths1,063 sq. ft.
225 Pine Bluff Avenue #560, DELAND, FL 32724
MLS# V4949407Listed by: LOKATION - New
 $499,000Active4 beds 3 baths2,820 sq. ft.
122 Los Arbor Drive, DELAND, FL 32724
MLS# O6407218Listed by: REAL BROKER, LLC 
 $19,990Pending0.65 Acres
West Parkway, DELAND, FL 32724
MLS# C7526888Listed by: CENTURY 21 SUNBELT REALTY- New
 $150,000Active2 beds 2 baths660 sq. ft.
335 E Walts Avenue, DELAND, FL 32724
MLS# O6412126Listed by: RE/MAX TOWN & COUNTRY REALTY - New
 $339,900Active3 beds 2 baths1,992 sq. ft.
2334 Dartmouth Road, DELAND, FL 32724
MLS# O6413071Listed by: KGV REALTY GROUP - New
 $599,990Active3 beds 3 baths2,360 sq. ft.
1068 Liliana Drive, DELAND, FL 32724
MLS# W7886344Listed by: MALTBIE REALTY GROUP - New
 $899,900Active4 beds 3 baths3,279 sq. ft.
135 Mills Road, DELAND, FL 32724
MLS# V4949401Listed by: CHARLES RUTENBERG REALTY ORLANDO - New
 $34,000Active0.26 Acres
1465 East Parkway, DELAND, FL 32724
MLS# TB8514497Listed by: LPT REALTY, LLC - Open Sun, 1 to 4pmNew
 $598,000Active3 beds 4 baths3,020 sq. ft.
125 Asterbrooke Drive, DELAND, FL 32724
MLS# V4949390Listed by: REAL BROKER, LLC - New
 $399,900Active4 beds 3 baths2,276 sq. ft.
321 Orchard Hill Street, DELAND, FL 32724
MLS# V4948971Listed by: KELLER WILLIAMS HERITAGE REALTY - New
 $289,000Active3 beds 2 baths1,499 sq. ft.
915 E Michigan Avenue, DELAND, FL 32724
MLS# V4949382Listed by: BEE REALTY CORP - New
 $420,000Active2 beds 2 baths1,849 sq. ft.
560 Adenmore Terrace, DELAND, FL 32724
MLS# O6412483Listed by: SAND DOLLAR REALTY GROUP INC - New
 $359,000Active3 beds 2 baths1,421 sq. ft.
2449 E Lake Drive, DELAND, FL 32724
MLS# R4911351Listed by: CROW ENTERPRISES LLC - New
 $385,000Active3 beds 2 baths1,959 sq. ft.
2360 Dartmouth Road, DELAND, FL 32724
MLS# V4948926Listed by: CARDINAL ROW REAL ESTATE - New
 $320,000Active3 beds 2 baths1,305 sq. ft.
1520 3rd Avenue, DELAND, FL 32724
MLS# V4949359Listed by: RE/MAX ADVANTAGE - New
 $265,000Active3 beds 2 baths1,298 sq. ft.
329 S Osceola Street, DELAND, FL 32724
MLS# O6412249Listed by: LPT REALTY, LLC - New
 $70,000Active0.67 Acres
308 S Blue Lake Avenue, DELAND, FL 32724
MLS# O6412186Listed by: COLDWELL BANKER REALTY - New
 $415,000Active3 beds 2 baths1,847 sq. ft.
203 Heron Point Way, DELAND, FL 32724
MLS# O6412175Listed by: BETTER HOMES AND GARDENS REAL ESTATE MANN GLOBAL P - New
 $649,900Active3 beds 3 baths2,318 sq. ft.
2698 Good Homes Road, DELAND, FL 32724
MLS# V4949346Listed by: WATSON REALTY CORP - New
 $354,900Active3 beds 2 baths1,596 sq. ft.
1800 3rd Avenue, DELAND, FL 32724
MLS# V4949366Listed by: LIVELY REAL ESTATE - New
 $289,999Active3 beds 2 baths1,340 sq. ft.
1509 West Parkway, DELAND, FL 32724
MLS# V4949368Listed by: LA ROSA REALTY CW PROPERTIES L  $340,000Pending3 beds 2 baths2,238 sq. ft.
104 Westcott Lane, DELAND, FL 32724
MLS# O6406537Listed by: BETTER HOMES AND GARDENS REAL ESTATE MANN GLOBAL P- New
 $199,900Active2.5 Acres
1121 Silver Saddle Trail, DELAND, FL 32724
MLS# V4949107Listed by: LPT REALTY, LLC - New
 $385,000Active3 beds 3 baths2,162 sq. ft.
317 Crooked Tree Trail, DELAND, FL 32724
MLS# V4949342Listed by: PALMETTO REALTY - New
 $369,500Active2 beds 2 baths1,625 sq. ft.
708 Montreville Avenue, DeLand, FL 32724
MLS# 1226935Listed by: CHARLES RUTENBERG REALTY ORLANDO LLC - New
 $309,900Active3 beds 2 baths1,367 sq. ft.
2379 8th Avenue, DELAND, FL 32724
MLS# V4949337Listed by: COLDWELL BANKER REALTY - New
 $342,000Active3 beds 2 baths1,617 sq. ft.
354 Camilla Road, DELAND, FL 32724
MLS# V4949291Listed by: BEE REALTY CORP - New
 $398,500Active5 beds 3 baths2,752 sq. ft.
33 Willow Lane, DELAND, FL 32724
MLS# V4949278Listed by: COSTA REALTY PARTNERS LLC - New
 $579,000Active5 beds 4 baths3,309 sq. ft.
1661 Blue Grass Boulevard, DELAND, FL 32724
MLS# O6410116Listed by: SAND DOLLAR REALTY GROUP INC - New
 $560,000Active4 beds 3 baths2,564 sq. ft.
103 Wisteria Lane, DELAND, FL 32724
MLS# O6411423Listed by: KELLER WILLIAMS ADVANTAGE REALTY  $485,000Active5 beds 3 baths2,594 sq. ft.
325 Charles Drive, DELAND, FL 32724
MLS# O6409581Listed by: PETER DIETZEL PROPERTIES LLC $360,000Active3 beds 2 baths1,685 sq. ft.
531 Emily Glen Street, DELAND, FL 32724
MLS# V4949274Listed by: TOWN AND COUNTRY REALTY $29,900Active0.26 Acres
2405 Central Parkway, DELAND, FL 32724
MLS# V4949284Listed by: SOUTHERN EXCLUSIVE REALTY CORP $295,000Active6.64 Acres
Hwy 92 At Big John Rd, DELAND, FL 32724
MLS# O6411118Listed by: RE/MAX TOWN CENTRE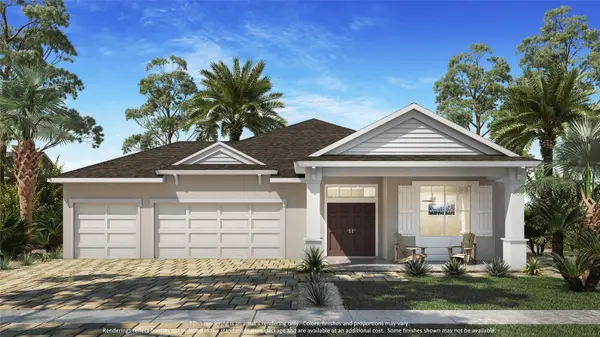 $597,195Active4 beds 3 baths2,405 sq. ft.
938 Megano Boulevard, DELAND, FL 32724
MLS# FC318797Listed by: PAYTAS-MATHER REAL ESTATE SERV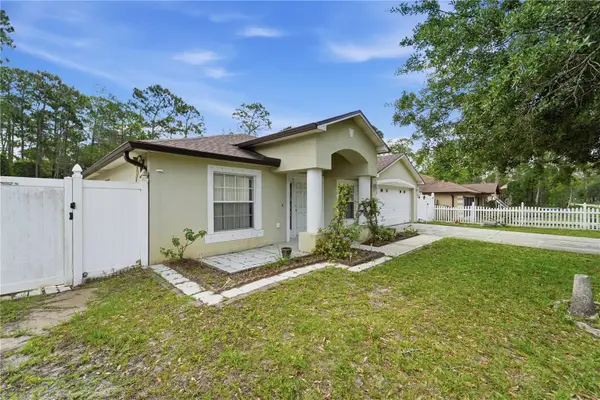 $320,000Pending3 beds 2 baths1,655 sq. ft.
1675 10th Avenue, DELAND, FL 32724
MLS# V4949273Listed by: CHARLES RUTENBERG REALTY ORLANDO $407,900Active4 beds 3 baths2,000 sq. ft.
137 S Chandler Avenue, DELAND, FL 32724
MLS# O6410647Listed by: LPT REALTY, LLC $819,000Active4 beds 2 baths2,577 sq. ft.
1010 Geryl Way, DELAND, FL 32724
MLS# V4949127Listed by: LPT REALTY, LLC $249,000Pending2 beds 1 baths1,196 sq. ft.
240 Miller Road, DeLand, FL 32724
MLS# 1226817Listed by: COLLADO REAL ESTATE $369,000Active3 beds 2 baths1,685 sq. ft.
505 Lady Irelyn Court, DELAND, FL 32724
MLS# TB8511981Listed by: HOME SEARCH REALTY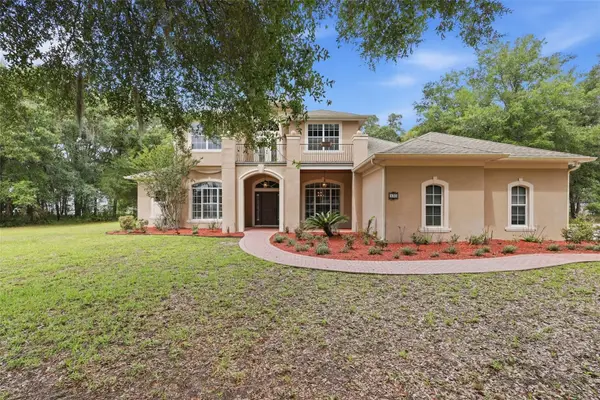 $945,000Active4 beds 4 baths3,331 sq. ft.
530 N Blue Lake Avenue, DELAND, FL 32724
MLS# V4949136Listed by: TOWN AND COUNTRY REALTY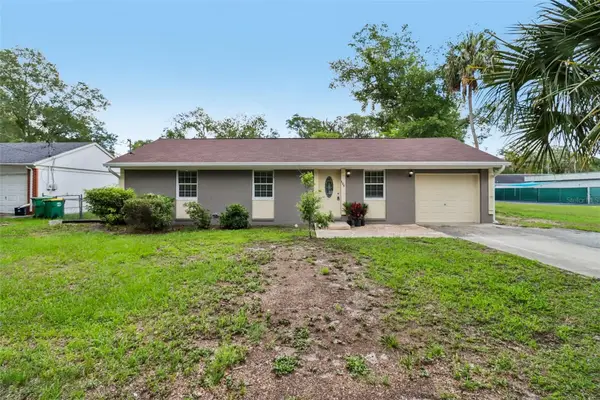 $275,000Active3 beds 2 baths1,050 sq. ft.
105 N Fairfax Avenue, DELAND, FL 32724
MLS# NS1088316Listed by: RE/MAX SIGNATURE $345,000Active3 beds 2 baths1,357 sq. ft.
814 E Rich Avenue, DeLand, FL 32724
MLS# 1226784Listed by: OCEANS LUXURY REALTY FULL SERVICE LLC $319,900Active3 beds 2 baths1,731 sq. ft.
611 N Garfield Avenue, DELAND, FL 32724
MLS# V4949258Listed by: TOWN AND COUNTRY REALTY $529,000Active4 beds 4 baths3,138 sq. ft.
118 Victoria Oaks Boulevard, DELAND, FL 32724
MLS# V4949195Listed by: WATSON REALTY CORP $625,000Active4 beds 3 baths2,872 sq. ft.
807 Bay Tree Circle, DELAND, FL 32724
MLS# V4949202Listed by: GREENE REALTY OF FLORIDA LLC $539,900Active5 beds 4 baths3,667 sq. ft.
202 Victoria Trails Boulevard, DELAND, FL 32724
MLS# V4949256Listed by: CENTURY 21 MCBRIDE REALTY GROUP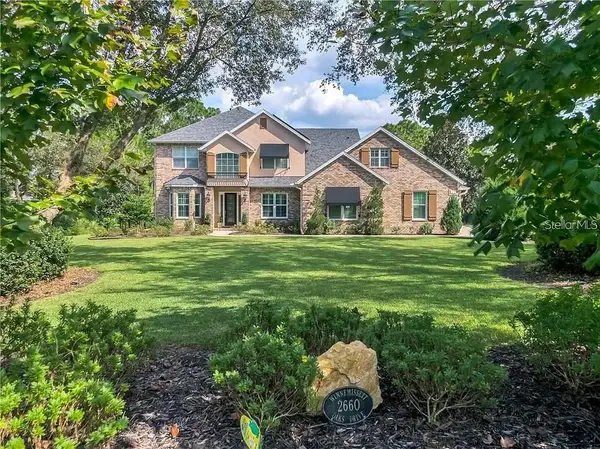 $1,266,700Active6 beds 5 baths4,814 sq. ft.
2660 Winnemissett Oaks Drive, DELAND, FL 32724
MLS# V4949235Listed by: COSTA REALTY PARTNERS LLC $144,900Active1 beds 1 baths706 sq. ft.
712 E Arizona Avenue #A, DELAND, FL 32724
MLS# O6408844Listed by: DEVA REALTY LLC $384,900Active4 beds 2 baths1,996 sq. ft.
2106 Havasu Falls Drive, DELAND, FL 32724
MLS# O6409164Listed by: LPT REALTY LLC $649,095Active6 beds 5 baths3,932 sq. ft.
120 Los Arbor Drive, DELAND, FL 32724
MLS# V4949227Listed by: COLDWELL BANKER COAST REALTY $35,000Active0.26 Acres
East Parkway, DELAND, FL 32724
MLS# O6408648Listed by: KELLER WILLIAMS ADVANTAGE REALTY $597,000Active3 beds 3 baths2,804 sq. ft.
261 Old Moss Circle, DeLand, FL 32724
MLS# 1226675Listed by: SWANN REAL ESTATE, INC $35,000Active0.58 Acres
E Intl Speedway Boulevard, DELAND, FL 32724
MLS# V4949207Listed by: TOWN AND COUNTRY REALTY $415,000Active4 beds 3 baths2,295 sq. ft.
213 Victoria Trails Boulevard, DELAND, FL 32724
MLS# O6409664Listed by: KGV REALTY GROUP $25,000Active0.25 Acres
212 Plumosus Court, DELAND, FL 32724
MLS# W7885954Listed by: LISTWITHFREEDOM.COM $354,990Active3 beds 2 baths1,328 sq. ft.
909 E Ohio Avenue, DELAND, FL 32724
MLS# O6409600Listed by: DR HORTON REALTY OF CENTRAL FLORIDA LLC $524,990Active3 beds 3 baths2,289 sq. ft.
1291 Savoy Lane, DELAND, FL 32724
MLS# W7885945Listed by: MALTBIE REALTY GROUP $254,900Active2 beds 1 baths1,064 sq. ft.
219 Kensington Avenue, DELAND, FL 32724
MLS# V4948664Listed by: TOWN AND COUNTRY REALTY $575,000Active3 beds 3 baths1,890 sq. ft.
1221 SW Stakes St, Other, FL 34266
MLS# A11953159Listed by: ONE STOP REALTY $550,000Pending4 beds 3 baths2,578 sq. ft.
1405 Covered Bridge Road, DELAND, FL 32724
MLS# V4949091Listed by: BEE REALTY CORP $320,000Active3 beds 2 baths1,825 sq. ft.
1520 Newport Avenue, DELAND, FL 32724
MLS# NS1088263Listed by: REDFIN CORPORATION $49,900Active0.26 Acres
2873 Laurel Road, DELAND, FL 32724
MLS# V4949156Listed by: BEE REALTY CORP $539,990Active3 beds 2 baths1,968 sq. ft.
1017 Liliana Drive, DELAND, FL 32724
MLS# W7885901Listed by: MALTBIE REALTY GROUP $449,900Active4 beds 3 baths2,357 sq. ft.
7016 Lanier Falls Road, DELAND, FL 32724
MLS# O6407504Listed by: EXP REALTY LLC $295,000Active3 beds 2 baths1,560 sq. ft.
985 10th Avenue, DELAND, FL 32724
MLS# G5112288Listed by: COLDWELL BANKER VANGUARD EDGE $268,000Pending2 beds 2 baths1,299 sq. ft.
803 Wynbrook Lane, DELAND, FL 32724
MLS# V4949145Listed by: GLORY INTL. REAL ESTATE CO $11,500Active0.09 Acres
7th Avenue, DELAND, FL 32724
MLS# R4911110Listed by: FLORIDA LAND REALTY, INC. $349,900Active3 beds 2 baths1,509 sq. ft.
1537 Chelsea Manor Circle, DELAND, FL 32724
MLS# V4949149Listed by: SWANN REAL ESTATE INC $315,000Active3 beds 2 baths1,371 sq. ft.
174 Dover Ln, DELAND, FL 32724
MLS# V4949133Listed by: COSTA REALTY PARTNERS LLC $314,000Active3 beds 2 baths1,500 sq. ft.
28 Ramblewood Trail, DELAND, FL 32724
MLS# V4949140Listed by: ADAMS, CAMERON & CO., REALTORS $285,000Active3 beds 2 baths1,362 sq. ft.
1141 8th Avenue, DELAND, FL 32724
MLS# V4949062Listed by: LANE REALTY SERVICES, LLC $409,990Active4 beds 3 baths2,110 sq. ft.
5075 Grand Teton Court, DELAND, FL 32724
MLS# O6408571Listed by: LPT REALTY, LLC $385,000Active3 beds 3 baths1,928 sq. ft.
239 W Tarrington Drive, DELAND, FL 32724
MLS# V4949132Listed by: ADAMS, CAMERON & CO., REALTORS $610,379Active6 beds 5 baths3,734 sq. ft.
756 Farfields Street, DELAND, FL 32724
MLS# O6408545Listed by: TRINITY FAMILY BUILDERS LLC $449,000Pending4 beds 3 baths2,380 sq. ft.
2336 Oxmoor Drive, DELAND, FL 32724
MLS# V4949097Listed by: BEE REALTY CORP $339,000Active3 beds 2 baths1,559 sq. ft.
812 Benton Lake Drive S, DELAND, FL 32724
MLS# V4949126Listed by: COLDWELL BANKER REALTY $389,900Active3 beds 2 baths1,585 sq. ft.
614 John Thomas Avenue, DeLand, FL 32724
MLS# 1226486Listed by: RE/MAX SIGNATURE $339,900Active3 beds 2 baths1,540 sq. ft.
1885 9th Avenue, DELAND, FL 32724
MLS# V4949124Listed by: ADAMS, CAMERON & CO., REALTORS $484,900Active4 beds 3 baths2,750 sq. ft.
51 Virginia Avenue, DELAND, FL 32724
MLS# V4949048Listed by: KEMP REALTY GROUP $130,000Pending3 beds 2 baths854 sq. ft.
646 June Terrace, DELAND, FL 32724
MLS# V4949054Listed by: SWANN REAL ESTATE INC $130,000Active3 beds 2 baths854 sq. ft.
654 June Terrace, DELAND, FL 32724
MLS# V4949057Listed by: SWANN REAL ESTATE INC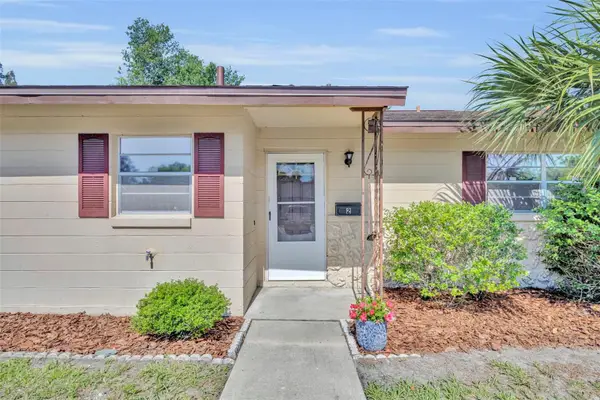 $188,000Active2 beds 2 baths1,043 sq. ft.
2 Villa Villar Court #20, DELAND, FL 32724
MLS# O6408242Listed by: PRATT REALTY INC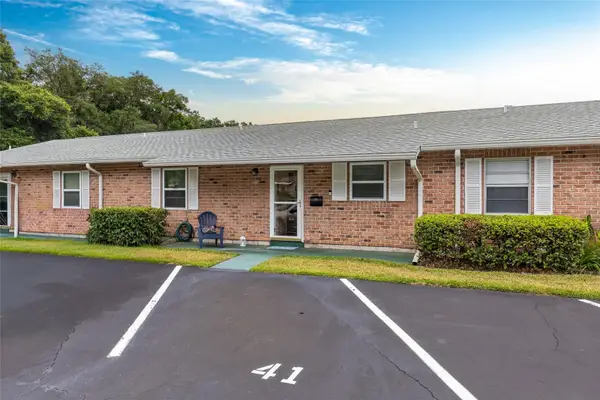 $135,000Active2 beds 2 baths930 sq. ft.
41 Fairway Court #41, DELAND, FL 32724
MLS# O6407861Listed by: PREMIUM PROPERTIES R.E SERVICE $485,000Active3 beds 3 baths2,024 sq. ft.
903 Victoria Hills Drive S, DELAND, FL 32724
MLS# V4949031Listed by: LPT REALTY, LLC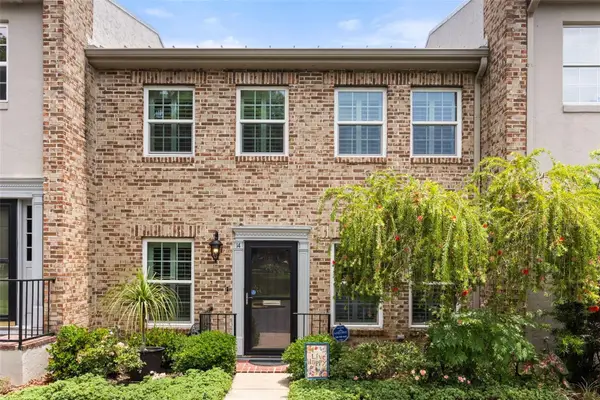 $269,000Pending3 beds 3 baths1,536 sq. ft.
117 N Garfield Avenue #14, DELAND, FL 32724
MLS# O6407318Listed by: KELLER WILLIAMS WINTER PARK $389,900Active4 beds 2 baths1,850 sq. ft.
2209 Canopy Terrace Boulevard, DELAND, FL 32724
MLS# O6405860Listed by: REAL BROKER, LLC $54,000Active0.26 Acres
7th Avenue, DELAND, FL 32724
MLS# V4949077Listed by: EXP REALTY LLC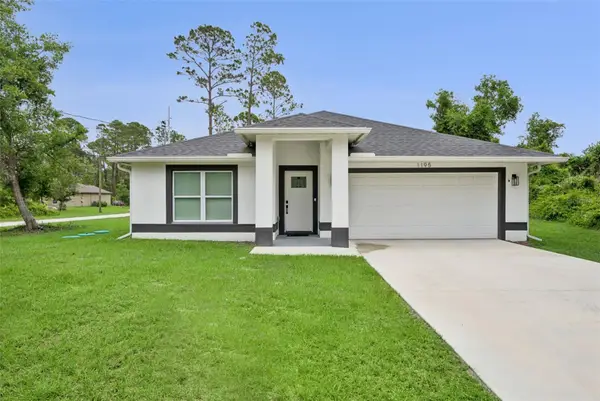 $339,900Active3 beds 2 baths1,593 sq. ft.
1195 8th Avenue, DELAND, FL 32724
MLS# O6405920Listed by: LPT REALTY, LLC $470,000Pending4 beds 3 baths2,271 sq. ft.
1226 Heron Point Way, DELAND, FL 32724
MLS# V4949080Listed by: CORAL C'S REALTY LLC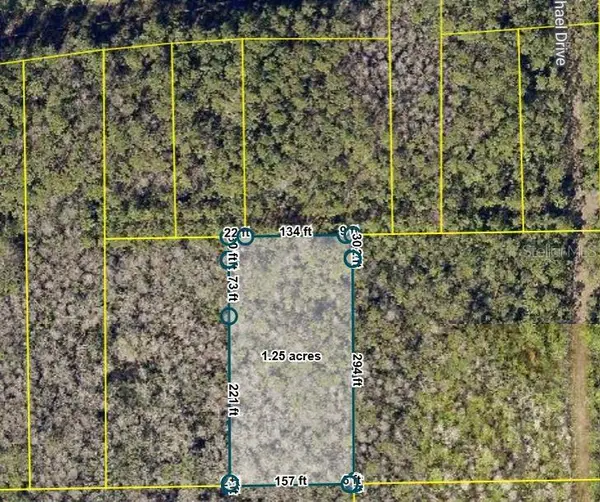 $45,000Active1.25 Acres
Pid 711702030050 No Street, DELAND, FL 32724
MLS# O6396833Listed by: EXP REALTY LLC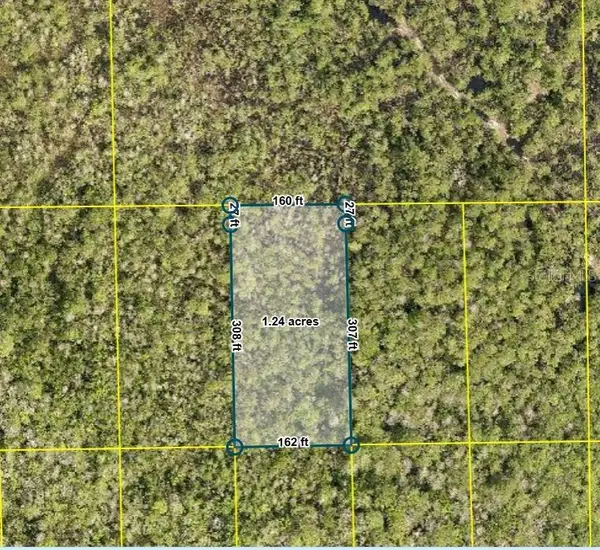 $27,000Active1.25 Acres
Pid 710801150080 No Street, DELAND, FL 32724
MLS# O6397959Listed by: EXP REALTY LLC $27,000Active1.25 Acres
Pid 710801150230 No Street, DELAND, FL 32724
MLS# O6398358Listed by: EXP REALTY LLC $27,000Active1.25 Acres
Pid 710801150090 No Street, DELAND, FL 32724
MLS# O6398363Listed by: EXP REALTY LLC $27,000Active1.25 Acres
Pid 710801150220 No Street, DELAND, FL 32724
MLS# O6398387Listed by: EXP REALTY LLC $399,900Active4 beds 3 baths2,225 sq. ft.
720 E Victoria Trails Boulevard, DELAND, FL 32724
MLS# V4949067Listed by: FAMILY REALTY OF CENTRAL FLA $294,500Pending3 beds 2 baths1,550 sq. ft.
202 Sandspur Lane, DELAND, FL 32724
MLS# V4949020Listed by: COSTA REALTY PARTNERS LLC $399,900Pending2 beds 2 baths1,928 sq. ft.
1122 Gardenshire Lane, DELAND, FL 32724
MLS# O6406650Listed by: LOGAN LAND & HOMES, INC. $335,000Pending3 beds 2 baths1,563 sq. ft.
405 Secluded Oaks Trail, DELAND, FL 32724
MLS# O6406994Listed by: EXP REALTY LLC $319,900Active4 beds 3 baths2,262 sq. ft.
2585 Vista Park Drive, DELAND, FL 32724
MLS# V4949044Listed by: FAMILY REALTY OF CENTRAL FLA $530,000Active3 beds 3 baths2,754 sq. ft.
607 Victoria Hills Drive, DELAND, FL 32724
MLS# V4948693Listed by: ADAMS, CAMERON & CO., REALTORS $195,000Active3 beds 2 baths1,152 sq. ft.
4128 Woodland Circle, DELAND, FL 32724
MLS# V4948973Listed by: LPT REALTY LLC $45,000Active0.26 Acres
1340 East Parkway, DELAND, FL 32724
MLS# O6405955Listed by: LPT REALTY, LLC $45,000Active0.26 Acres
1490 10th Avenue, DELAND, FL 32724
MLS# O6406105Listed by: LPT REALTY, LLC $45,000Pending0.26 Acres
1704 7th Avenue, DELAND, FL 32724
MLS# O6406113Listed by: LPT REALTY, LLC $45,000Active0.31 Acres
1935 7th Avenue, DELAND, FL 32724
MLS# O6406116Listed by: LPT REALTY, LLC $45,000Active0.26 Acres
2155 5th Avenue, DELAND, FL 32724
MLS# O6406119Listed by: LPT REALTY, LLC $65,000Active0.4 Acres
W Lake Drive, DELAND, FL 32724
MLS# O6406128Listed by: LPT REALTY, LLC $45,000Active0.26 Acres
1001 10th Avenue, DELAND, FL 32724
MLS# O6405614Listed by: LPT REALTY, LLC $45,000Active0.26 Acres
1201 10th Avenue, DELAND, FL 32724
MLS# O6405929Listed by: LPT REALTY, LLC $465,000Pending5 beds 5 baths2,616 sq. ft.
138 N Kentucky Avenue, DeLand, FL 32724
MLS# 1226074Listed by: KGV REALTY GROUP $720,000Active3 beds 2 baths2,662 sq. ft.
2514 Krinklewood Drive, DELAND, FL 32724
MLS# V4949010Listed by: LANE REALTY SERVICES, LLC $324,900Pending3 beds 2 baths1,325 sq. ft.
3427 Wild Ocelot Court, DELAND, FL 32724
MLS# O6406602Listed by: COLDWELL BANKER REALTY $479,000Active3 beds 2 baths1,724 sq. ft.
819 Liliana Drive, DELAND, FL 32724
MLS# O6400873Listed by: LPT REALTY LLC $150,000Pending2 beds 2 baths1,216 sq. ft.
1717 Pine Avenue, DELAND, FL 32724
MLS# V4948924Listed by: LPT REALTY, LLC $559,000Active4 beds 3 baths2,722 sq. ft.
801 Victoria Hills Drive, DeLand, FL 32724
MLS# 1226172Listed by: COLDWELL BANKER COAST REALTY $395,999Active4 beds 3 baths2,656 sq. ft.
2307 Kennington Cove, DELAND, FL 32724
MLS# O6405787Listed by: WYNNMORE REALTY LLC $199,900Pending3 beds 2 baths1,040 sq. ft.
713 Laisy Drive, DELAND, FL 32724
MLS# TB8496476Listed by: NHR BROKERAGE LLC $29,500Pending0.26 Acres
0 Dahlia Rd Road, Deland, FL 32724
MLS# B26025424Listed by: DIVITO REAL ESTATE GROUP $339,000Pending3 beds 2 baths1,408 sq. ft.
2065 9th Avenue, DELAND, FL 32724
MLS# O6405306Listed by: LPT REALTY, LLC $34,999Active0 Acres
2124 East Pwky, Deland, FL 32724
MLS# A12014647Listed by: SUNLAND REAL ESTATE, LLC. $489,000Active4 beds 3 baths2,651 sq. ft.
423 Victoria Hills Drive, DELAND, FL 32724
MLS# V4948883Listed by: LIVELY REAL ESTATE $419,000Pending3 beds 2 baths1,784 sq. ft.
354 Churchill Downs Boulevard, DELAND, FL 32724
MLS# O6404368Listed by: EXP REALTY LLC $565,000Active4 beds 3 baths3,070 sq. ft.
337 Orchard Hill Street, DELAND, FL 32724
MLS# V4948911Listed by: COLDWELL BANKER REALTY $33,000Active0.25 Acres
0 E Pkwy Parkway, DeLand, FL 32724
MLS# 1226102Listed by: ALL READY HOME LLC $240,000Pending3 beds 1 baths1,000 sq. ft.
516 Land O Lakes Ct, DELAND, FL 32724
MLS# V4948917Listed by: CENTURY 21 MCBRIDE REALTY GROUP $214,900Active2 beds 1 baths754 sq. ft.
810 S Massachusetts Avenue, DELAND, FL 32724
MLS# V4948904Listed by: DASH REAL ESTATE COMPANY $292,500Pending3 beds 2 baths1,133 sq. ft.
1341 Heather Glen Drive, DELAND, FL 32724
MLS# O6404432Listed by: COLDWELL BANKER REALTY $45,000Active0.24 Acres
141 Evergreen Terrace, DeLand, FL 32724
MLS# 1226067Listed by: ALL READY HOME LLC $625,000Active3 beds 4 baths3,592 sq. ft.
236 Asterbrooke Drive, DELAND, FL 32724
MLS# V4948861Listed by: KELLER WILLIAMS HERITAGE REALTY $478,990Active4 beds 4 baths2,560 sq. ft.
704 Farfields Street, DELAND, FL 32724
MLS# O6404836Listed by: RISEWELL HOMES FLORIDA LLC $374,900Active2 beds 2 baths1,512 sq. ft.
1682 Victoria Gardens Drive, DELAND, FL 32724
MLS# V4948878Listed by: LIVELY REAL ESTATE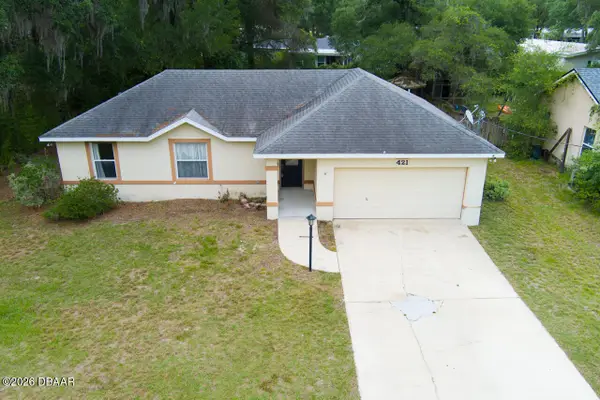 $230,000Pending2 beds 2 baths1,660 sq. ft.
421 S Blue Lake Avenue, DeLand, FL 32724
MLS# 1225998Listed by: KELLER WILLIAMS REALTY FLORIDA PARTNERS $319,900Active3 beds 2 baths1,264 sq. ft.
1460 11th Avenue, DELAND, FL 32724
MLS# O6394816Listed by: STAR BAY REALTY CORP. $429,900Active4 beds 2 baths2,111 sq. ft.
525 Heron Point Way, DeLand, FL 32724
MLS# 1225940Listed by: LPT REALTY, LLC $810,000Active4 beds 4 baths3,653 sq. ft.
106 Callaway Court, DELAND, FL 32724
MLS# V4948818Listed by: LPT REALTY, LLC $399,000Pending4 beds 3 baths2,680 sq. ft.
2042 1st Avenue, DELAND, FL 32724
MLS# V4948848Listed by: LPT REALTY, LLC $289,900Pending3 beds 2 baths1,248 sq. ft.
2203 Orange Street, DELAND, FL 32724
MLS# O6403985Listed by: SPECTRUM PROPERTY GROUP LLC- Open Fri, 2 to 5pm
 $649,900Active4 beds 5 baths3,568 sq. ft.
1022 Victoria Hills Drive S, DELAND, FL 32724
MLS# V4948639Listed by: BEE REALTY CORP  $545,000Active5 beds 3 baths2,175 sq. ft.
1400 Bent Oaks Boulevard, DELAND, FL 32724
MLS# O6402631Listed by: KELLER WILLIAMS WINTER PARK $615,000Active5 beds 4 baths3,107 sq. ft.
611 Brookfield Terrace, DELAND, FL 32724
MLS# O6402619Listed by: RE/MAX CENTRAL REALTY $327,000Active3 beds 2 baths1,342 sq. ft.
1367 Hensley Drive, DELAND, FL 32724
MLS# R4911169Listed by: LAWHUN ENTERPRISES IV, LLC DBA: FLORIDA REALTY INVESTMENTS IV- Open Sat, 1 to 3pm
 $340,000Active3 beds 3 baths1,707 sq. ft.
500 E Euclid Avenue, DELAND, FL 32724
MLS# S5148925Listed by: CENTURY 21 EDGE - Open Sat, 10am to 12pm
 $300,000Active3 beds 2 baths1,582 sq. ft.
520 S Kentucky Avenue, DELAND, FL 32724
MLS# S5148926Listed by: CENTURY 21 EDGE  $299,000Active3 beds 2 baths1,198 sq. ft.
1845 6th Avenue, DELAND, FL 32724
MLS# V4948555Listed by: LPT REALTY, LLC $430,000Active2 beds 2 baths1,928 sq. ft.
1634 Victoria Gardens Drive, DELAND, FL 32724
MLS# O6386718Listed by: LPT REALTY, LLC $125,000Active6 beds 4 baths2,076 sq. ft.
2900 State Road 11, DELAND, FL 32724
MLS# V4948801Listed by: LPT REALTY, LLC $369,900Active3 beds 3 baths1,832 sq. ft.
2224 Canopy Terrace Boulevard, DELAND, FL 32724
MLS# O6402006Listed by: KELLER WILLIAMS REALTY AT THE PARKS $599,999Active1.21 Acres
Cutbank Trail, Deland, FL FL 32724
MLS# A12009356Listed by: REIGN REALTY LLC $389,000Active3 beds 3 baths2,882 sq. ft.
684 Stratford Drive, DELAND, FL 32724
MLS# O6402825Listed by: FLORIDA HOMES REALTY & MORTGAG $445,000Active3 beds 2 baths2,144 sq. ft.
2207 Poinsettia Lane, DeLand, FL 32724
MLS# 1072617Listed by: LANDSHARK REALTY $445,000Active3 beds 2 baths2,144 sq. ft.
2207 Poinsettia Lane, DELAND, FL 32724
MLS# V4948588Listed by: LANDSHARK REALTY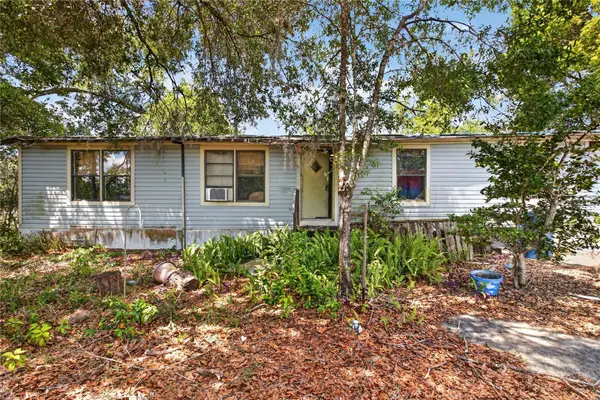 $75,000Active4 beds 2 baths1,584 sq. ft.
2632 Frances Drive, DELAND, FL 32724
MLS# O6402340Listed by: EXIT REALTY PREMIER LEGACY $368,500Pending4 beds 2 baths1,580 sq. ft.
2132 Canopy Terrace Boulevard, DELAND, FL 32724
MLS# V4948706Listed by: ADAMS, CAMERON & CO., REALTORS $17,000Active0.26 Acres
9th Avenue, DELAND, FL 32724
MLS# O6401063Listed by: LIFESTYLE INTERNATIONAL REALTY $379,900Active4 beds 2 baths1,842 sq. ft.
107 Park Hurst Lane, DELAND, FL 32724
MLS# O6402023Listed by: GATE PROPERTIES & MANAGEMENT INC $289,900Active2 beds 3 baths1,536 sq. ft.
224 Woodhouse Lane, DELAND, FL 32724
MLS# V4948709Listed by: CHARLES RUTENBERG REALTY ORLANDO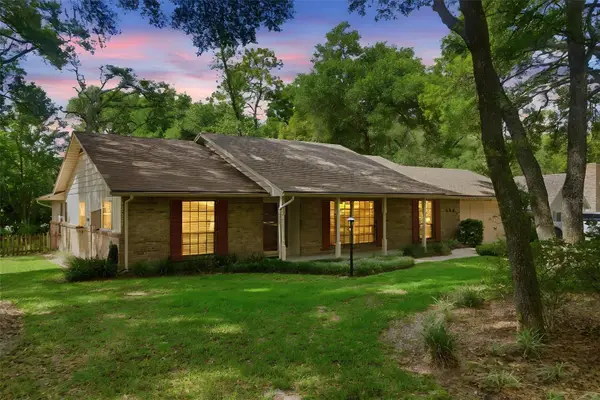 $349,900Pending3 beds 2 baths1,814 sq. ft.
544 Black Ironwood Drive, DELAND, FL 32724
MLS# V4948715Listed by: CHARLES RUTENBERG REALTY ORLANDO $339,000Active3 beds 2 baths1,698 sq. ft.
1031 E Walts Avenue, DeLand, FL 32724
MLS# 1225631Listed by: COLDWELL BANKER PREMIER PROPERTIES $252,900Pending3 beds 2 baths1,204 sq. ft.
112 Hurst Court, DELAND, FL 32724
MLS# O6400543Listed by: CHARLES RUTENBERG REALTY ORLANDO $524,000Active4 beds 3 baths2,108 sq. ft.
410 E Freesia Court, DELAND, FL 32724
MLS# V4948578Listed by: COLLADO REAL ESTATE $459,000Active5 beds 3 baths2,906 sq. ft.
831 Oak Hollow Loop, DELAND, FL 32724
MLS# V4948653Listed by: LANE REALTY SERVICES, LLC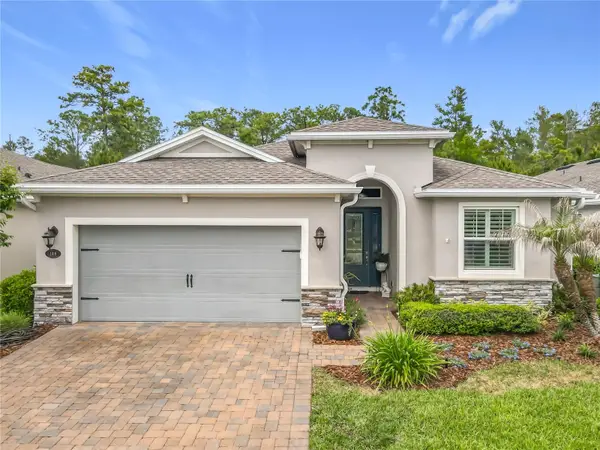 $569,000Active3 beds 3 baths2,185 sq. ft.
1169 Avery Meadows Way, DELAND, FL 32724
MLS# O6401168Listed by: FLORIDA REALTY INVESTMENTS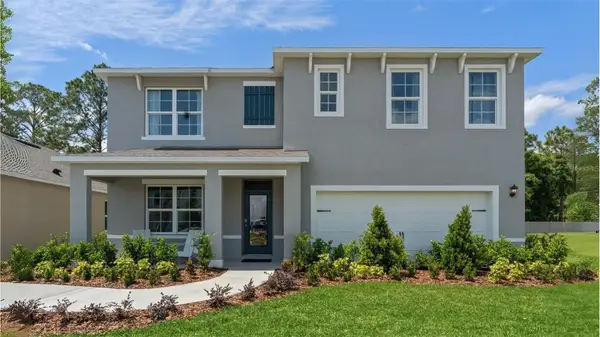 $444,990Active5 beds 3 baths2,601 sq. ft.
905 E Ohio Avenue, DELAND, FL 32724
MLS# O6401330Listed by: DR HORTON REALTY OF CENTRAL FLORIDA LLC $386,990Pending4 beds 2 baths1,828 sq. ft.
901 E Ohio Avenue, DeLand, FL 32724
MLS# 1225542Listed by: D R HORTON REALTY OF CENTRAL FLORIDA $410,000Pending4 beds 2 baths2,292 sq. ft.
129 Jacobs Landing Court, DELAND, FL 32724
MLS# V4948502Listed by: BEE REALTY CORP $550,000Active3 beds 2 baths2,001 sq. ft.
103 Old Moss Circle, DELAND, FL 32724
MLS# V4948545Listed by: BEE REALTY CORP $479,900Pending3 beds 3 baths2,010 sq. ft.
1724 Lake Reserve Drive, DELAND, FL 32724
MLS# TB8499065Listed by: FLAT FEE MLS REALTY $354,000Pending3 beds 2 baths1,666 sq. ft.
2025 Larchmont Drive, DELAND, FL 32724
MLS# V4948558Listed by: WATSON REALTY CORP $479,900Active2 beds 2 baths1,928 sq. ft.
1157 Avery Meadows Way, DELAND, FL 32724
MLS# O6394993Listed by: COLDWELL BANKER REALTY $265,000Active3 beds 1 baths1,020 sq. ft.
1650 11th Avenue, DELAND, FL 32724
MLS# V4948587Listed by: GOLDEN SAPPHIRE REAL ESTATE LLC $155,000Active2 beds 2 baths979 sq. ft.
714 E Minnesota Avenue #B, DELAND, FL 32724
MLS# O6399371Listed by: LIFESTYLE INTERNATIONAL REALTY $499,900Active3 beds 3 baths1,974 sq. ft.
1241 Trident Loop, DELAND, FL 32724
MLS# O6398675Listed by: NEXTHOME SUNSHINE REALTY $214,900Active3 beds 2 baths1,591 sq. ft.
113 Palm Court, Painesville, OH 44077
MLS# 5201084Listed by: RE/MAX CROSSROADS PROPERTIES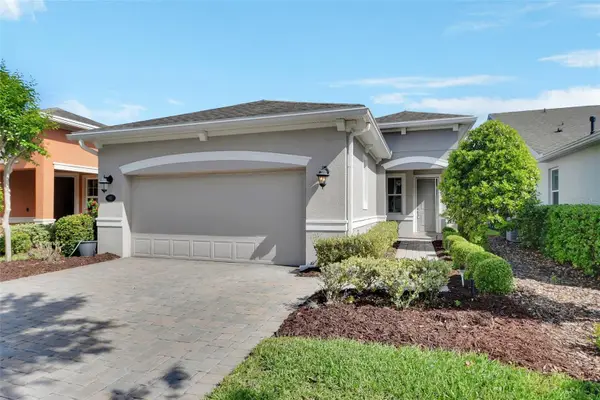 $358,900Pending2 beds 2 baths1,512 sq. ft.
423 Tisbury Court, DELAND, FL 32724
MLS# V4948489Listed by: KEMP REALTY GROUP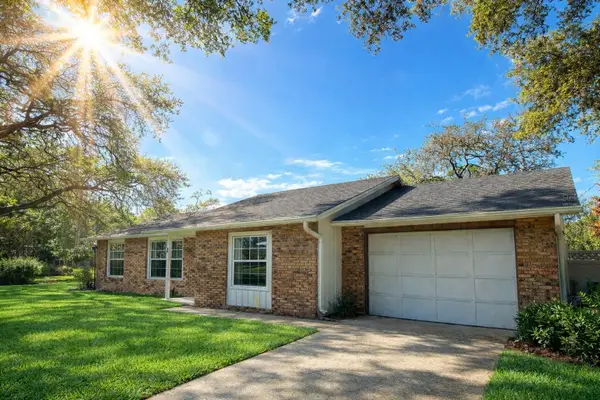 $325,000Active3 beds 2 baths1,159 sq. ft.
700 Swarthmore Road, DELAND, FL 32724
MLS# NS1087977Listed by: HOME & FAMILY REAL ESTATE & PROPERTY MANAGEMENT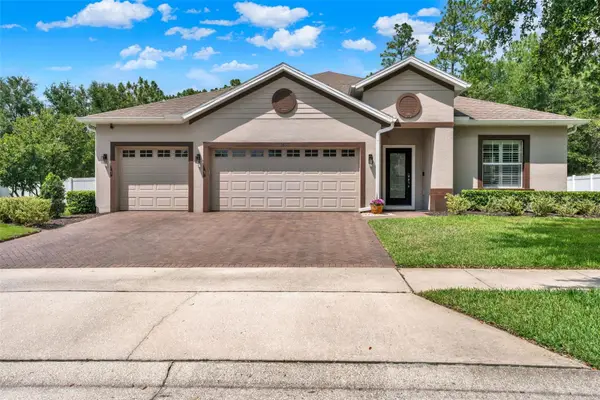 $499,000Active4 beds 3 baths2,804 sq. ft.
1692 Blue Grass Boulevard, DELAND, FL 32724
MLS# O6398951Listed by: PREMIER SOTHEBYS INT'L REALTY $230,000Active2 beds 1 baths1,069 sq. ft.
719 E Georgia Avenue, DELAND, FL 32724
MLS# V4948553Listed by: COLDWELL BANKER REALTY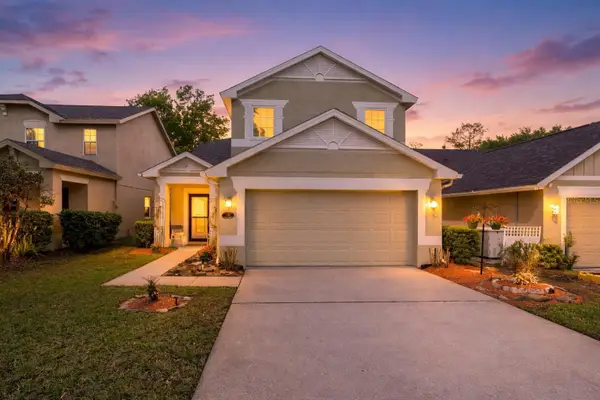 $390,000Active4 beds 3 baths2,068 sq. ft.
105 Littleton Circle, DELAND, FL 32724
MLS# V4948483Listed by: CHARLES RUTENBERG REALTY ORLANDO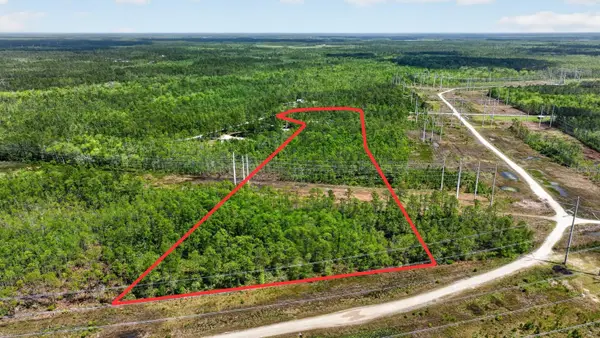 $220,000Active10.23 Acres
330 Damascus Road, DELAND, FL 32724
MLS# FC317716Listed by: KELLER WILLIAMS RLTY FL. PARTN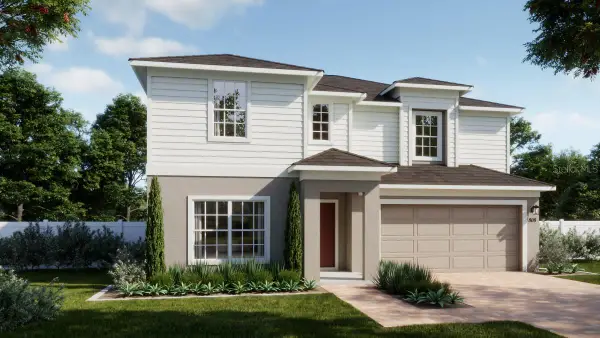 $447,990Pending4 beds 3 baths2,560 sq. ft.
721 Farfields Street, DELAND, FL 32724
MLS# O6398767Listed by: RISEWELL HOMES FLORIDA LLC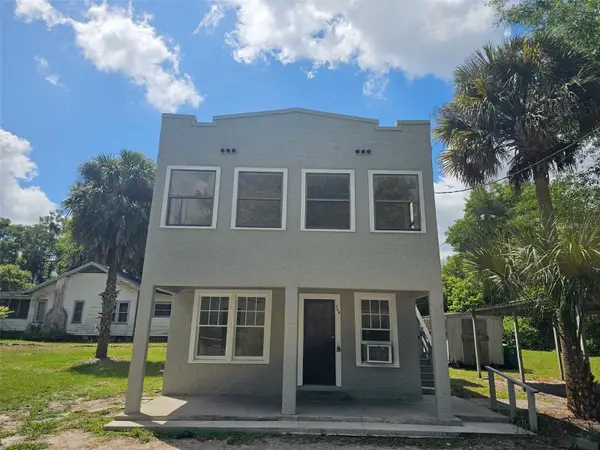 $259,900Pending4 beds 2 baths1,443 sq. ft.
738 Wood Street, DELAND, FL 32724
MLS# O6399051Listed by: BLACK DOG REAL ESTATE ADVISORS, INC.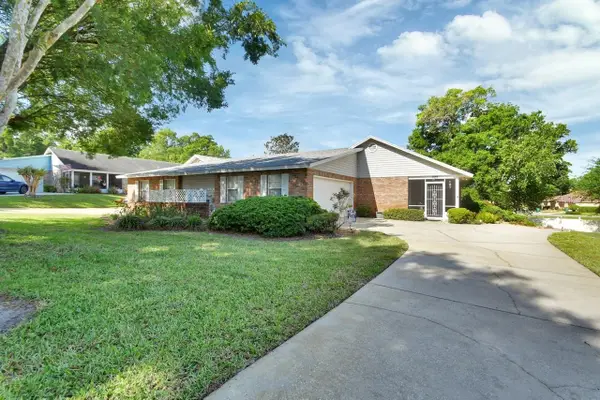 $320,000Active3 beds 2 baths1,953 sq. ft.
2520 S Glen Eagles Drive, DELAND, FL 32724
MLS# V4948478Listed by: WATSON REALTY CORP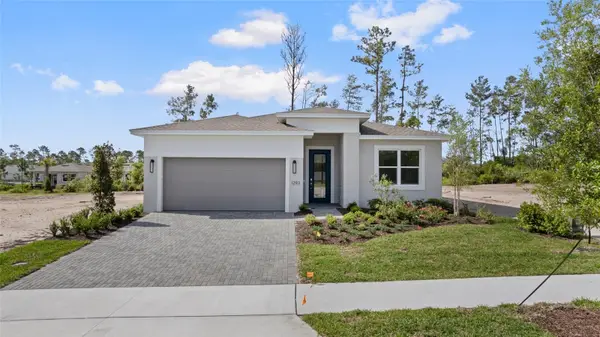 $579,990Active2 beds 2 baths2,029 sq. ft.
1293 Twin Farms Court, DELAND, FL 32724
MLS# W7884833Listed by: MALTBIE REALTY GROUP $459,990Active4 beds 3 baths2,105 sq. ft.
744 Farfields Street, DELAND, FL 32724
MLS# O6385197Listed by: RISEWELL HOMES FLORIDA LLC $400,000Pending4 beds 2 baths1,819 sq. ft.
717 Farfields Street, DELAND, FL 32724
MLS# O6385834Listed by: RISEWELL HOMES FLORIDA LLC $349,900Pending3 beds 2 baths1,792 sq. ft.
2355 Regency Park Drive, DELAND, FL 32724
MLS# V4948476Listed by: WATSON REALTY CORP $610,000Pending4 beds 3 baths3,068 sq. ft.
735 Evening Star Lane, DELAND, FL 32724
MLS# V4948457Listed by: CHARLES RUTENBERG REALTY ORLANDO $214,900Active3 beds 2 baths1,170 sq. ft.
373 Dolores Boulevard, DELAND, FL 32724
MLS# V4948467Listed by: BEE REALTY CORP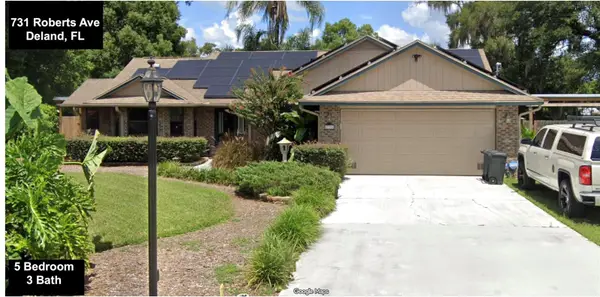 $425,000Pending4 beds 3 baths2,394 sq. ft.
731 Roberts Avenue, DELAND, FL 32724
MLS# FC316391Listed by: EXP REALTY LLC $439,000Active4 beds 3 baths1,949 sq. ft.
2390 9th Ave, DELAND, FL 32724
MLS# O6396633Listed by: CHARLES RUTENBERG REALTY ORLANDO $299,900Active3 beds 2 baths1,687 sq. ft.
115 Avenham Drive, DELAND, FL 32724
MLS# V4948460Listed by: GLORY INTL. REAL ESTATE CO $299,999Active2 beds 2 baths1,547 sq. ft.
307 Heron Point Way, DELAND, FL 32724
MLS# V4948459Listed by: RISE REALTY OF FLORIDA LLC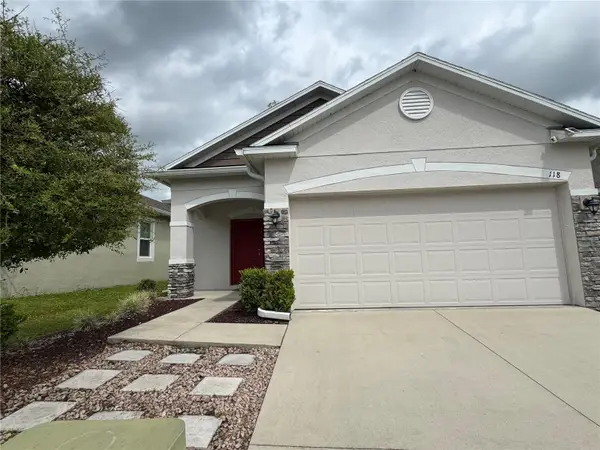 $320,000Active3 beds 2 baths1,318 sq. ft.
118 Hurst Ct, DELAND, FL 32724
MLS# O6398360Listed by: ONE45 REALTY LLC $357,500Pending2 beds 2 baths1,448 sq. ft.
1615 Lambrook Drive, DELAND, FL 32724
MLS# V4948449Listed by: SUMMER WIND REALTY CENTRAL FL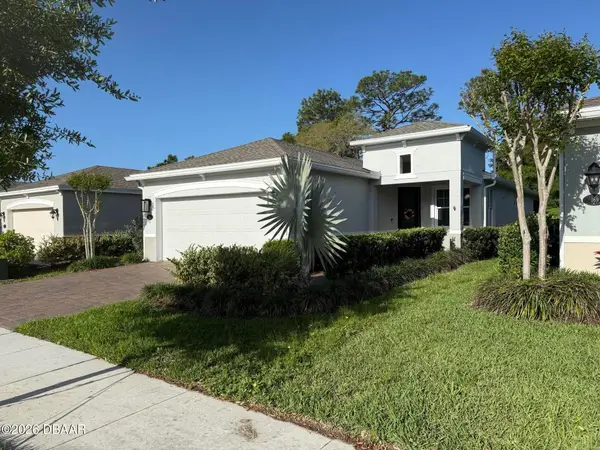 $397,000Active2 beds 2 baths1,652 sq. ft.
173 Old Moss Circle, DeLand, FL 32724
MLS# 1225097Listed by: FLORIDA PROPERTIES & MANAGEMENT SERVICES $364,900Active2 beds 2 baths1,512 sq. ft.
412 Tisbury Court, DELAND, FL 32724
MLS# V4948420Listed by: KEMP REALTY GROUP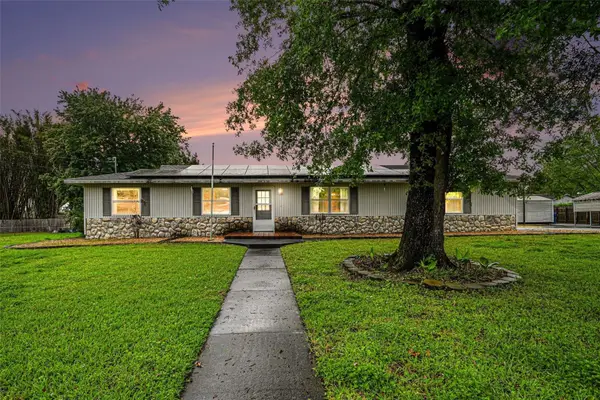 $324,999Pending3 beds 2 baths1,502 sq. ft.
527 Land O Lakes Court, DELAND, FL 32724
MLS# TB8495861Listed by: LPT REALTY, LLC $158,000Active18.3 Acres
2449 Old Train Road, DELTONA, FL 32738
MLS# O6397887Listed by: KELLER WILLIAMS LEGACY REALTY $475,000Pending2 beds 2 baths1,928 sq. ft.
1641 Victoria Gardens Drive, DELAND, FL 32724
MLS# O6396431Listed by: BETTER HOMES AND GARDENS REAL ESTATE MANN GLOBAL P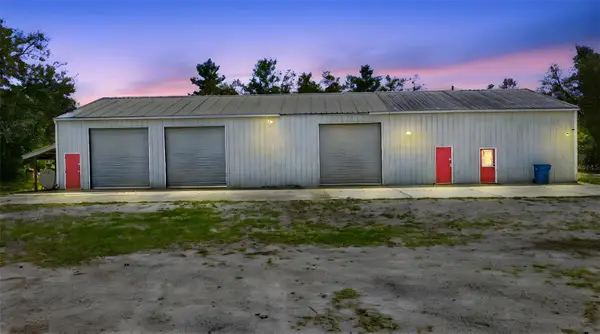 $795,900Active9.8 Acres
4155 Marsh Road, DELAND, FL 32724
MLS# V4948296Listed by: CHARLES RUTENBERG REALTY ORLANDO $219,000Active2 beds 2 baths1,200 sq. ft.
1403 E Voorhis Avenue, DELAND, FL 32724
MLS# V4948355Listed by: KELLER WILLIAMS HERITAGE REALTY $280,000Active2.5 Acres
130 Jesse Michael Drive, DELAND, FL 32724
MLS# O6396805Listed by: EXP REALTY LLC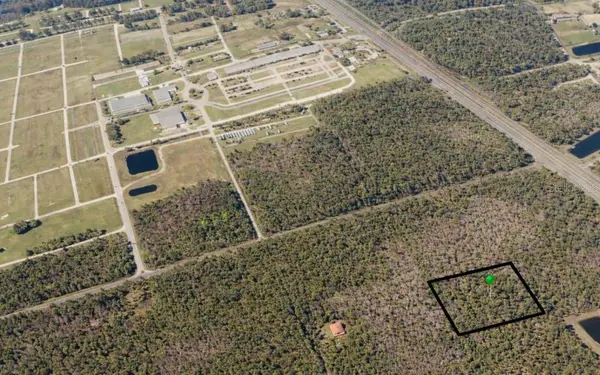 $85,000Active2.5 Acres
No Street, DELAND, FL 32724
MLS# O6396794Listed by: EXP REALTY LLC $299,000Active3 beds 2 baths1,477 sq. ft.
1623 Palmetto Avenue, DELAND, FL 32724
MLS# V4947969Listed by: PROPERTY SHOWCASE RE NETWORK $633,000Pending4 beds 3 baths2,801 sq. ft.
1615 Timber Pines Court, DELAND, FL 32724
MLS# V4948359Listed by: ADAMS, CAMERON & CO., REALTORS $539,990Pending4 beds 4 baths2,513 sq. ft.
671 Birdswill Lane, DELAND, FL 32724
MLS# O6396630Listed by: RISEWELL HOMES FLORIDA LLC $524,900Active3 beds 2 baths1,776 sq. ft.
940 N Kepler Road, DELAND, FL 32724
MLS# V4948240Listed by: LIVELY REAL ESTATE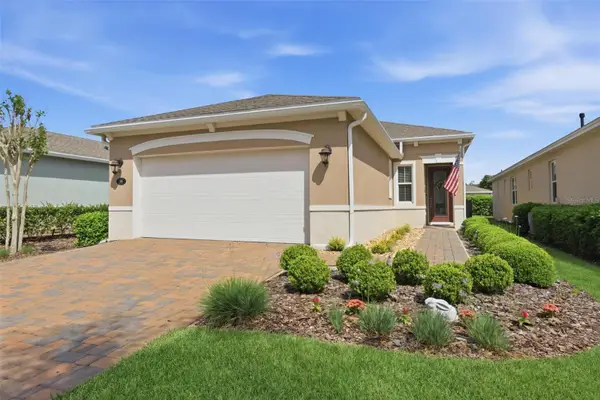 $356,000Pending2 beds 2 baths1,507 sq. ft.
188 Old Moss Circle, DELAND, FL 32724
MLS# V4948279Listed by: LANE REALTY SERVICES, LLC $405,000Active4 beds 3 baths2,046 sq. ft.
5014 Grand Teton Court, DELAND, FL 32724
MLS# O6396251Listed by: HD REALTY LLC $275,000Pending3 beds 2 baths1,685 sq. ft.
231 Meghan Street, DELAND, FL 32724
MLS# O6393187Listed by: EMPIRE NETWORK REALTY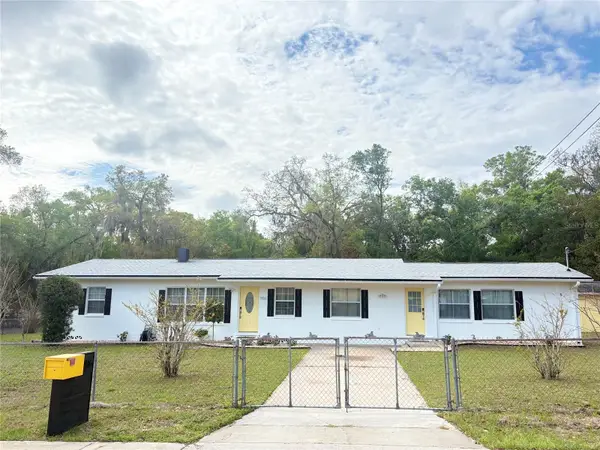 $365,000Active3 beds 2 baths2,020 sq. ft.
906 E Michigan Avenue, DELAND, FL 32724
MLS# V4948061Listed by: CHARLES RUTENBERG REALTY ORLANDO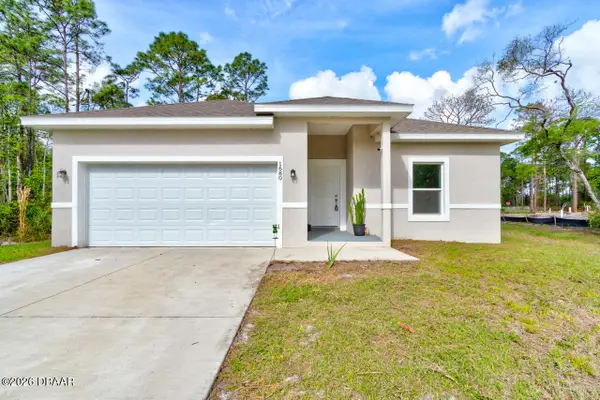 $340,000Active3 beds 2 baths1,418 sq. ft.
1680 9th Avenue, DeLand, FL 32724
MLS# 1224854Listed by: OCEANS LUXURY REALTY FULL SERVICE LLC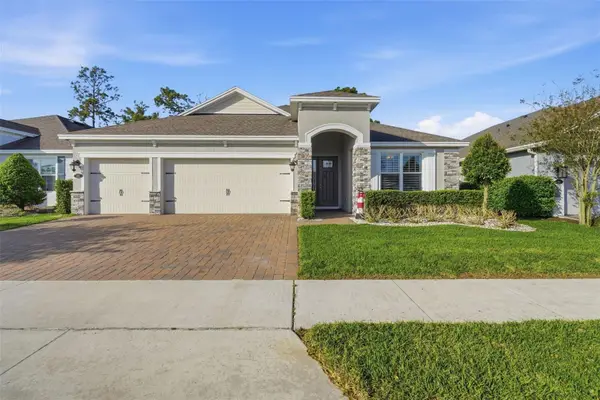 $525,000Pending3 beds 3 baths2,356 sq. ft.
262 Northcote Court, DELAND, FL 32724
MLS# V4948286Listed by: CHARLES RUTENBERG REALTY ORLANDO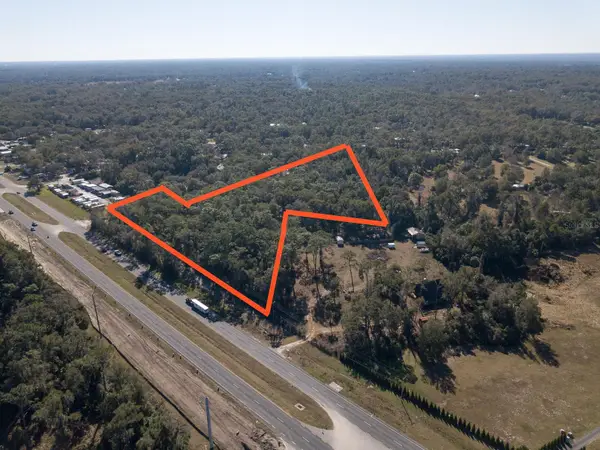 $400,000Active5.84 Acres
N Us Hwy 17, DELAND, FL 32720
MLS# V4948295Listed by: LIVELY REAL ESTATE $412,970Pending3 beds 2 baths1,724 sq. ft.
1254 Trident Loop, DELAND, FL 32724
MLS# W7884494Listed by: MALTBIE REALTY GROUP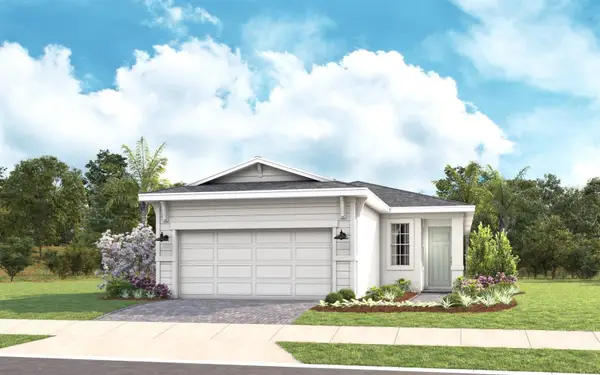 $401,645Pending2 beds 2 baths1,434 sq. ft.
1281 Jackson Hole Court, DELAND, FL 32724
MLS# W7884493Listed by: MALTBIE REALTY GROUP $572,930Pending3 beds 3 baths2,289 sq. ft.
1088 Liliana Drive, DELAND, FL 32724
MLS# W7884487Listed by: MALTBIE REALTY GROUP $564,900Pending4 beds 3 baths2,575 sq. ft.
3402 Black Willow Trail, DELAND, FL 32724
MLS# V4947765Listed by: KEMP REALTY GROUP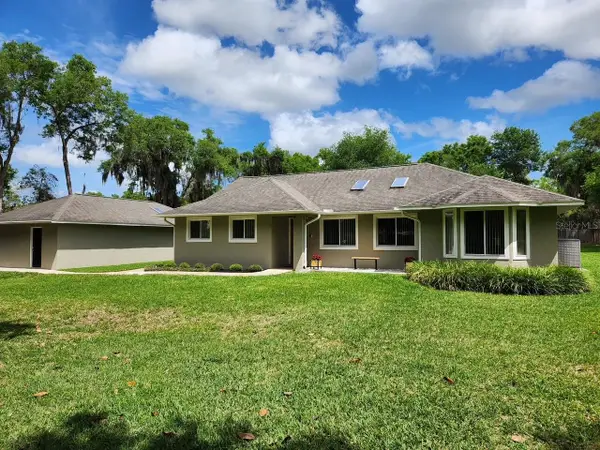 $488,000Pending3 beds 2 baths1,701 sq. ft.
313 N Hill Avenue, DELAND, FL 32724
MLS# V4948107Listed by: DASH REAL ESTATE COMPANY $434,995Pending4 beds 3 baths2,794 sq. ft.
1517 Blue Grass Boulevard, DELAND, FL 32724
MLS# V4948200Listed by: KEMP REALTY GROUP $406,000Active4 beds 2 baths
1034 Chelan Falls Dr, Deland, FL 32724
MLS# A11992138Listed by: SILVER SKY REALTY, LLC $354,500Pending4 beds 2 baths1,580 sq. ft.
2113 Canopy Terrace Boulevard, DELAND, FL 32724
MLS# V4948131Listed by: DASH REAL ESTATE COMPANY $19,000Active0.26 Acres
LOT 139 12th Avenue, DELAND, FL 32724
MLS# O6394740Listed by: EXP REALTY LLC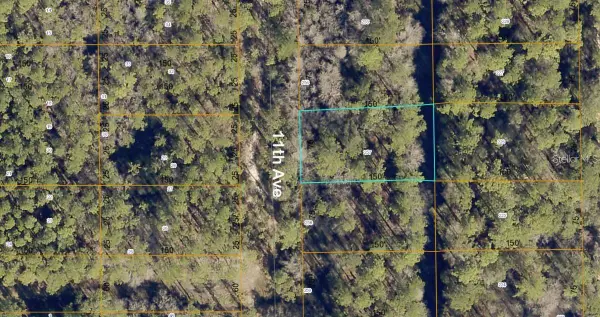 $19,000Active0.26 Acres
lot 257 11th Avenue, DELAND, FL 32724
MLS# O6394742Listed by: EXP REALTY LLC $419,900Pending3 beds 2 baths2,208 sq. ft.
107 Curry Rise Court, DELAND, FL 32724
MLS# V4948099Listed by: THE BAUMGARTNER COMPANY $579,900Pending3 beds 3 baths3,015 sq. ft.
1411 Wyngate Drive, DELAND, FL 32724
MLS# V4948153Listed by: KEMP REALTY GROUP $405,000Pending3 beds 2 baths2,020 sq. ft.
1510 Bent Oaks Boulevard, DELAND, FL 32724
MLS# V4948142Listed by: ADAMS, CAMERON & CO., REALTORS $549,900Active3 beds 3 baths2,024 sq. ft.
1011 Victoria Hills Drive S, DELAND, FL 32724
MLS# O6393736Listed by: MARK SPAIN REAL ESTATE $597,000Active3 beds 3 baths2,804 sq. ft.
261 Old Moss Circle, DELAND, FL 32724
MLS# V4948109Listed by: SWANN REAL ESTATE INC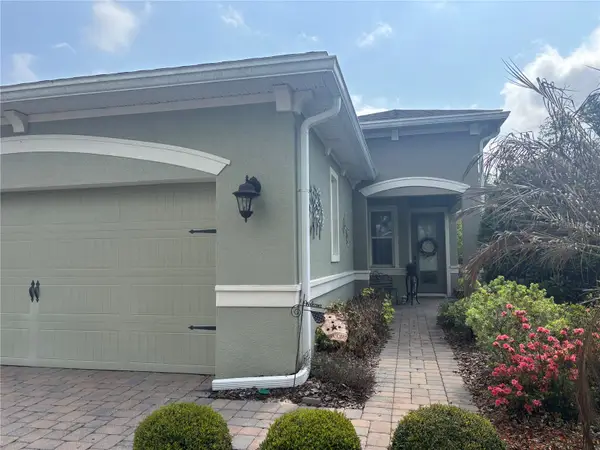 $285,000Active2 beds 2 baths1,512 sq. ft.
1369 Hayton Avenue, DELAND, FL 32724
MLS# V4948110Listed by: LPT REALTY LLC $339,000Active3 beds 2 baths1,501 sq. ft.
3030 Ruby Fls Drive, Deland, FL 32724
MLS# B26006755Listed by: PREMIER BROKERS INTERNATIONAL $92,000Active2.5 Acres
Turkey Roost Road, DELAND, FL 32724
MLS# V4948074Listed by: APARO-GRIFFIN PROPERTIES INC $82,000Active2.5 Acres
Turkey Roost Road, DELAND, FL 32724
MLS# V4948075Listed by: APARO-GRIFFIN PROPERTIES INC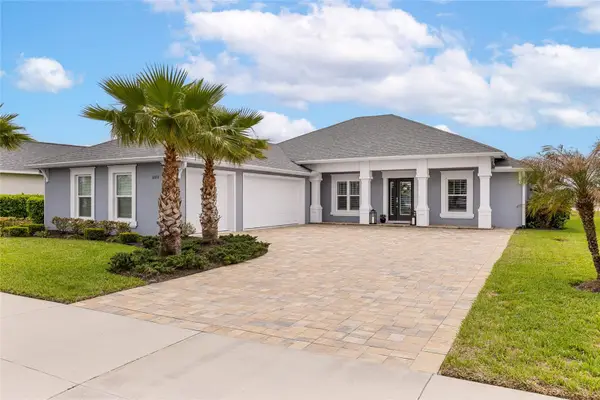 $649,000Active3 beds 2 baths1,802 sq. ft.
1600 Lake Reserve Drive, DELAND, FL 32724
MLS# O6392296Listed by: LPT REALTY LLC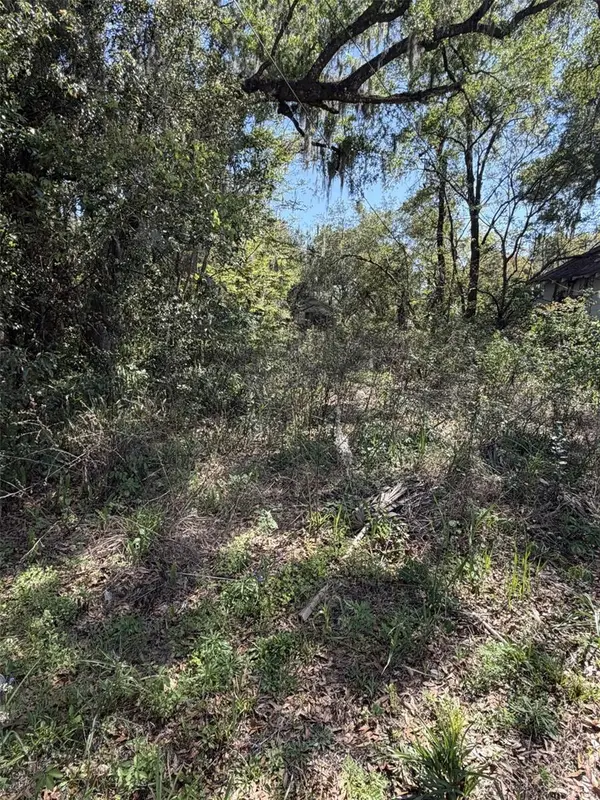 $64,500Active0.16 Acres
110 E Mercers Fernery Road, DELAND, FL 32724
MLS# V4948006Listed by: WATSON REALTY CORP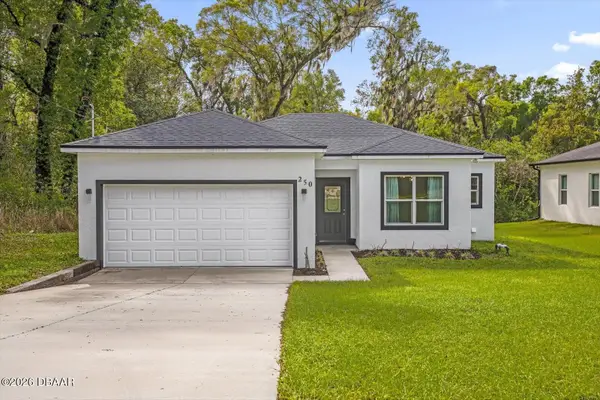 $314,900Pending3 beds 2 baths1,516 sq. ft.
250 S Virginia Avenue, DeLand, FL 32724
MLS# 1224455Listed by: REAL BROKER, LLC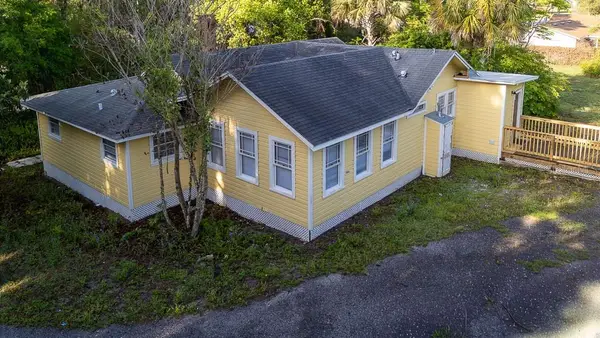 $289,900Active3 beds 2 baths1,302 sq. ft.
735 Montreville Ave, DELAND, FL 32724
MLS# V4947977Listed by: APARO-GRIFFIN PROPERTIES INC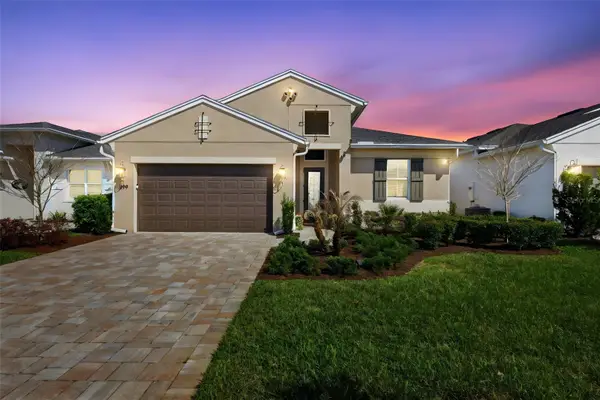 $479,900Active2 beds 2 baths1,970 sq. ft.
899 Megano Boulevard, DELAND, FL 32724
MLS# V4947724Listed by: BEE REALTY CORP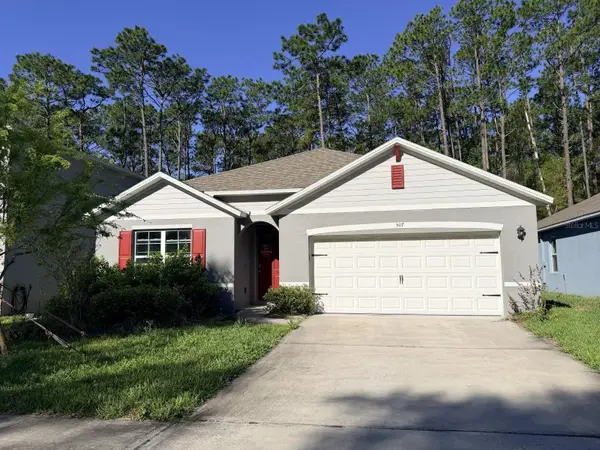 $309,500Pending4 beds 2 baths1,841 sq. ft.
507 Lady Irelyn Court, DELAND, FL 32724
MLS# O6392464Listed by: CENTURY 21 CARIOTI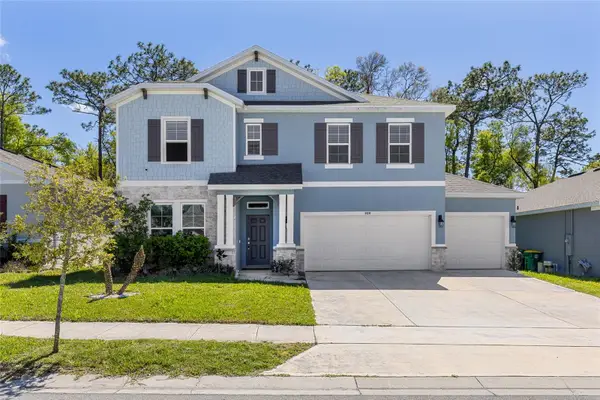 $489,000Active4 beds 4 baths3,076 sq. ft.
484 Baroness Way, DELAND, FL 32724
MLS# O6392368Listed by: FUTURE HOME REALTY INC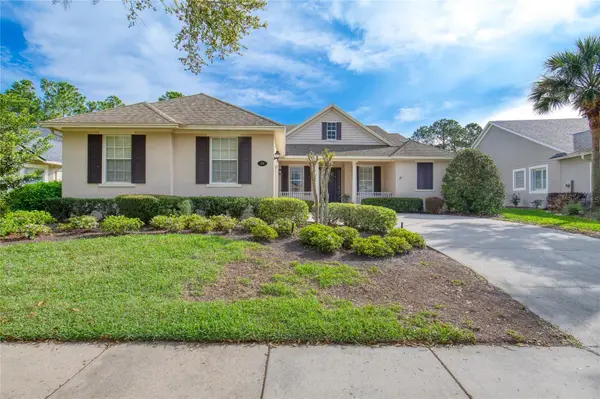 $560,000Active4 beds 3 baths2,528 sq. ft.
314 Bellingrath Terrace, DELAND, FL 32724
MLS# V4947579Listed by: REALTY PROS ASSURED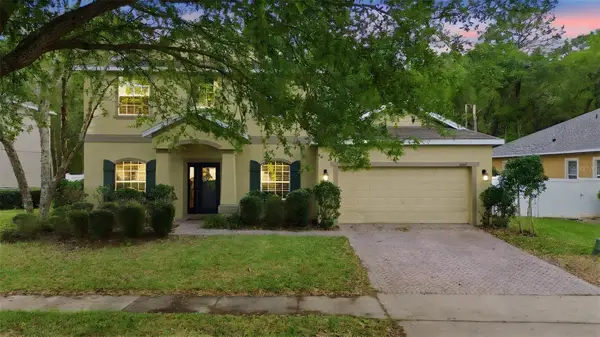 $489,900Active5 beds 4 baths3,355 sq. ft.
1604 Blue Grass Boulevard, DELAND, FL 32724
MLS# V4947767Listed by: CHARLES RUTENBERG REALTY ORLANDO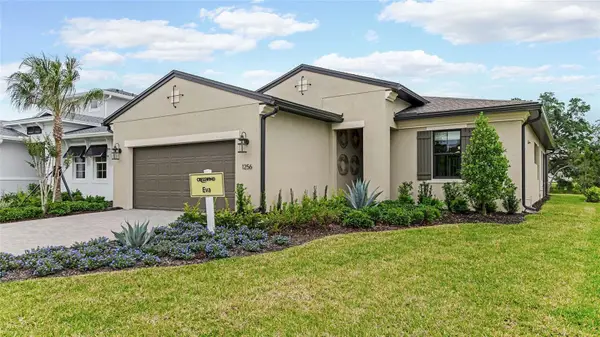 $528,380Pending3 beds 3 baths2,129 sq. ft.
1281 Twin Farms Court, DELAND, FL 32724
MLS# W7884058Listed by: MALTBIE REALTY GROUP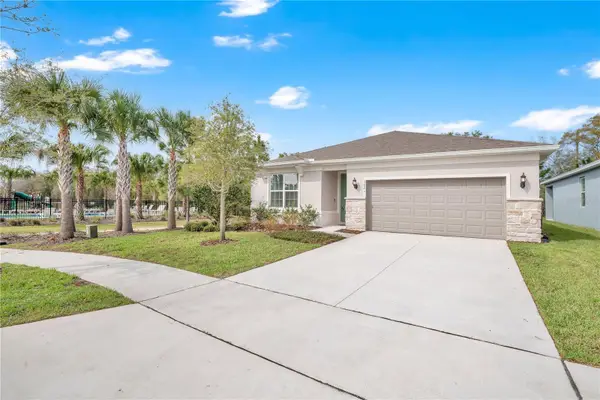 $369,000Active4 beds 2 baths1,844 sq. ft.
3021 Green Park Drive, DELAND, FL 32724
MLS# O6390902Listed by: EXP REALTY LLC $474,500Active3 beds 2 baths1,849 sq. ft.
112 Suffolk Court, DELAND, FL 32724
MLS# TB8487197Listed by: FLAT FEE MLS REALTY $464,900Pending3 beds 3 baths2,194 sq. ft.
608 Scotch Gate Terrace, DELAND, FL 32724
MLS# V4947187Listed by: KELLER WILLIAMS HERITAGE REALTY $249,000Pending2 beds 1 baths892 sq. ft.
426 E Plymouth Avenue, DeLand, FL 32724
MLS# 1224228Listed by: LOKATION $205,000Pending2 beds 1 baths824 sq. ft.
1120 E Minnesota Avenue, DELAND, FL 32724
MLS# V4947973Listed by: GREENE REALTY OF FLORIDA LLC $465,000Active4 beds 3 baths2,345 sq. ft.
637 Bluehearts Trail, DELAND, FL 32724
MLS# NS1087644Listed by: LOCAL LIVING REALTY GROUP $549,000Active4 beds 3 baths2,438 sq. ft.
201 Asterbrooke Drive, DELAND, FL 32724
MLS# V4947923Listed by: DASH REAL ESTATE COMPANY $450,000Active1.4 Acres
205 E New Hampshire Avenue, DELAND, FL 32724
MLS# O6391109Listed by: LPT REALTY, LLC $575,000Active3 beds 3 baths2,792 sq. ft.
215 Avenham Drive, DELAND, FL 32724
MLS# O6388928Listed by: CHARLES RUTENBERG REALTY ORLANDO $350,000Active4 beds 2 baths1,600 sq. ft.
1785 9th Avenue, DELAND, FL 32724
MLS# O6390233Listed by: COLDWELL BANKER REALTY $72,900Active0.44 Acres
2221 Holly Lane, DELAND, FL 32724
MLS# V4947848Listed by: CHARLES RUTENBERG REALTY ORLANDO $369,999Active4 beds 2 baths1,828 sq. ft.
452 Baroness Way, DELAND, FL 32724
MLS# O6389935Listed by: REAL BROKER, LLC $280,000Pending3 beds 2 baths1,160 sq. ft.
1380 2nd Avenue, DELAND, FL 32724
MLS# V4947827Listed by: CHARLES RUTENBERG REALTY ORLANDO $19,000Active0.26 Acres
E Jasmine Road, DELAND, FL 32724
MLS# TB8485458Listed by: FIELDS OF PROSPER LLC $305,000Active3 beds 1 baths1,610 sq. ft.
975 N Boston Avenue, DELAND, FL 32724
MLS# NS1087581Listed by: LAND AND SEA REALTY $380,000Active3 beds 2 baths1,795 sq. ft.
439 Victoria Hills Drive, DELAND, FL 32724
MLS# TB8484596Listed by: REDFIN CORPORATION $279,900Active3 beds 2 baths1,404 sq. ft.
3801 Arborvitae Way, DELAND, FL 32724
MLS# O6389600Listed by: FLORIDA PRESTIGIOUS HOMES INC $424,900Active4 beds 3 baths2,380 sq. ft.
2337 Oxmoor Drive, DELAND, FL 32724
MLS# V4947655Listed by: DASH REAL ESTATE COMPANY $265,000Pending3 beds 2 baths1,150 sq. ft.
14 Sunshine Boulevard, DELAND, FL 32724
MLS# O6389394Listed by: HOMEVEST REALTY $1,100,000Active2 beds 2 baths1,164 sq. ft.
1065 S Massachusetts Avenue, DELAND, FL 32724
MLS# V4947779Listed by: SOUTHERN EXCLUSIVE REALTY CORP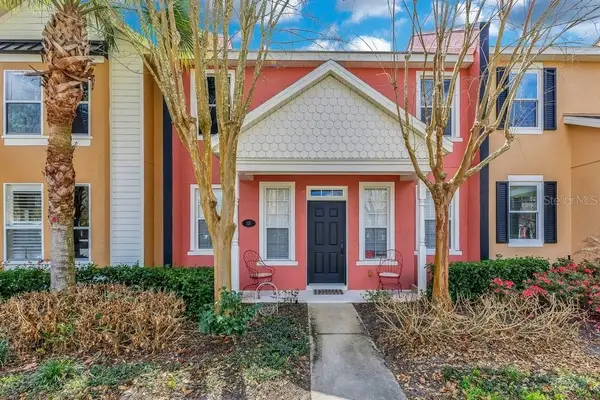 $289,000Active2 beds 3 baths1,536 sq. ft.
125 Manor View Lane, DELAND, FL 32724
MLS# V4947706Listed by: LPT REALTY, LLC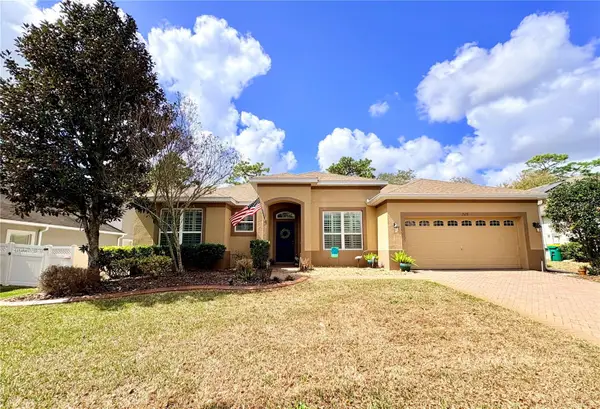 $595,500Active4 beds 3 baths2,948 sq. ft.
1528 Blue Grass Boulevard, DELAND, FL 32724
MLS# V4947760Listed by: ADAMS, CAMERON & CO., REALTORS $25,000Pending0.14 Acres
E Hubbard Avenue, DELAND, FL 32724
MLS# O6388384Listed by: EXP REALTY LLC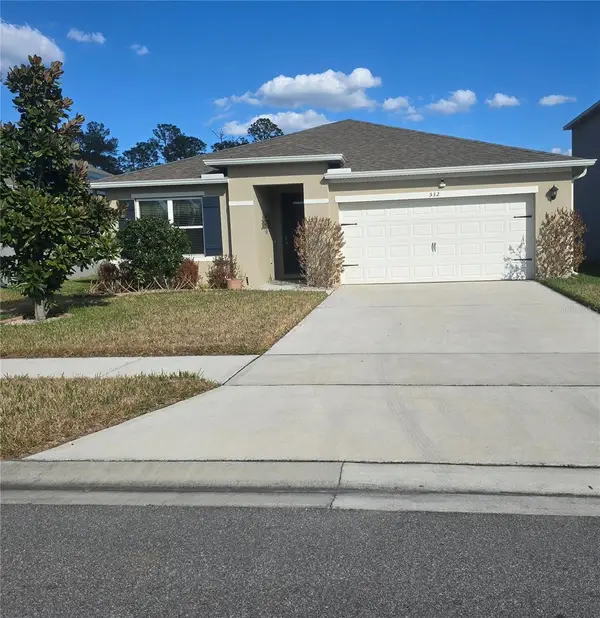 $360,000Active3 beds 2 baths1,685 sq. ft.
532 Emily Glen Street, DELAND, FL 32724
MLS# R4910828Listed by: LAWHUN ENTERPRISES IV, LLC DBA: FLORIDA REALTY INVESTMENTS IV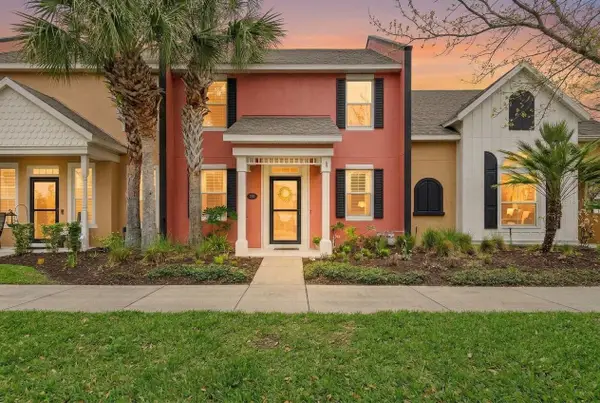 $299,000Active3 beds 3 baths1,637 sq. ft.
202 Woodhouse Lane, DELAND, FL 32724
MLS# V4947658Listed by: SOUTHERN EXCLUSIVE REALTY CORP $424,900Active4 beds 3 baths2,672 sq. ft.
2374 Kennington Cove, DELAND, FL 32724
MLS# V4947654Listed by: LIVELY REAL ESTATE
Local realty services provided by:CENTURY 21 North East, CENTURY 21 Sundance Realty, CENTURY 21 Lighthouse Realty, CENTURY 21 All Professional, CENTURY 21 Circle, CENTURY 21 HomeStar
The information being provided by Stellar Mls is for the consumer's personal, non-commercial use and may not be used for any purpose other than to identify prospective properties consumer may be interested in purchasing. Any information relating to real estate for sale referenced on this web site comes from the Internet Data Exchange (IDX) program of the Stellar Mls. CENTURY 21 North East is not a Multiple Listing Service (MLS), nor does it offer MLS access. This website is a service of CENTURY 21 North East, a broker participant of Stellar Mls. This web site may reference real estate listing(s) held by a brokerage firm other than the broker and/or agent who owns this web site.
The accuracy of all information, regardless of source, including but not limited to open house information, square footages and lot sizes, is deemed reliable but not guaranteed and should be personally verified through personal inspection by and/or with the appropriate professionals. The data contained herein is copyrighted by Stellar Mls and is protected by all applicable copyright laws. Any unauthorized dissemination of this information is in violation of copyright laws and is strictly prohibited.
Properties in listings may have been sold or may no longer be available.
Copyright 2026 Stellar Mls. All rights reserved. MFRMLS Member Broker: Jim D’Amico
Information deemed reliable but not guaranteed. Information is provided, in part, by Brevard MLS. This information being provided is for consumer's personal, non-commercial use and may not be used for any other purpose other than to identify prospective properties consumers may be interested in purchasing.
Information deemed reliable but not guaranteed. Information is provided, in part, by Greater Miami MLS. This information being provided is for consumer's personal, non-commercial use and may not be used for any other purpose other than to identify prospective properties consumers may be interested in purchasing. SEFMLS Member Broker: David Cates
Popular searches near 32724
Popular neighborhoods near 32724
- Arbor Ridge, Deltona homes for sale
- Coronado Acres, New Smyrna Beach homes for sale
- Daytona Park Estates, Deland homes for sale
- Deland Highlands, Deland homes for sale
- Deleon Springs, De Leon Springs homes for sale
- Deleon Springs Heights, De Leon Springs homes for sale
- Deltona Lakes, Deltona homes for sale
- Hidden Lake, Port Orange homes for sale
- Lake Marie Estates, Debary homes for sale
- Lionspaw, Daytona Beach homes for sale
- Orange City Deland Farms, Orange City homes for sale
- Orangedale, Orange City homes for sale
- Spruce Creek Fly-In, Port Orange homes for sale
- Summer Trees, Port Orange homes for sale
- Venetian Bay, New Smyrna Beach homes for sale
- Victoria Commons, Deland homes for sale
- Victoria Park, Deland homes for sale
- Victoria Trails, Deland homes for sale
- Waters Edge, Port Orange homes for sale
- Winnemissett, Deland homes for sale
Counties near Deland, 32724
- Alachua County homes for sale
- Bradford County homes for sale
- Brevard County homes for sale
- Citrus County homes for sale
- Clay County homes for sale
- Duval County homes for sale
- Flagler County homes for sale
- Hernando County homes for sale
- Lake County homes for sale
- Levy County homes for sale
- Marion County homes for sale
- Orange County homes for sale
- Osceola County homes for sale
- Pasco County homes for sale
- Polk County homes for sale
- Putnam County homes for sale
- St. Johns County homes for sale
- Seminole County homes for sale
- Sumter County homes for sale
- Volusia County homes for sale
Protect your home and budget from life's surprises with an Assurant Home Warranty, backed by a partner that supports you through every step of homeownership. Explore Plans.
©2026 Century 21 Real Estate LLC. All rights reserved. CENTURY 21®, the CENTURY 21 Logo and C21® are service marks owned by Century 21 Real Estate LLC. Century 21 Real Estate LLC fully supports the principles of the Fair Housing Act and the Equal Opportunity Act. Each office is independently owned and operated. Listing information is deemed reliable but not guaranteed accurate.