- Altamonte Springs homes for sale
- Black Hammock homes for sale
- Casselberry homes for sale
- Casselberry-Altamonte Springs homes for sale
- Debary homes for sale
- DeBary-Orange City homes for sale
- DeLand Southwest homes for sale
- Deltona homes for sale
- Enterprise homes for sale
- Fern Park homes for sale
- Heathrow homes for sale
- Lake Helen homes for sale
- Lake Mary homes for sale
- Longwood homes for sale
- Midway homes for sale
- Orange City homes for sale
- Pine Lakes homes for sale
- Sanford homes for sale
- Wekiwa Springs homes for sale
- Winter Springs homes for sale
32771, FL - homes for sale
300 of 428 results displayed
- New
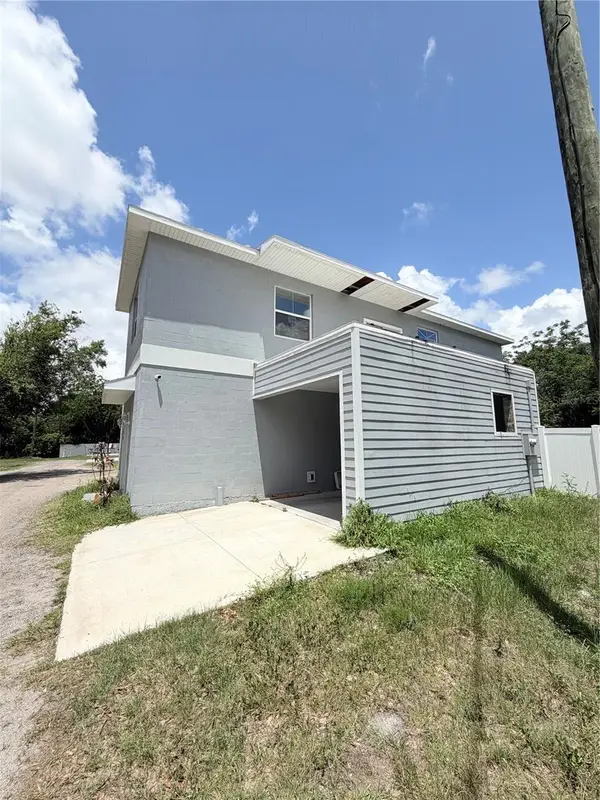
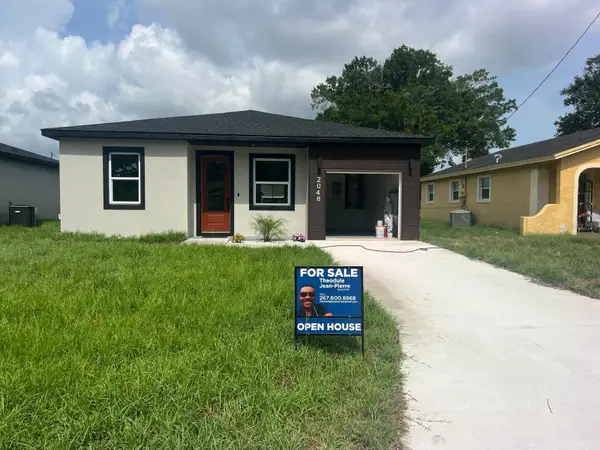 $360,000Active3 beds 2 baths1,303 sq. ft.
2048 Dixie Avenue, SANFORD, FL 32771
MLS# S5150882Listed by: LA ROSA REALTY ORLANDO LLC - New
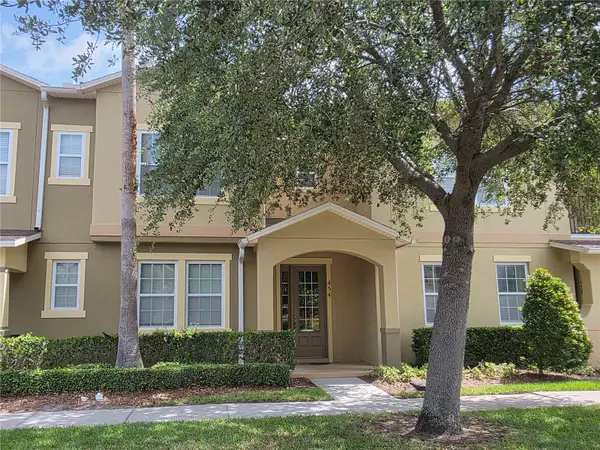 $379,900Active3 beds 4 baths1,912 sq. ft.
454 Ellis Square Court, SANFORD, FL 32771
MLS# TB8510652Listed by: COLDWELL BANKER REALTY - New
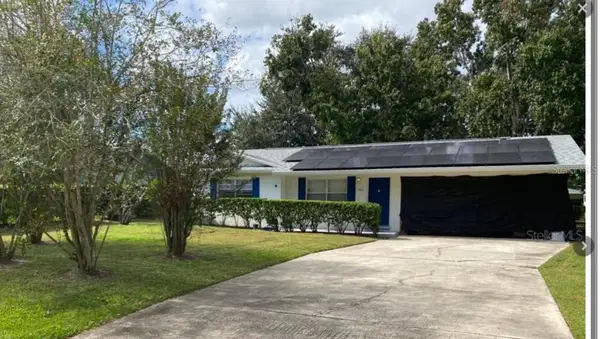 $189,000Active3 beds 2 baths1,070 sq. ft.
2412 Marshall Avenue, SANFORD, FL 32771
MLS# O6411000Listed by: EXIT REALTY PREMIER LEGACY - New
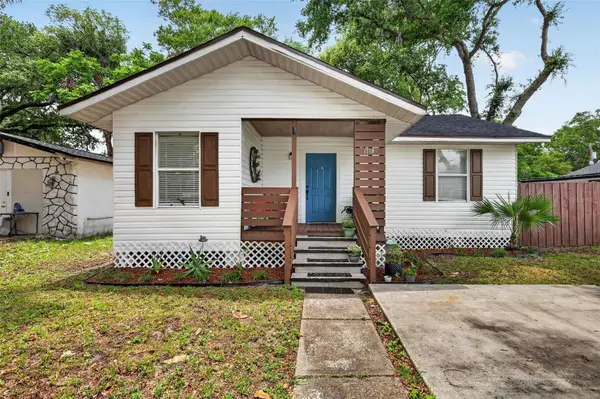 $274,500Active3 beds 3 baths1,403 sq. ft.
1114 Pine Avenue, SANFORD, FL 32771
MLS# O6412269Listed by: LUXE PROPERTIES - New
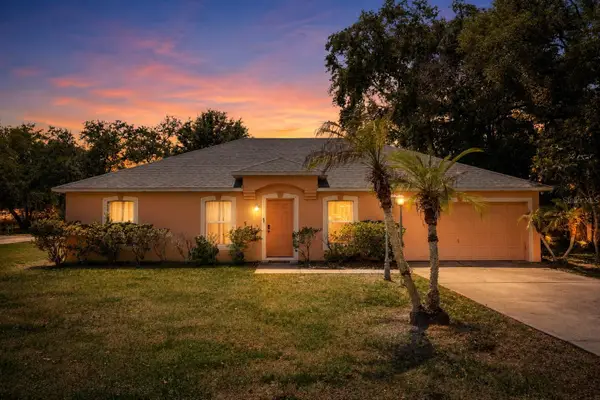
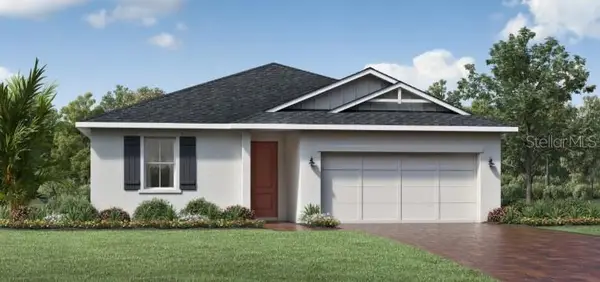
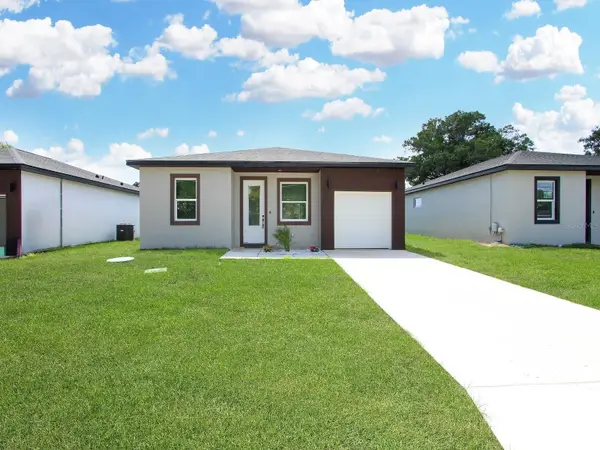
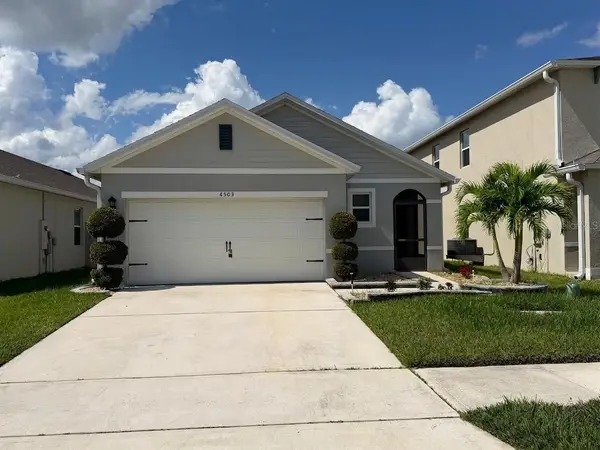 $373,724Active3 beds 2 baths1,516 sq. ft.
4503 Blue Rock Drive, SANFORD, FL 32771
MLS# S5150529Listed by: YOUNG REAL ESTATE - Open Sat, 11am to 2pmNew
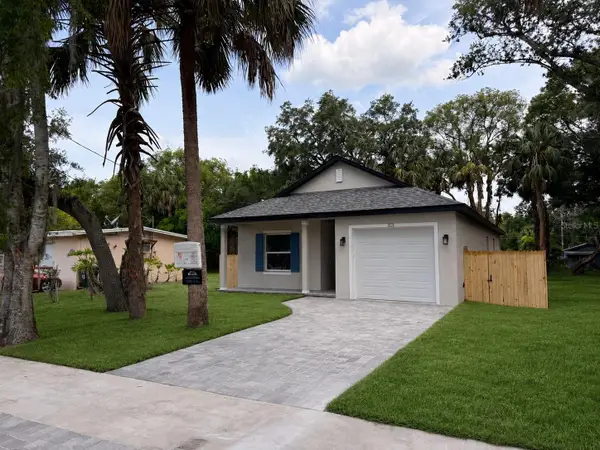
 $489,900Active3 beds 3 baths2,296 sq. ft.
1834 Stargazer Terrace, SANFORD, FL 32771
MLS# O6412063Listed by: LPT REALTY, LLC - New
 $399,000Active3 beds 2 baths1,662 sq. ft.
1421 Savoy Lane, SANFORD, FL 32771
MLS# O6411923Listed by: EXP REALTY LLC - New
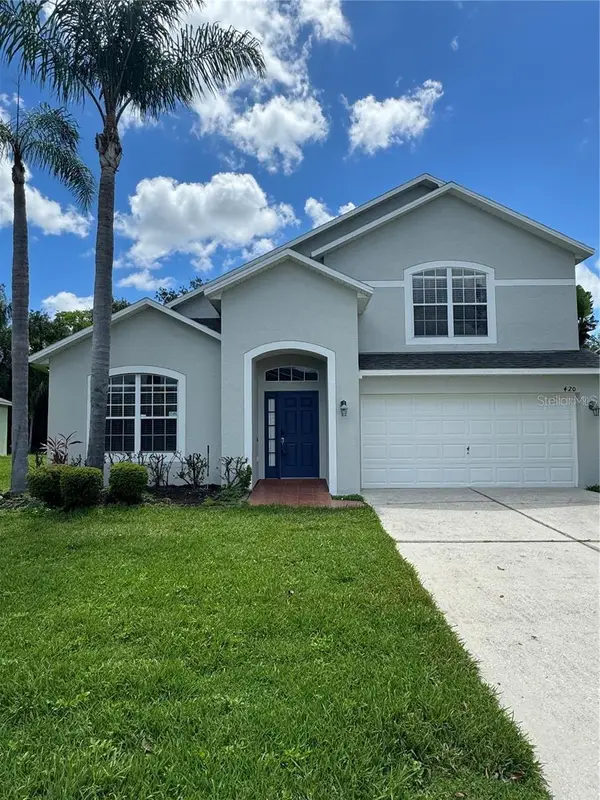 $409,999Active4 beds 3 baths2,321 sq. ft.
420 Marathon Lane, SANFORD, FL 32771
MLS# O6412137Listed by: CFRP REALTY LLC - New
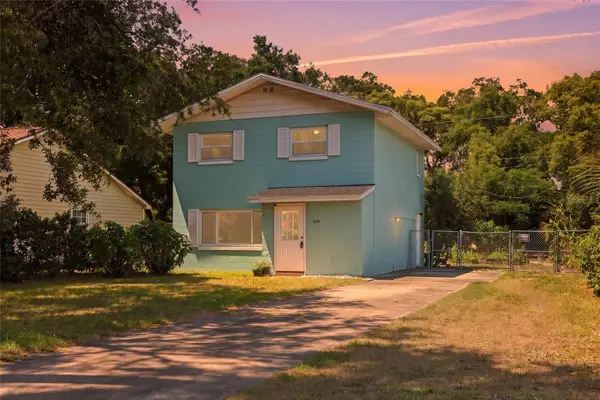
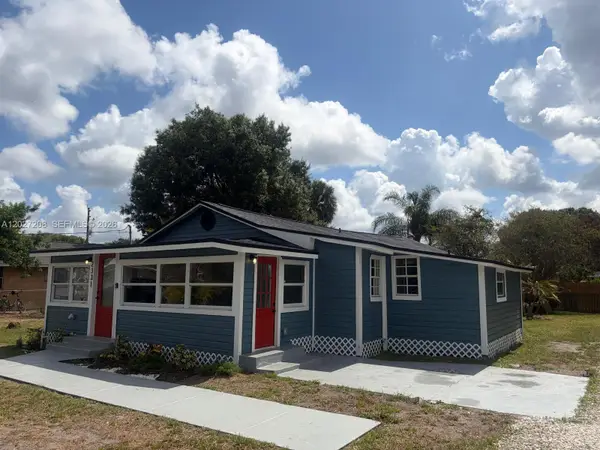 $358,000Active5 beds 3 baths
2331 Randall St, Sanford, FL 32771
MLS# A12027208Listed by: LUFT REALTY - New
 $395,000Active3 beds 2 baths1,923 sq. ft.
401 W 10th Street, SANFORD, FL 32771
MLS# O6402832Listed by: KGV REALTY GROUP - New
 $419,500Active3 beds 2 baths1,462 sq. ft.
162 Brushcreek Drive, SANFORD, FL 32771
MLS# O6410296Listed by: SLOANE REALTY, LLC - New
 $333,000Active3 beds 2 baths1,416 sq. ft.
105 Holloway Court, SANFORD, FL 32771
MLS# O6411288Listed by: CHARLES RUTENBERG REALTY ORLANDO - New
 $530,000Active4 beds 3 baths2,233 sq. ft.
3679 Lincoln Street, SANFORD, FL 32771
MLS# O6411905Listed by: LIGHTHOUSE PROPERTY GRP INC - New
 $329,900Active2 beds 1 baths884 sq. ft.
2120 Sanford Avenue, SANFORD, FL 32771
MLS# O6410786Listed by: KGV REALTY GROUP - New
 $415,000Active5 beds 4 baths2,498 sq. ft.
1021 W 25th Street, SANFORD, FL 32771
MLS# O6411935Listed by: LA ROSA REALTY CW PROPERTIES L - New
 $219,000Active3 beds 2 baths1,014 sq. ft.
1104 E 8 Th Street, SANFORD, FL 32771
MLS# O6411404Listed by: REAL BROKER, LLC - New
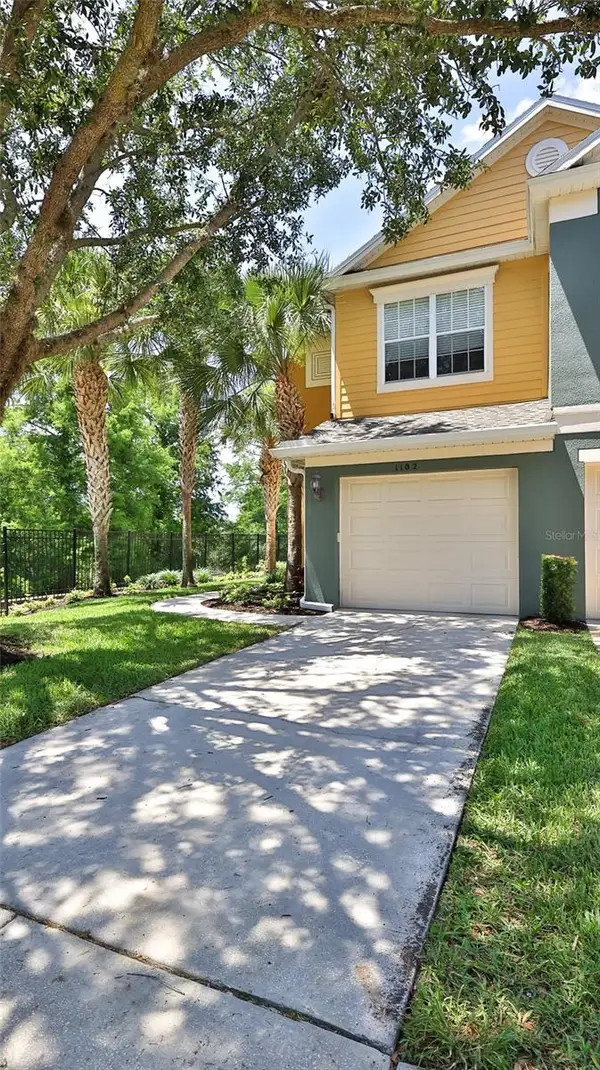 $345,000Active3 beds 4 baths1,647 sq. ft.
1102 Berkman Circle, SANFORD, FL 32771
MLS# O6411313Listed by: WEICHERT REALTORS HALLMARK PRO - New
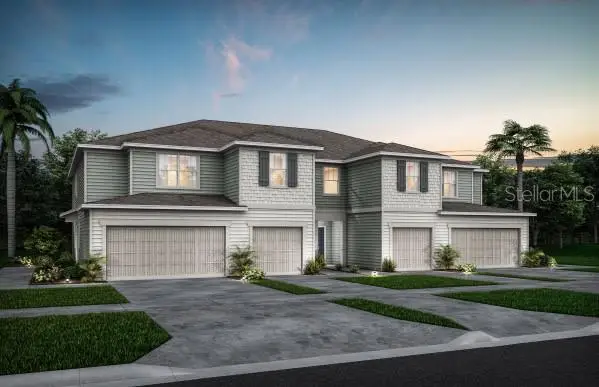 $339,390Active3 beds 3 baths1,699 sq. ft.
460 Beryl Cove, SANFORD, FL 32771
MLS# O6410562Listed by: PULTE REALTY OF NORTH FLORIDA LLC - New
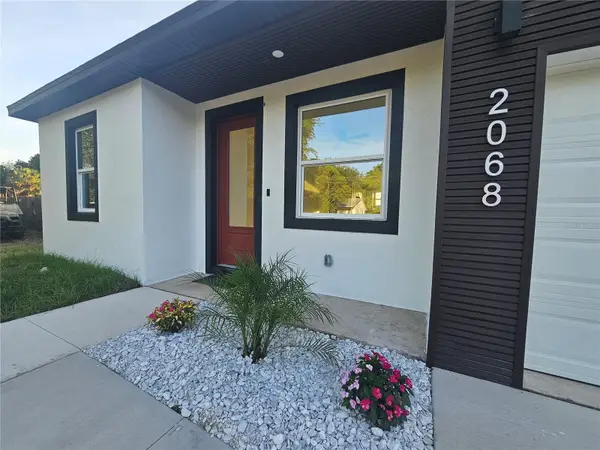 $359,000Active3 beds 2 baths1,303 sq. ft.
2068 Dixie Ave, SANFORD, FL 32771
MLS# S5150823Listed by: LA ROSA REALTY ORLANDO LLC - New
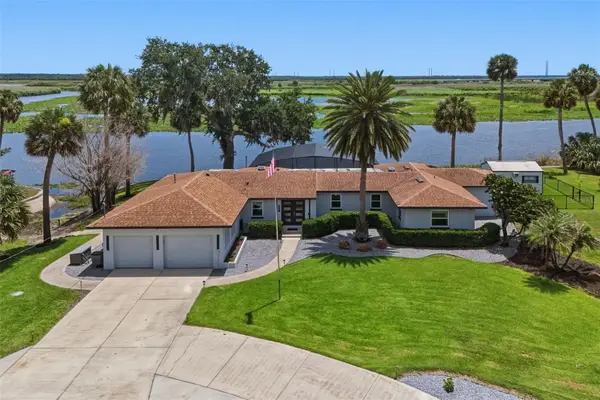 $1,150,000Active3 beds 4 baths2,257 sq. ft.
921 Powhatan Drive, SANFORD, FL 32771
MLS# O6410821Listed by: KELLER WILLIAMS ADVANTAGE 2 REALTY - New
 $275,000Active3 beds 3 baths1,203 sq. ft.
2730 Retreat View Circle, SANFORD, FL 32771
MLS# O6411225Listed by: INVESTOR'S REAL ESTATE LLC - New
 $378,000Active3 beds 2 baths1,871 sq. ft.
107 Wood Ridge Trail, SANFORD, FL 32771
MLS# O6409555Listed by: WEICHERT REALTORS HALLMARK PRO - New
 $410,000Active3 beds 3 baths1,836 sq. ft.
3180 Lincoln Street, SANFORD, FL 32771
MLS# P4938815Listed by: SMART WAY REALTY AMERICA - New
 $345,000Active3 beds 4 baths1,676 sq. ft.
212 Evertree Loop, SANFORD, FL 32771
MLS# O6410985Listed by: EWALD REALTY INC - New
 $445,000Active4 beds 4 baths3,012 sq. ft.
121 Mayfield Drive, SANFORD, FL 32771
MLS# O6410974Listed by: LPT REALTY, LLC - New
 $222,000Active3 beds 1 baths980 sq. ft.
3350 E State Road 46, SANFORD, FL 32771
MLS# TB8512076Listed by: SIVEN PREMIER REAL ESTATE - New
 $386,490Active3 beds 3 baths1,782 sq. ft.
452 Beryl Cove, SANFORD, FL 32771
MLS# O6410569Listed by: PULTE REALTY OF NORTH FLORIDA LLC - New
 $349,000Active3 beds 2 baths1,456 sq. ft.
417 W 6th Street, SANFORD, FL 32771
MLS# S5150532Listed by: KELLER WILLIAMS ADVANTAGE III - New
 $239,900Active2 beds 3 baths1,138 sq. ft.
1621 Stockton Drive, SANFORD, FL 32771
MLS# O6408636Listed by: CHARLES RUTENBERG REALTY ORLANDO - New
 $340,390Active3 beds 3 baths1,699 sq. ft.
468 Beryl Cove, SANFORD, FL 32771
MLS# O6410425Listed by: PULTE REALTY OF NORTH FLORIDA LLC - New
 $388,290Active3 beds 3 baths1,782 sq. ft.
472 Beryl Cove, SANFORD, FL 32771
MLS# O6410395Listed by: PULTE REALTY OF NORTH FLORIDA LLC - New
 $375,000Active3 beds 3 baths1,951 sq. ft.
1304 Sandstone Run, SANFORD, FL 32771
MLS# O6407354Listed by: LA ROSA REALTY CW PROPERTIES L 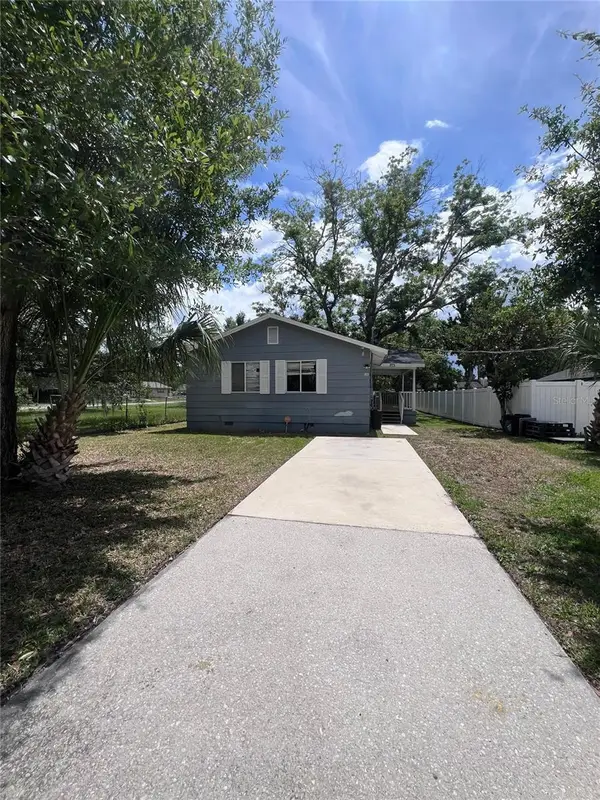 $189,900Pending3 beds 2 baths1,152 sq. ft.
1103 Willow Avenue, SANFORD, FL 32771
MLS# V4949246Listed by: GLORY INTL. REAL ESTATE CO- New
 $425,000Active3 beds 2 baths1,620 sq. ft.
1020 S Laurel Avenue, SANFORD, FL 32771
MLS# O6406676Listed by: APERTURE GLOBAL REAL ESTATE - New
 $325,900Active3 beds 2 baths1,334 sq. ft.
1816 W 16th Street, SANFORD, FL 32771
MLS# O6410255Listed by: UNITED REAL ESTATE PREFERRED - New
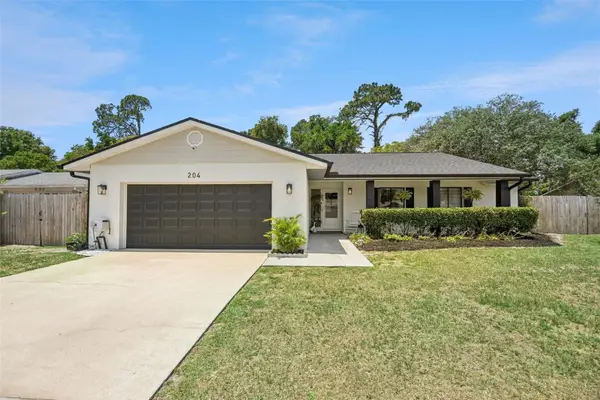 $385,000Active3 beds 2 baths1,621 sq. ft.
204 Dogwood Drive, SANFORD, FL 32771
MLS# O6410169Listed by: DENIZ REALTY PARTNERS LLC - New
 $929,000Active3 beds 4 baths3,217 sq. ft.
4965 Shoreline Circle, SANFORD, FL 32771
MLS# O6408881Listed by: SCOTT REALTY ASSOCIATES  $400,000Pending3 beds 3 baths1,912 sq. ft.
5480 Factors Walk Drive, SANFORD, FL 32771
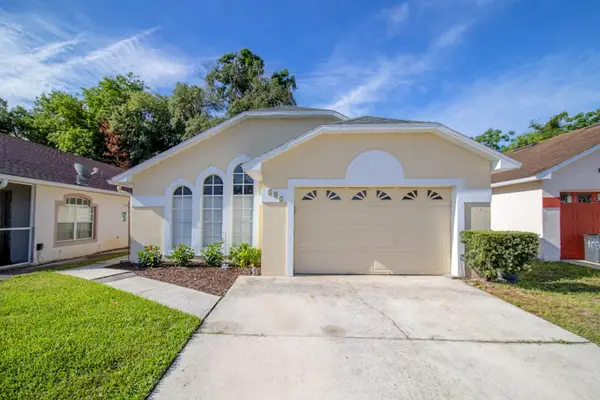
MLS# O6410001Listed by: RE/MAX PRIME PROPERTIES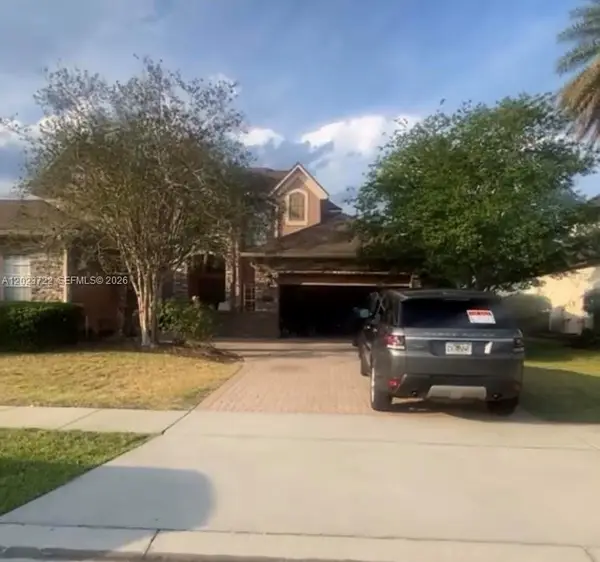 $665,000Pending4 beds 4 baths
5059 Otters Den Trl, Sanford, FL 32771
MLS# A12023722Listed by: LPT REALTY, LLC- New
 $285,000Active3 beds 2 baths1,340 sq. ft.
804 Rosalia Drive, SANFORD, FL 32771
MLS# O6409764Listed by: CENTURY 21 ALTON CLARK  $279,900Pending3 beds 2 baths1,097 sq. ft.
2401 Daffadil Terrace, SANFORD, FL 32771
MLS# O6409959Listed by: LOKATION- New
 $619,000Active4 beds 3 baths2,380 sq. ft.
3678 Arbordale Loop, SANFORD, FL 32771
MLS# O6409920Listed by: ORLANDO TBI REALTY LLC - New
 $359,900Active3 beds 2 baths1,303 sq. ft.
2060 Dixie Avenue, SANFORD, FL 32771
MLS# O6409825Listed by: EG ORLANDO LLC - New
 $305,000Active3 beds 3 baths1,642 sq. ft.
2775 River Landing Drive, SANFORD, FL 32771
MLS# O6409915Listed by: EXP REALTY LLC  $293,900Active4 beds 3 baths1,252 sq. ft.
213 Hays Drive, SANFORD, FL 32771
MLS# O6409660Listed by: MAINSTAY BROKERAGE LLC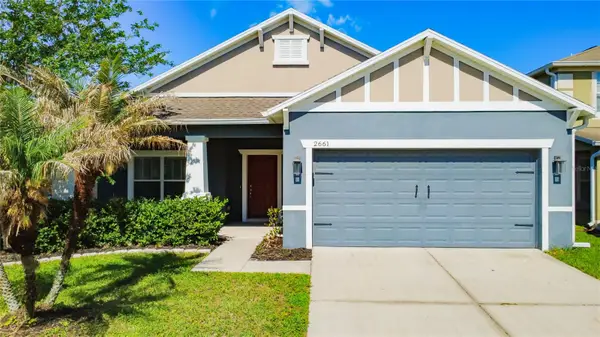 $375,000Active3 beds 2 baths1,711 sq. ft.
2661 Bullion Loop, SANFORD, FL 32771
MLS# C7526383Listed by: SOVEREIGN REAL ESTATE GROUP $725,000Active4 beds 3 baths3,106 sq. ft.
5700 Climbing Rose Way, SANFORD, FL 32771
MLS# O6405138Listed by: COLDWELL BANKER REALTY $318,900Pending3 beds 2 baths1,156 sq. ft.
109 Scott Drive, SANFORD, FL 32771
MLS# O6409249Listed by: SPECTRUM PROPERTY GROUP LLC $374,990Active3 beds 2 baths1,138 sq. ft.
1189 Amanda Kay Circle, SANFORD, FL 32771
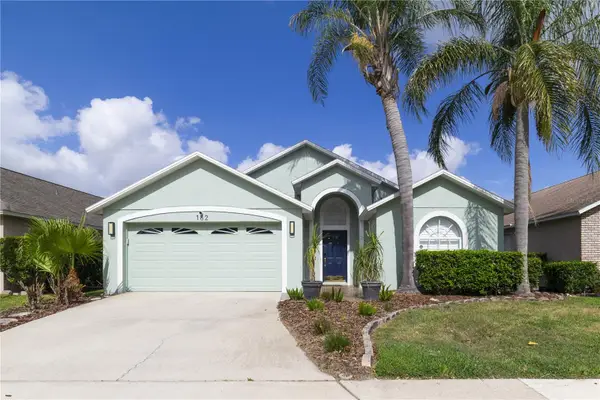
MLS# O6408790Listed by: COLDWELL BANKER REALTY $320,000Active3 beds 3 baths
2685 River Landing Dr, Sanford, FL 32771
MLS# A12020815Listed by: RE/MAX ADVANCE REALTY II $465,000Active3 beds 2 baths2,042 sq. ft.
4667 Redmond Place, SANFORD, FL 32771
MLS# G5111440Listed by: COLDWELL BANKER VANGUARD EDGE $430,000Active4 beds 2 baths1,815 sq. ft.
3201 Eastgrove Terrace, SANFORD, FL 32771
MLS# O6409087Listed by: VESTI LLC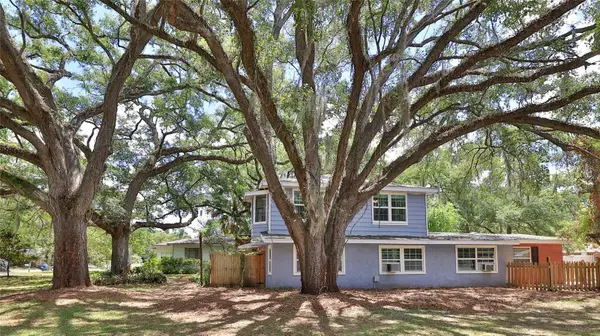 $372,800Active3 beds 3 baths1,980 sq. ft.
801 E 20th Street, SANFORD, FL 32771
MLS# O6408932Listed by: WEICHERT REALTORS HALLMARK PRO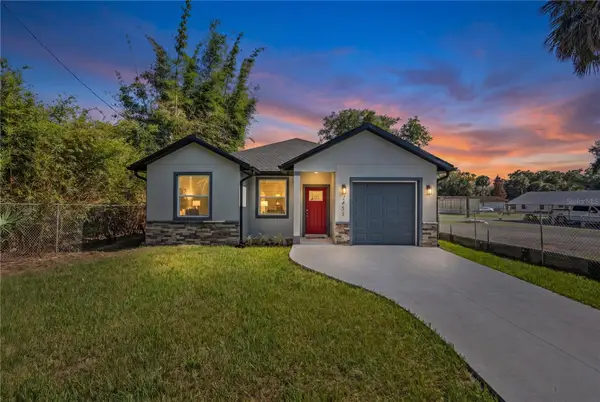 $315,000Active3 beds 2 baths1,165 sq. ft.
2451 W 18th Street, SANFORD, FL 32771
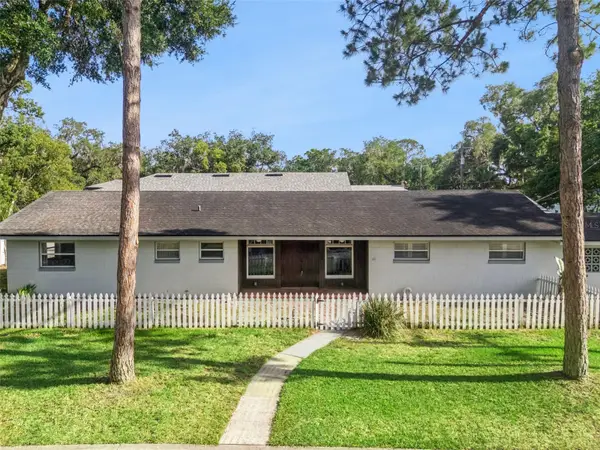
MLS# O6408930Listed by: REAL BROKER, LLC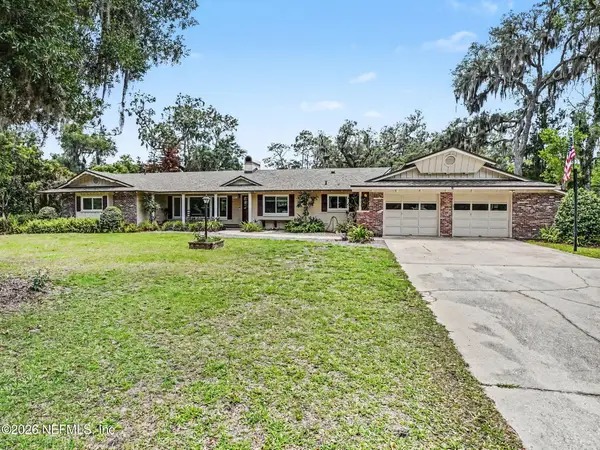 $630,000Active4 beds 3 baths2,319 sq. ft.
5201 Wayside Drive, Sanford, FL 32771
MLS# 2145981Listed by: MARK SPAIN REAL ESTATE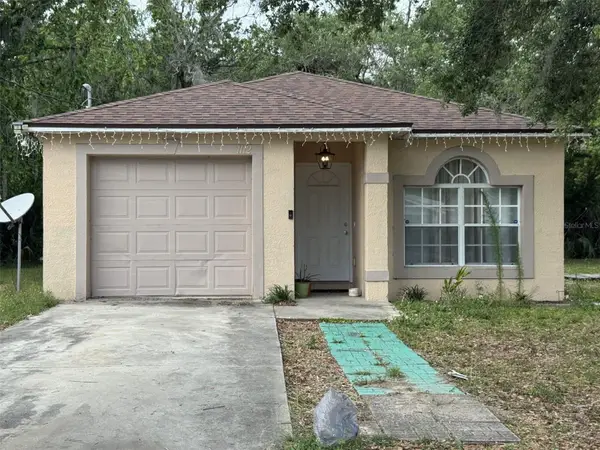 $240,000Active3 beds 2 baths1,205 sq. ft.
1112 W 7th Street, SANFORD, FL 32771
MLS# O6408763Listed by: LPT REALTY, LLC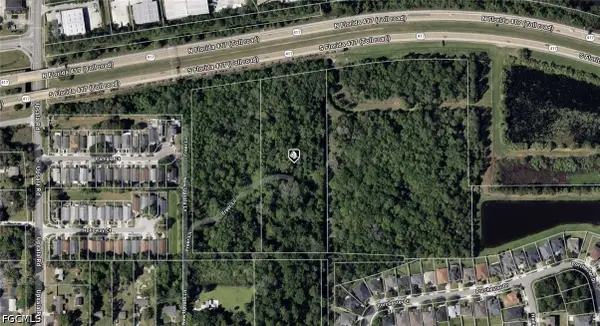 $140,000Active5.62 Acres
1570 Freer Lane, Sanford, FL 32771
MLS# 2026022425Listed by: KELLER WILLIAMS ISLAND LIFE RE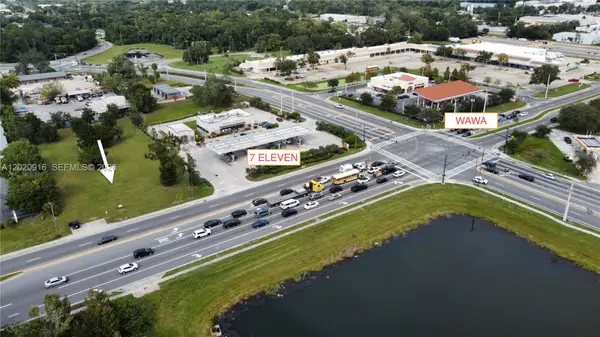 $1,200,000Active0 Acres
2700 W 25th Street Unit #parcel B, Sanford, FL 32771
MLS# A12020916Listed by: MAJESTIC PROPERTIES LLC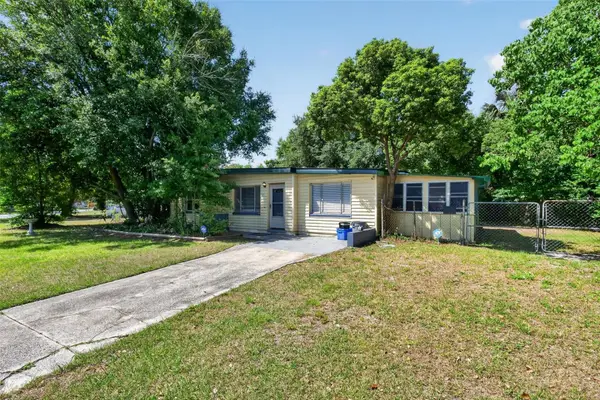 $145,000Pending2 beds 1 baths720 sq. ft.
101 Club Road, SANFORD, FL 32771
MLS# O6408417Listed by: SET HOMES REALTY LLC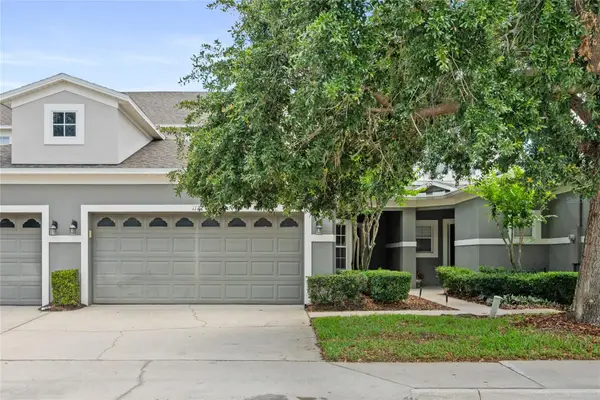 $360,000Active3 beds 3 baths1,914 sq. ft.
1127 Travertine Terrace, SANFORD, FL 32771
MLS# O6408504Listed by: LEGACY REALTY & BROKERS LLC $375,000Active4 beds 2 baths2,021 sq. ft.
210 Fairfield Drive, SANFORD, FL 32771
MLS# O6406698Listed by: INVESTOR'S REAL ESTATE LLC $299,999Pending2 beds 1 baths1,066 sq. ft.
2400 Orange Avenue, SANFORD, FL 32771
MLS# O6408392Listed by: KONA REALTY SERVICES LLC $39,000Active0.13 Acres
Sipes Avenue, SANFORD, FL 32771
MLS# O6408193Listed by: LPT REALTY, LLC $530,000Pending4 beds 2 baths2,126 sq. ft.
7468 Aprelle Drive, SANFORD, FL 32771
MLS# O6408255Listed by: ASSIST 2 SELL FOUTZ REALTY $759,990Active5 beds 5 baths3,783 sq. ft.
854 River Stone Trail, SANFORD, FL 32771
MLS# O6407459Listed by: KELLER WILLIAMS REALTY AT THE PARKS $639,990Active5 beds 4 baths3,120 sq. ft.
1140 Basalt Lane, SANFORD, FL 32771
MLS# O6407669Listed by: KELLER WILLIAMS ADVANTAGE REALTY $999,990Active5 beds 5 baths3,784 sq. ft.
1205 Basalt Lane, SANFORD, FL 32771
MLS# O6407326Listed by: KELLER WILLIAMS ADVANTAGE REALTY $739,990Active5 beds 4 baths3,783 sq. ft.
1148 Basalt Lane, SANFORD, FL 32771
MLS# O6407640Listed by: KELLER WILLIAMS ADVANTAGE REALTY $689,990Active5 beds 4 baths3,556 sq. ft.
1136 Basalt Lane, SANFORD, FL 32771
MLS# O6407308Listed by: KELLER WILLIAMS ADVANTAGE REALTY $340,000Pending4 beds 3 baths1,752 sq. ft.
2602 River Landing Drive, SANFORD, FL 32771
MLS# O6408102Listed by: KGV REALTY GROUP $1,649,000Active4 beds 4 baths4,219 sq. ft.
1900 Lake Markham Preserve Trail, SANFORD, FL 32771
MLS# O6407460Listed by: RE/MAX 200 REALTY $369,000Active3 beds 3 baths2,039 sq. ft.
475 Merry Brook Circle, SANFORD, FL 32771
MLS# O6407449Listed by: COLDWELL BANKER REALTY $27,500Active0 Acres
25-19-30-5AG-0Y00-009A Inaccesible Track, Sanford, FL 32771
MLS# 2026021783Listed by: KELLER WILLIAMS ISLAND LIFE RE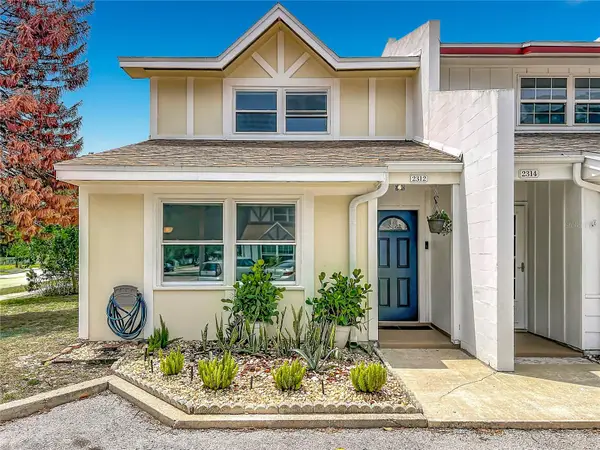 $212,000Active2 beds 2 baths1,126 sq. ft.
2312 S Park Avenue, SANFORD, FL 32771
MLS# O6407499Listed by: REALTY HUB $475,000Pending5 beds 3 baths2,170 sq. ft.
111 Carmel Bay Drive, SANFORD, FL 32771
MLS# O6406792Listed by: WEMERT GROUP REALTY LLC $289,000Active3 beds 2 baths1,228 sq. ft.
117 Meadow Boulevard, SANFORD, FL 32771
MLS# O6407094Listed by: SLOANE REALTY, LLC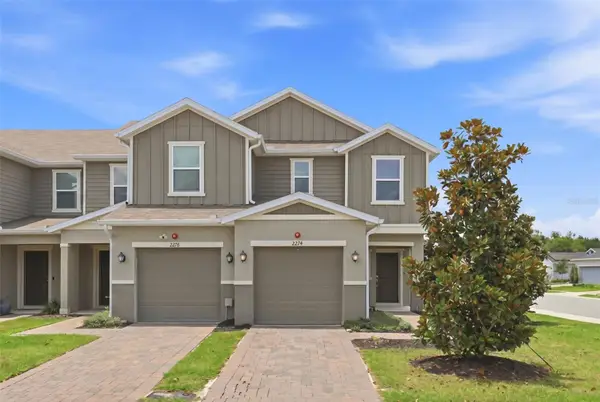 $325,000Active3 beds 3 baths1,700 sq. ft.
2274 Carrabelle Way, SANFORD, FL 32771
MLS# O6407139Listed by: HOME WISE REALTY GROUP, INC. $720,000Active5 beds 3 baths2,746 sq. ft.
304 Still Forest Terrace, SANFORD, FL 32771
MLS# V4948948Listed by: DASH REAL ESTATE COMPANY $379,900Active4 beds 2 baths1,874 sq. ft.
145 Wheatfield Circle, SANFORD, FL 32771
MLS# O6406684Listed by: KELLER WILLIAMS WINTER PARK $449,999Pending4 beds 3 baths2,476 sq. ft.
313 Willowbay Ridge Street, SANFORD, FL 32771
MLS# O6405082Listed by: THE AGENCY FL $200,000Pending3 beds 1 baths1,011 sq. ft.
1501 Wynnewood Drive, SANFORD, FL 32771
MLS# O6406931Listed by: THE C SMITH REAL ESTATE GROUP LLC $320,000Active2 beds 2 baths1,792 sq. ft.
5192 Maxon Ter #101, SANFORD, FL 32771
MLS# O6406797Listed by: FOLIO REALTY LLC $1,423,650Active5 beds 6 baths4,903 sq. ft.
448 Marina Louis Point #13, SANFORD, FL 32771
MLS# O6406356Listed by: K HOVNANIAN FLORIDA REALTY $540,000Pending4 beds 2 baths2,060 sq. ft.
6735 Sylvan Woods Drive, SANFORD, FL 32771
MLS# O6404314Listed by: RE/MAX CENTRAL REALTY $355,000Pending5 beds 2 baths2,136 sq. ft.
2406 Decottes Avenue, SANFORD, FL 32771
MLS# V4948943Listed by: GLORY INTL. REAL ESTATE CO $287,000Active3 beds 3 baths1,437 sq. ft.
1160 Twin Trees Lane, SANFORD, FL 32771
MLS# O6403362Listed by: WATSON REALTY CORP $625,000Active5 beds 5 baths3,272 sq. ft.
1919 Sipes Avenue, SANFORD, FL 32771
MLS# O6404819Listed by: KGV REALTY GROUP $510,000Active4 beds 2 baths2,223 sq. ft.
213 Brushcreek Drive, SANFORD, FL 32771
MLS# V4948960Listed by: LPT REALTY LLC $420,000Pending4 beds 2 baths2,021 sq. ft.
399 Fairfield Drive, SANFORD, FL 32771
MLS# O6406029Listed by: LANDSHARK REALTY $375,000Active3 beds 3 baths1,953 sq. ft.
1422 Travertine Terrace, SANFORD, FL 32771
MLS# O6406052Listed by: LPT REALTY, LLC $400,000Pending4 beds 4 baths1,929 sq. ft.
5327 Factors Walk Drive, SANFORD, FL 32771
MLS# O6400223Listed by: THE AGENCY FL $279,000Active2 beds 1 baths700 sq. ft.
1112/1114 S Bay Avenue, SANFORD, FL 32771
MLS# V4948944Listed by: HOME WISE REALTY GROUP, INC.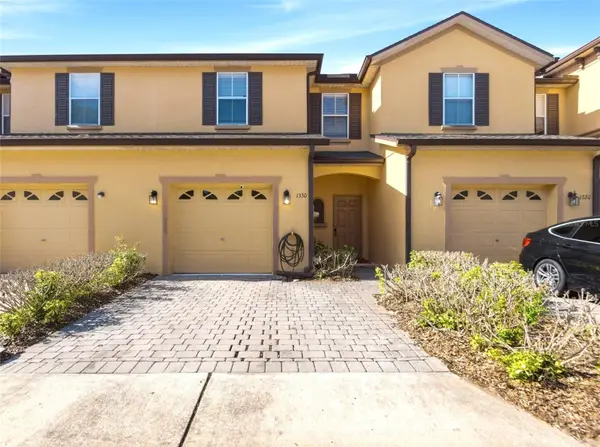 $249,900Active3 beds 3 baths1,203 sq. ft.
1330 Long Oak Way, SANFORD, FL 32771
MLS# TB8497414Listed by: SILVER DOOR REALTY LLC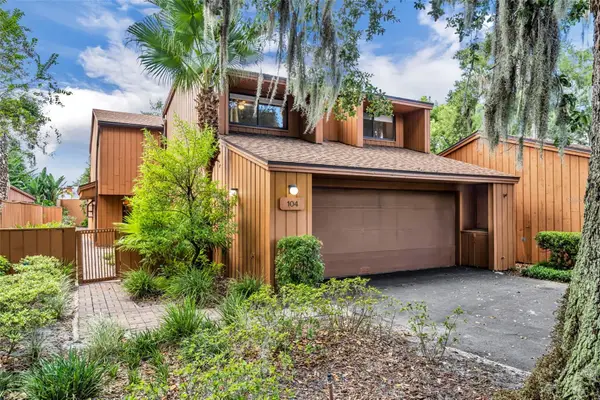 $349,000Pending3 beds 3 baths2,014 sq. ft.
104 Oaks Court, SANFORD, FL 32771
MLS# O6404644Listed by: FOLIO REALTY LLC $315,000Active3 beds 2 baths1,346 sq. ft.
1000 S Laurel Avenue, SANFORD, FL 32771
MLS# V4948934Listed by: LPT REALTY LLC $50,000Active0.13 Acres
46 Sr, SANFORD, FL 32771
MLS# A4692608Listed by: KELLER WILLIAMS ISLAND LIFE REAL ESTATE $519,000Active4 beds 3 baths2,002 sq. ft.
117 Hadley Drive, SANFORD, FL 32771
MLS# V4948898Listed by: STELLA REALTY GROUP, LLC $239,000Active1 beds 1 baths704 sq. ft.
220 Avocado Avenue, SANFORD, FL 32771
MLS# O6404761Listed by: WATSON REALTY CORP $550,000Pending3 beds 2 baths1,965 sq. ft.
800 Upsala Road, SANFORD, FL 32771
MLS# O6403297Listed by: BEYCOME OF FLORIDA LLC $475,000Active4 beds 3 baths2,170 sq. ft.
122 Carmel Bay Drive, SANFORD, FL 32771
MLS# O6402946Listed by: REDFIN CORPORATION $275,000Active3 beds 3 baths1,642 sq. ft.
2726 River Landing Drive, SANFORD, FL 32771
MLS# O6403900Listed by: CHARLES RUTENBERG REALTY ORLANDO $1,499,999Pending5 beds 4 baths3,046 sq. ft.
5425 Nevada Avenue, SANFORD, FL 32771
MLS# O6404338Listed by: CFRP REALTY LLC $349,500Pending3 beds 3 baths1,463 sq. ft.
118 Royalty Circle, SANFORD, FL 32771
MLS# O6404328Listed by: SOUTHERN REALTY ENTERPRISES $599,900Active5 beds 3 baths2,904 sq. ft.
4914 Grassendale Terrace, SANFORD, FL 32771
MLS# O6403285Listed by: SOVEREIGN REALTY INVESTMENTS LLC $425,000Active3 beds 2 baths1,416 sq. ft.
1209 S Myrtle Avenue #A, SANFORD, FL 32771
MLS# O6400129Listed by: ALPHA EQUITY REALTY & MANAGEMENT INC $529,000Pending3 beds 3 baths2,419 sq. ft.
3937 Ceremony Cove, SANFORD, FL 32771
MLS# O6403709Listed by: COLDWELL BANKER REALTY $379,000Active4 beds 3 baths1,881 sq. ft.
1317 Douglas Street, SANFORD, FL 32771
MLS# O6403906Listed by: JR REALTY GROUP LLC $425,000Active3 beds 2 baths1,416 sq. ft.
1209 S Myrtle Avenue, SANFORD, FL 32771
MLS# O6401014Listed by: ALPHA EQUITY REALTY & MANAGEMENT INC $404,500Active4 beds 2 baths1,815 sq. ft.
3285 Eastgrove Ter, SANFORD, FL 32771
MLS# O6404156Listed by: TOP LINE REALTY $1,080,000Active4 beds 3 baths2,993 sq. ft.
6361 Bordeaux Circle, SANFORD, FL 32771
MLS# S5148929Listed by: TOP AGENCY REALTY INC $315,000Active3 beds 2 baths1,071 sq. ft.
844 Rosalia Drive, SANFORD, FL 32771
MLS# O6403993Listed by: KELLER WILLIAMS WINTER PARK $600,000Active0.97 Acres
241 Nova Drive, SANFORD, FL 32771
MLS# O6395942Listed by: PORZIG REALTY $799,000Active4 beds 4 baths2,788 sq. ft.
863 Oakbranch Place, SANFORD, FL 32771
MLS# O6403291Listed by: FOLIO REALTY LLC $389,900Active4 beds 2 baths2,141 sq. ft.
449 Kays Landing Drive, SANFORD, FL 32771
MLS# O6403727Listed by: HOLLOMAN GORDON REALTY, INC. $549,900Pending5 beds 3 baths2,626 sq. ft.
3323 New Bremen Court, SANFORD, FL 32771
MLS# O6403000Listed by: LPT REALTY LLC $394,900Active3 beds 3 baths1,940 sq. ft.
5335 Factors Walk Drive, SANFORD, FL 32771
MLS# O6401635Listed by: CHARLES RUTENBERG REALTY ORLANDO $709,000Active4 beds 4 baths3,136 sq. ft.
6502 Everingham Lane, SANFORD, FL 32771
MLS# O6403329Listed by: RE/MAX CENTRAL REALTY $50,000Pending0.78 Acres
2018 Grandview Avenue N, SANFORD, FL 32771
MLS# A4691861Listed by: KELLER WILLIAMS ISLAND LIFE REAL ESTATE $1,998,000Active5 beds 5 baths5,713 sq. ft.
859 Isle Point, SANFORD, FL 32771
MLS# O6398129Listed by: ONE LUXURY INTERNATIONAL LLC $219,000Active2 beds 1 baths852 sq. ft.
1806 Redding Place, SANFORD, FL 32771
MLS# O6403168Listed by: LPT REALTY, LLC $289,000Active3 beds 3 baths1,409 sq. ft.
2111 Retreat View Circle, SANFORD, FL 32771
MLS# O6402381Listed by: MILLENIUM REALTY GROUP $385,000Active3 beds 3 baths2,177 sq. ft.
632 Venice Place, SANFORD, FL 32771
MLS# O6402269Listed by: KELLER WILLIAMS ADVANTAGE REALTY $483,000Active4 beds 3 baths2,285 sq. ft.
5640 Siracusa Lane, SANFORD, FL 32771
MLS# O6402629Listed by: THE KEY REALTY GROUP $689,000Pending3 beds 2 baths2,227 sq. ft.
2336 Northumbria Drive, SANFORD, FL 32771
MLS# O6402830Listed by: CHARLES RUTENBERG REALTY ORLANDO $425,000Active4 beds 3 baths2,804 sq. ft.
158 Pinefield Drive, SANFORD, FL 32771
MLS# O6402343Listed by: HOME WISE REALTY GROUP, INC. $549,000Active4 beds 3 baths2,123 sq. ft.
3540 Stonebriar Lane, SANFORD, FL 32771
MLS# O6402301Listed by: HORIZON WEST REALTY $224,999Active4 beds 2 baths1,984 sq. ft.
1307 Historic Goldsboro Boulevard, SANFORD, FL 32771
MLS# O6402267Listed by: DALTON WADE INC $649,900Active0.64 Acres
601 Tuscany Court, SANFORD, FL 32771
MLS# O6402249Listed by: PREMIER SOTHEBYS INT'L REALTY $330,000Pending4 beds 2 baths1,576 sq. ft.
2433 Chase Avenue, SANFORD, FL 32771
MLS# A4691095Listed by: SAVVY AVENUE, LLC $440,000Pending4 beds 2 baths1,974 sq. ft.
235 Venetian Bay Circle, SANFORD, FL 32771
MLS# O6401765Listed by: RE/MAX TOWN & COUNTRY REALTY $30,000Active0.24 Acres
34-19-30-5AK-0A00-0470 Inaccessible Track, SANFORD, FL 32771
MLS# A4691088Listed by: KELLER WILLIAMS ISLAND LIFE REAL ESTATE $30,000Active0 Acres
34-19-30-5AK-0A00-0470 Inaccessible Trail, Sanford, FL 32771
MLS# 2026018703Listed by: KELLER WILLIAMS ISLAND LIFE RE $337,990Pending3 beds 3 baths1,699 sq. ft.
408 Beryl Cove, SANFORD, FL 32771
MLS# O6401618Listed by: PULTE REALTY OF NORTH FLORIDA LLC $338,890Pending3 beds 3 baths1,699 sq. ft.
412 Beryl Cove, SANFORD, FL 32771
MLS# O6401587Listed by: PULTE REALTY OF NORTH FLORIDA LLC $337,790Pending3 beds 3 baths1,699 sq. ft.
416 Beryl Cove, SANFORD, FL 32771
MLS# O6401583Listed by: PULTE REALTY OF NORTH FLORIDA LLC $315,000Active3 beds 3 baths1,687 sq. ft.
5012 Hawkstone Drive, SANFORD, FL 32771
MLS# O6400632Listed by: ALPHA EQUITY REALTY & MANAGEMENT INC $33,000Active0 Acres
1515 Bell Avenue, Sanford, FL 32771
MLS# 2026018374Listed by: KELLER WILLIAMS ISLAND LIFE RE $460,000Pending3 beds 2 baths1,818 sq. ft.
5068 Greylock Court, SANFORD, FL 32771
MLS# O6400781Listed by: SPECTRUM PROPERTY GROUP LLC $539,990Pending4 beds 3 baths2,194 sq. ft.
870 River Stone Trail, SANFORD, FL 32771
MLS# O6400823Listed by: KELLER WILLIAMS ADVANTAGE REALTY $728,505Active5 beds 4 baths3,556 sq. ft.
1144 Basalt Lane, SANFORD, FL 32771
MLS# O6400840Listed by: KELLER WILLIAMS ADVANTAGE REALTY $338,590Pending3 beds 3 baths1,699 sq. ft.
404 Beryl Cove, SANFORD, FL 32771
MLS# O6401155Listed by: PULTE REALTY OF NORTH FLORIDA LLC $184,999Active0.39 Acres
000 E 4th, SANFORD, FL 32771
MLS# O6400960Listed by: YASMINE KHRINO $25,000Active0.07 Acres
TBD Celery Avenue, SANFORD, FL 32771
MLS# O6400940Listed by: INVESTOR'S REAL ESTATE LLC $699,900Active6 beds 3 baths3,120 sq. ft.
1138 Franklin Tree Lane, SANFORD, FL 32771
MLS# O6400720Listed by: KGV REALTY GROUP $455,000Active4 beds 4 baths3,012 sq. ft.
210 Pinefield Drive, SANFORD, FL 32771
MLS# O6399556Listed by: SAND DOLLAR REALTY GROUP INC $450,000Pending3 beds 2 baths1,689 sq. ft.
6100 Markham Road, SANFORD, FL 32771
MLS# O6400841Listed by: PREMIER SOTHEBYS INT'L REALTY $426,000Active4 beds 3 baths2,844 sq. ft.
457 Marathon Lane, SANFORD, FL 32771
MLS# O6400803Listed by: OPENDOOR BROKERAGE LLC $210,000Pending2 beds 2 baths1,155 sq. ft.
611 Sanford Avenue, SANFORD, FL 32771
MLS# O6399523Listed by: SLOANE REALTY, LLC $459,900Pending6 beds 4 baths3,479 sq. ft.
2560 Bullion Loop, SANFORD, FL 32771
MLS# TB8499025Listed by: OFFERPAD BROKERAGE FL, LLC $299,900Active3 beds 3 baths1,479 sq. ft.
2330 Carrabelle Way, SANFORD, FL 32771
MLS# O6400318Listed by: WEICHERT REALTORS HALLMARK PRO $715,000Active4 beds 3 baths2,711 sq. ft.
2210 Northumbria Drive, SANFORD, FL 32771
MLS# O6400300Listed by: KELLER WILLIAMS HERITAGE REALTY $355,000Active3 beds 3 baths1,839 sq. ft.
229 Rustic Loop, SANFORD, FL 32771
MLS# O6399263Listed by: DALTON WADE INC $1,395,000Pending4 beds 4 baths4,225 sq. ft.
7738 Markham Bend Place, SANFORD, FL 32771
MLS# O6400049Listed by: KELLER WILLIAMS ADVANTAGE REALTY $342,000Active3 beds 3 baths1,647 sq. ft.
2181 Stockton Drive, SANFORD, FL 32771
MLS# V4948572Listed by: CHARLES RUTENBERG REALTY ORLANDO $250,000Pending1.07 Acres
0 Brisson Avenue Avenue, SANFORD, FL 32771
MLS# O6385018Listed by: COLDWELL BANKER REALTY $339,900Active4 beds 2 baths2,021 sq. ft.
383 Fairfield Drive, SANFORD, FL 32771
MLS# G5110956Listed by: EXP REALTY LLC $320,000Active3 beds 1 baths864 sq. ft.
2105 S Palmetto Avenue, SANFORD, FL 32771
MLS# O6398637Listed by: MEP REALTY INVESTMENTS LLC $319,900Active3 beds 2 baths1,778 sq. ft.
1304 W 16th Street, SANFORD, FL 32771
MLS# O6400065Listed by: SPECTRUM PROPERTY GROUP LLC $459,000Pending3 beds 2 baths2,113 sq. ft.
2009 Lily Court, SANFORD, FL 32771
MLS# O6399819Listed by: KGV REALTY GROUP $425,000Active3 beds 2 baths1,722 sq. ft.
3012 Eckerson Way, SANFORD, FL 32771
MLS# O6399738Listed by: KELLY PRICE & COMPANY LLC $799,900Active5 beds 4 baths3,448 sq. ft.
5113 Hawks Hammock Way, SANFORD, FL 32771
MLS# O6397924Listed by: KROLL REALTY GROUP $550,000Active0.13 Acres
215 Magnolia Avenue, SANFORD, FL 32771
MLS# O6399658Listed by: COLDWELL BANKER REALTY $405,000Active3 beds 2 baths2,002 sq. ft.
820 Pecan Avenue, SANFORD, FL 32771
MLS# O6397634Listed by: SYCHAR REALTY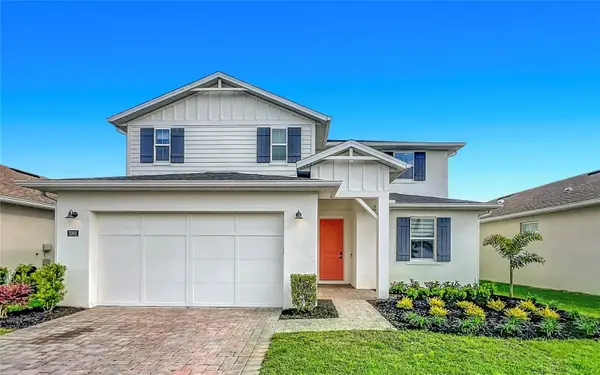 $635,000Active4 beds 3 baths3,123 sq. ft.
3392 Bluff Oak Lane, SANFORD, FL 32771
MLS# O6399508Listed by: COPPEROOSTER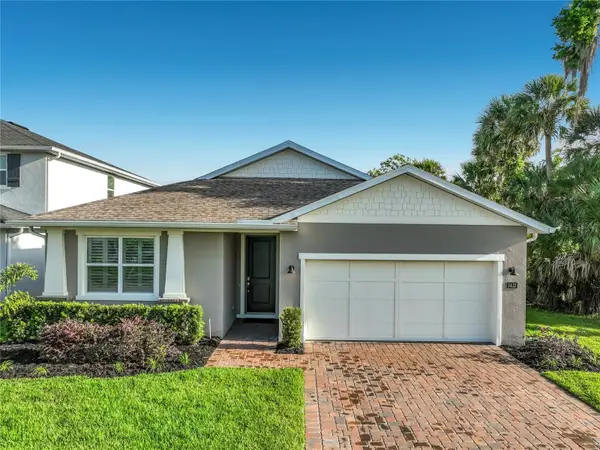 $549,500Active4 beds 3 baths2,280 sq. ft.
3412 Bluff Oak Lane, SANFORD, FL 32771
MLS# O6399596Listed by: COPPEROOSTER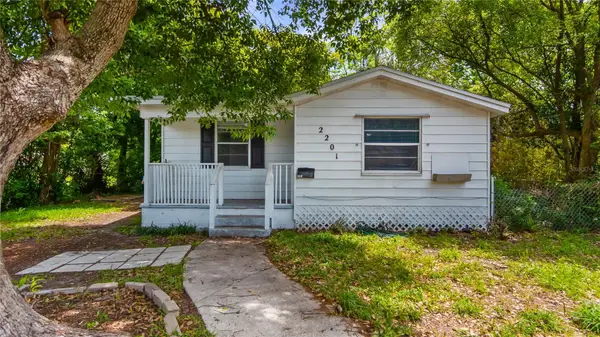 $182,500Active3 beds 2 baths888 sq. ft.
2201 Dolarway Street, SANFORD, FL 32771
MLS# O6399618Listed by: TC ORLANDO HOMES LLC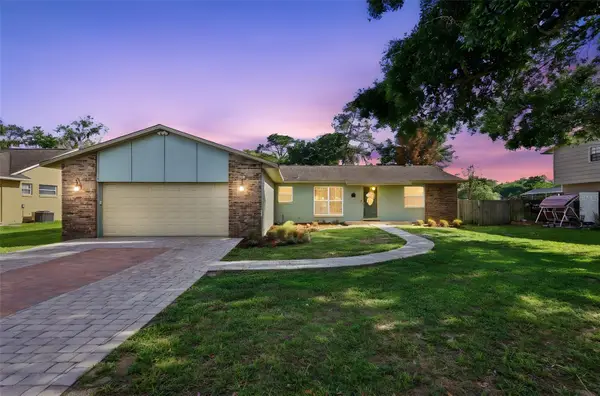 $435,000Pending3 beds 2 baths1,568 sq. ft.
103 Kaywood Drive, SANFORD, FL 32771
MLS# V4948492Listed by: KELLER WILLIAMS HERITAGE REALTY $315,000Active3 beds 3 baths1,680 sq. ft.
1305 Sandstone Run, SANFORD, FL 32771
MLS# O6399145Listed by: REDFIN CORPORATION $479,000Active5 beds 3 baths2,447 sq. ft.
3524 Sungrove Circle, SANFORD, FL 32771
MLS# O6398389Listed by: CHARLES RUTENBERG REALTY ORLANDO $689,000Active5 beds 6 baths3,972 sq. ft.
812 Sanford Avenue, SANFORD, FL 32771
MLS# OM722492Listed by: EPIQUE REALTY, INC. $494,900Active3 beds 2 baths1,955 sq. ft.
1619 Stargazer Terrace, SANFORD, FL 32771
MLS# O6397669Listed by: KROLL REALTY GROUP $324,900Pending3 beds 3 baths1,338 sq. ft.
253 Bella Rosa Circle, SANFORD, FL 32771
MLS# O6397788Listed by: LOVELAND PROPERTIES $270,000Active3 beds 2 baths1,056 sq. ft.
1105 Willow Avenue, SANFORD, FL 32771
MLS# O6398162Listed by: RE/MAX TOWN & COUNTRY REALTY $339,900Active3 beds 3 baths1,490 sq. ft.
242 Cedar Bark Lane, SANFORD, FL 32771
MLS# O6398255Listed by: COTTAGE REALTY INC $49,900Active0.27 Acres
Crawford Drive, SANFORD, FL 32771
MLS# O6398220Listed by: DIBS REALTY, LLC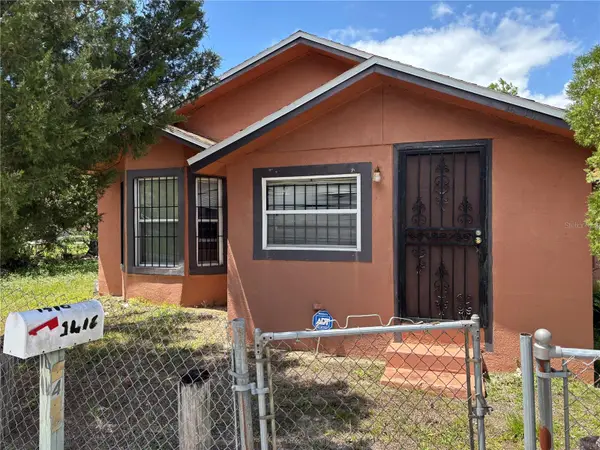 $129,900Pending2 beds 2 baths1,168 sq. ft.
1416 Southwest Road, SANFORD, FL 32771
MLS# O6398177Listed by: OUTLET REALTY $249,999Active3 beds 3 baths1,530 sq. ft.
3031 San Jacinto Circle #3031, SANFORD, FL 32771
MLS# O6397995Listed by: PREMIER SOTHEBYS INT'L REALTY $445,000Active4 beds 2 baths1,647 sq. ft.
1231 Dunbar Avenue, SANFORD, FL 32771
MLS# O6397727Listed by: SAMMY D SMITH PLLC $625,000Active5 beds 4 baths3,499 sq. ft.
4887 Cains Wren Trail, SANFORD, FL 32771
MLS# O6393298Listed by: WATSON REALTY CORP $299,999Active2 beds 3 baths1,000 sq. ft.
2951 Kings Road, SANFORD, FL 32771
MLS# O6394838Listed by: KELLER WILLIAMS REALTY AT THE PARKS $850,000Active6 beds 4 baths3,686 sq. ft.
216 Juniper Ridge Court, SANFORD, FL 32771
MLS# O6396797Listed by: BALDWIN PARK REALTY LLC $615,000Pending4 beds 3 baths2,424 sq. ft.
1790 Pacific Avenue, SANFORD, FL 32771
MLS# G5110574Listed by: LPT REALTY, LLC $299,999Pending3 beds 2 baths1,386 sq. ft.
1721 Travertine Terrace, SANFORD, FL 32771
MLS# O6394036Listed by: COLDWELL BANKER REALTY $579,900Active4 beds 3 baths2,154 sq. ft.
2045 Washington Avenue, SANFORD, FL 32771
MLS# O6397446Listed by: LPT REALTY, LLC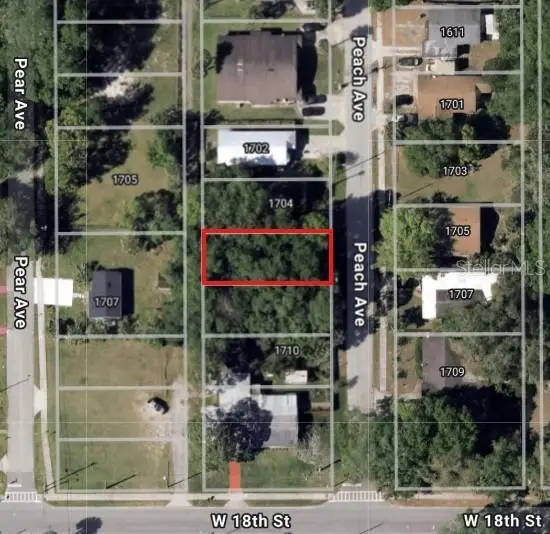 $44,900Active0.09 Acres
Peach Avenue, SANFORD, FL 32771
MLS# O6397002Listed by: SLOANE REALTY, LLC $459,500Active3 beds 3 baths1,663 sq. ft.
4560 Dulwik Place, SANFORD, FL 32771
MLS# TB8493782Listed by: REDFIN CORPORATION $380,000Active4 beds 3 baths2,476 sq. ft.
161 Walnut Crest Run, SANFORD, FL 32771
MLS# V4948384Listed by: LPT REALTY LLC $42,250Pending0.12 Acres
Mccarthy Avenue, SANFORD, FL 32771
MLS# O6395036Listed by: TOTAL R E CONSULTANTS INC $190,000Pending2 beds 1 baths936 sq. ft.
801 S Bay Avenue, SANFORD, FL 32771
MLS# O6397213Listed by: YELLOW DOOR REALTY LLC $300,000Active3 beds 3 baths1,575 sq. ft.
2338 Carrabelle Way, SANFORD, FL 32771
MLS# O6392854Listed by: WEMERT GROUP REALTY LLC $369,900Active3 beds 3 baths2,048 sq. ft.
2208 Community Way, SANFORD, FL 32771
MLS# V4947554Listed by: SOUTHERN EXCLUSIVE REALTY CORP $349,900Active3 beds 3 baths2,173 sq. ft.
1740 Travertine Terrace, SANFORD, FL 32771
MLS# O6374989Listed by: KELLER WILLIAMS HERITAGE REALTY $499,900Pending3 beds 2 baths2,163 sq. ft.
136 Wood Ridge Trail, SANFORD, FL 32771
MLS# O6396548Listed by: THE SHUGAN GROUP INC $415,000Active4 beds 3 baths2,215 sq. ft.
186 Cedar Ridge Lane, SANFORD, FL 32771
MLS# V4948302Listed by: DASH REAL ESTATE COMPANY $439,900Pending3 beds 2 baths2,146 sq. ft.
116 Wood Ridge Trail, SANFORD, FL 32771
MLS# O6396461Listed by: CHARLES RUTENBERG REALTY ORLANDO $375,000Active3 beds 2 baths1,571 sq. ft.
395 Tangelo Drive, SANFORD, FL 32771
MLS# O6396163Listed by: CHARLES RUTENBERG REALTY ORLANDO $300,000Pending3 beds 2 baths1,498 sq. ft.
810 Pecan Avenue, SANFORD, FL 32771
MLS# S5147165Listed by: REAL BROKER, LLC $225,000Pending2 beds 3 baths1,138 sq. ft.
1950 Stockton Drive, SANFORD, FL 32771
MLS# O6395872Listed by: WEICHERT REALTORS HALLMARK PRO $259,000Active3 beds 2 baths1,200 sq. ft.
1406 W 15th Street, SANFORD, FL 32771
MLS# O6396033Listed by: EMPIRE NETWORK REALTY $399,900Pending3 beds 2 baths1,821 sq. ft.
3074 New Ashford Way, SANFORD, FL 32771
MLS# O6395785Listed by: KELLER WILLIAMS ADVANTAGE REALTY $265,000Active2 beds 3 baths1,555 sq. ft.
1111 Levensor Court, SANFORD, FL 32771
MLS# O6395181Listed by: LEGENDS REALTY $625,000Active6 beds 4 baths3,391 sq. ft.
1502 Ashdown Court, SANFORD, FL 32771
MLS# O6393557Listed by: FOLIO REALTY LLC $415,000Active3 beds 3 baths1,714 sq. ft.
1375 Captiva Cove, SANFORD, FL 32771
MLS# S5147020Listed by: LPT REALTY, LLC $779,990Active5 beds 5 baths3,783 sq. ft.
750 River Stone Trail, SANFORD, FL 32771
MLS# O6388564Listed by: KELLER WILLIAMS ADVANTAGE REALTY $337,000Active3 beds 3 baths1,687 sq. ft.
5166 Hawkstone Drive, SANFORD, FL 32771
MLS# O6395414Listed by: LIFESTYLE INTERNATIONAL REALTY $699,900Active4 beds 3 baths2,862 sq. ft.
204 Brynwood Lane, SANFORD, FL 32771
MLS# O6395191Listed by: FLORIDIAN REAL ESTATE GROUP $149,900Active2 beds 1 baths925 sq. ft.
2319 S Summerlin Avenue, Sanford, FL 32771
MLS# B26009451Listed by: GERRITY REALTY INC. $200,000Pending2 beds 3 baths1,687 sq. ft.
2160 Stockton Drive, SANFORD, FL 32771
MLS# O6395084Listed by: KELLER WILLIAMS ADVANTAGE III $129,999Active2 beds 1 baths972 sq. ft.
3551 Washington St Street, Sanford, FL 32771
MLS# 2137645Listed by: FLORIDA HOMES REALTY & MTG LLC $579,400Active4 beds 2 baths2,071 sq. ft.
5477 Glen Oak Place, SANFORD, FL 32771
MLS# O6394955Listed by: EXP REALTY LLC $389,000Pending3 beds 3 baths1,940 sq. ft.
458 Ellis Square Court, SANFORD, FL 32771
MLS# O6394687Listed by: CHARLES RUTENBERG REALTY ORLANDO $279,900Active3 beds 2 baths1,107 sq. ft.
939 Moton Avenue, SANFORD, FL 32771
MLS# O6394915Listed by: UNITED REAL ESTATE PREFERRED $47,000Active0.09 Acres
939 Moton Avenue, SANFORD, FL 32771
MLS# O6394901Listed by: UNITED REAL ESTATE PREFERRED $527,000Active4 beds 4 baths2,585 sq. ft.
115 Big Spring Terrace, SANFORD, FL 32771
MLS# V4948175Listed by: HOME WISE REALTY GROUP, INC. $335,000Pending3 beds 2 baths1,713 sq. ft.
2395 Key Avenue, SANFORD, FL 32771
MLS# O6393845Listed by: ENTERA REALTY LLC $1,200,000Active4 beds 5 baths3,384 sq. ft.
587 Broadoak Loop, SANFORD, FL 32771
MLS# O6393794Listed by: CHARLES RUTENBERG REALTY ORLANDO $316,900Active3 beds 2 baths1,334 sq. ft.
1606 Peach Avenue, SANFORD, FL 32771
MLS# O6394371Listed by: UNITED REAL ESTATE PREFERRED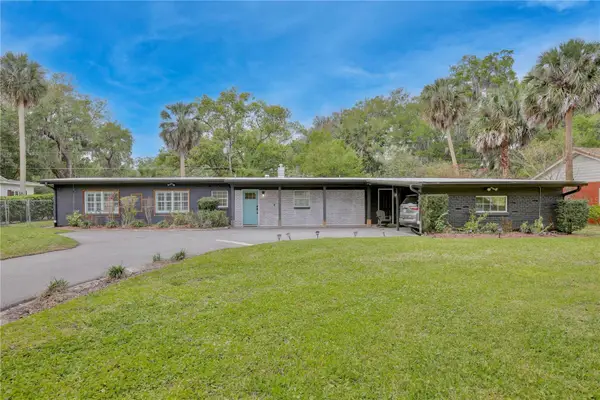 $479,900Pending4 beds 2 baths1,960 sq. ft.
116 N Virginia Avenue, SANFORD, FL 32771
MLS# O6391692Listed by: KGV REALTY GROUP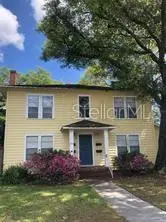 $615,000Active4 beds 4 baths2,412 sq. ft.
1113 S Park Avenue, SANFORD, FL 32771
MLS# O6393050Listed by: PORZIG REALTY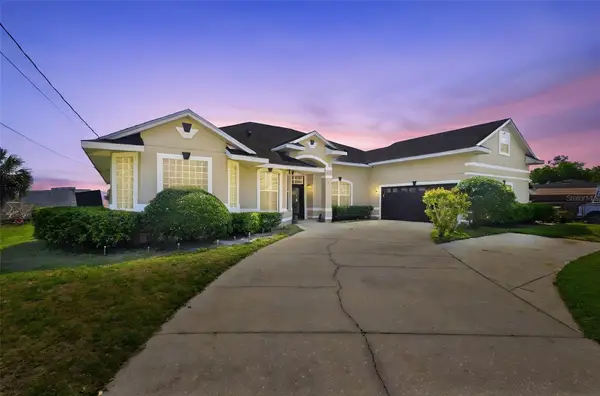 $519,900Active5 beds 4 baths3,348 sq. ft.
1051 Dunbar Avenue, SANFORD, FL 32771
MLS# O6393808Listed by: KELLER WILLIAMS HERITAGE REALTY $400,000Active3 beds 2 baths1,520 sq. ft.
802 S Palmetto Avenue, SANFORD, FL 32771
MLS# O6390177Listed by: KELLER WILLIAMS REALTY AT THE LAKES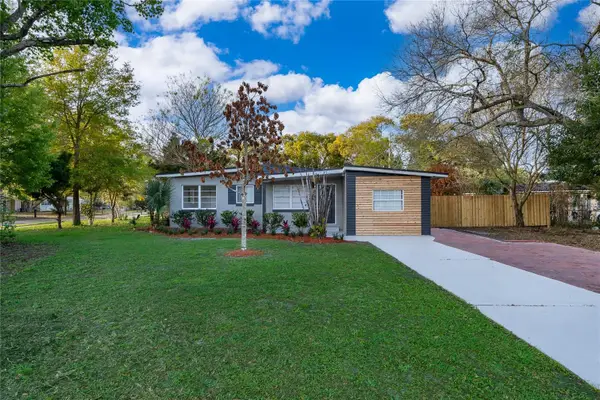 $304,900Pending3 beds 2 baths1,028 sq. ft.
101 Country Club Drive, SANFORD, FL 32771
MLS# O6393786Listed by: COMPASS FLORIDA LLC $499,999Active5 beds 5 baths3,717 sq. ft.
209 E 5th Street, SANFORD, FL 32771
MLS# O6393728Listed by: PETRA WORLDWIDE $40,000Pending0.12 Acres
W W 7th Street, SANFORD, FL 32771
MLS# G5110104Listed by: BONJORN REAL ESTATE $1,312,990Active5 beds 5 baths4,290 sq. ft.
424 Marina Louis Point #7, SANFORD, FL 32771
MLS# O6393119Listed by: K HOVNANIAN FLORIDA REALTY $57,000Active0.14 Acres
1116 W 8th Street, SANFORD, FL 32771
MLS# O6389934Listed by: WYNNMORE REALTY LLC $386,990Active3 beds 3 baths1,544 sq. ft.
543 Southern Edge Way, SANFORD, FL 32771
MLS# O6393333Listed by: KELLER WILLIAMS ADVANTAGE REALTY $1,199,990Active5 beds 4 baths3,428 sq. ft.
423 Marina Louis Point #26, SANFORD, FL 32771
MLS# O6393108Listed by: K HOVNANIAN FLORIDA REALTY $670,000Pending4 beds 3 baths2,630 sq. ft.
5059 Knotty Pine Court, SANFORD, FL 32771
MLS# O6392917Listed by: ANNE ROGERS REALTY GROUP INC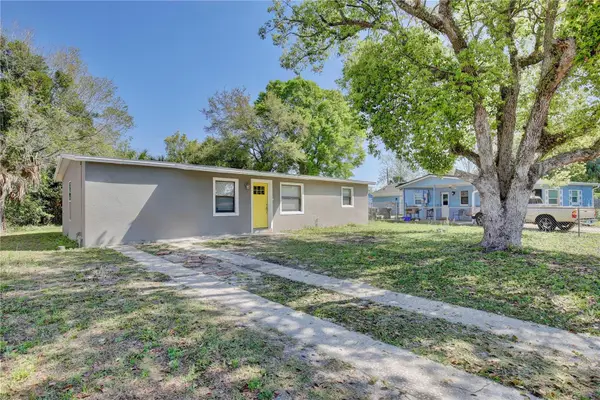 $230,000Pending3 beds 2 baths1,152 sq. ft.
136 Academy Avenue, SANFORD, FL 32771
MLS# O6393032Listed by: LPT REALTY, LLC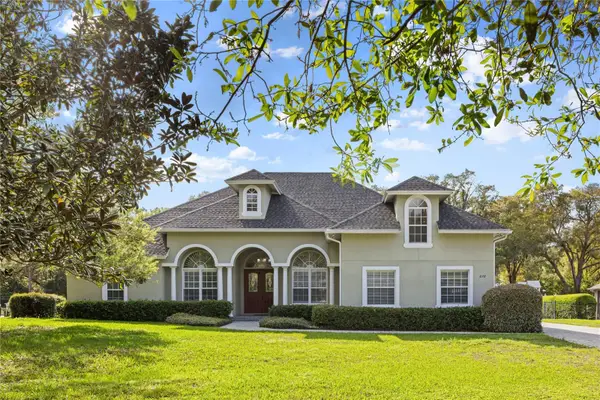 $945,000Pending5 beds 4 baths3,226 sq. ft.
878 Cardinal Pointe Cove, SANFORD, FL 32771
MLS# O6392707Listed by: PREMIER SOTHEBYS INT'L REALTY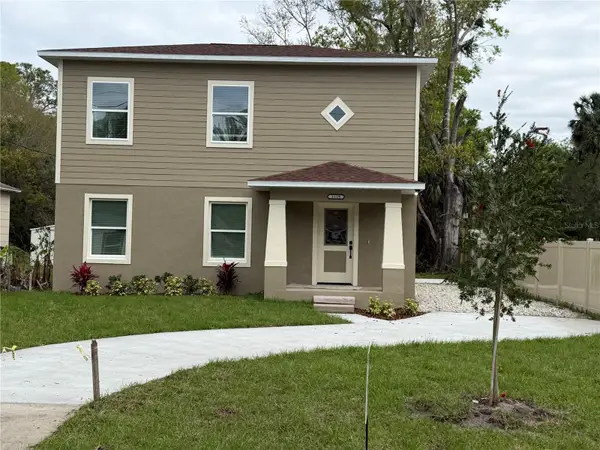 $399,000Active4 beds 3 baths1,968 sq. ft.
1119 Willow Avenue, SANFORD, FL 32771
MLS# O6390695Listed by: ERA GRIZZARD REAL ESTATE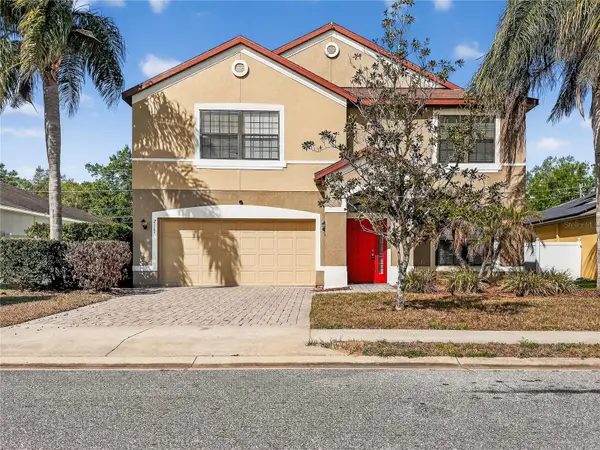 $430,000Pending5 beds 3 baths2,722 sq. ft.
2117 Lilipetal Court, SANFORD, FL 32771
MLS# G5109892Listed by: COAST TO COAST REAL ESTATE PRO $465,000Active5 beds 5 baths3,012 sq. ft.
102 Wheatfield Circle, SANFORD, FL 32771
MLS# O6392537Listed by: EMPIRE NETWORK REALTY $1,630,000Active5 beds 6 baths4,561 sq. ft.
7341 Bella Foresta Place, Sanford, FL 32771
MLS# 1224308Listed by: VENTURE DEVELOPMENT REALTY, INC $289,000Pending3 beds 3 baths1,203 sq. ft.
2440 Retreat View Circle, SANFORD, FL 32771
MLS# O6391755Listed by: EXP REALTY LLC $339,500Pending3 beds 3 baths1,587 sq. ft.
391 Cape Honeysuckle Place, SANFORD, FL 32771
MLS# O6391614Listed by: YELLOW DOOR REALTY LLC $395,000Pending4 beds 3 baths1,769 sq. ft.
378 Cape Honeysuckle Place, SANFORD, FL 32771
MLS# O6391882Listed by: LOKATION $265,000Active3 beds 2 baths1,152 sq. ft.
2260 Dolarway Street, SANFORD, FL 32771
MLS# O6391869Listed by: KELLER WILLIAMS HERITAGE REALTY $224,900Active2 beds 2 baths1,214 sq. ft.
2210 San Jacinto Circle, SANFORD, FL 32771
MLS# O6391634Listed by: REAL BROKER, LLC $289,900Pending3 beds 2 baths1,057 sq. ft.
2005 Hartwell Avenue, SANFORD, FL 32771
MLS# O6391770Listed by: SPECTRUM PROPERTY GROUP LLC $799,900Pending5 beds 4 baths3,779 sq. ft.
1147 Franklin Tree Lane, SANFORD, FL 32771
MLS# O6391397Listed by: KGV REALTY GROUP $415,000Active3 beds 4 baths1,978 sq. ft.
544 Red Rose Lane, SANFORD, FL 32771
MLS# O6390584Listed by: WEMERT GROUP REALTY LLC $689,000Active5 beds 4 baths2,835 sq. ft.
4720 Nebraska Avenue, SANFORD, FL 32771
MLS# TB8486939Listed by: EPIQUE REALTY, INC. $264,900Pending3 beds 2 baths1,408 sq. ft.
5275 Maxon Terrace, SANFORD, FL 32771
MLS# O6390751Listed by: LPT REALTY, LLC $745,000Pending3 beds 3 baths2,380 sq. ft.
3682 Arbordale Loop, SANFORD, FL 32771
MLS# O6390892Listed by: ORLANDO TBI REALTY LLC $317,777Active3 beds 2 baths1,465 sq. ft.
125 Cedar Ridge Lane, SANFORD, FL 32771
MLS# O6389284Listed by: RE/MAX CENTRAL REALTY $699,000Active4 beds 3 baths2,975 sq. ft.
6220 Hedgesparrows Lane, SANFORD, FL 32771
MLS# TB8485992Listed by: LPT REALTY, LLC $399,900Active2 beds 3 baths1,627 sq. ft.
225 W Seminole Boulevard #308, SANFORD, FL 32771
MLS# O6390467Listed by: CHARLES RUTENBERG REALTY ORLANDO $425,000Pending4 beds 2 baths2,056 sq. ft.
1422 Savoy Lane, SANFORD, FL 32771
MLS# O6390282Listed by: WATERMAN REAL ESTATE, INC. $375,000Pending3 beds 3 baths1,562 sq. ft.
125 Meadow Boulevard, SANFORD, FL 32771
MLS# O6389583Listed by: COLDWELL BANKER REALTY $435,000Active4 beds 3 baths2,410 sq. ft.
3353 Eastgrove Terrace, SANFORD, FL 32771
MLS# O6389096Listed by: WEMERT GROUP REALTY LLC $339,900Pending3 beds 2 baths1,645 sq. ft.
2013 S Holly Avenue, SANFORD, FL 32771
MLS# O6389766Listed by: TURN-KEY MOVES REALTY $155,000Active2 beds 2 baths768 sq. ft.
2432 Chase Avenue, SANFORD, FL 32771
MLS# O6390139Listed by: HOLLOMAN GORDON REALTY, INC. $79,990Active0.18 Acres
2471 Greenway Street, SANFORD, FL 32771
MLS# O6389945Listed by: KELLER WILLIAMS LEGACY $179,000Active1.3 Acres
2400 Princeton, SANFORD, FL 32771
MLS# O6389545Listed by: OLDE TOWN BROKERS INC $215,000Active2 beds 1 baths1,116 sq. ft.
120 Club Road, SANFORD, FL 32771
MLS# O6389445Listed by: BHHS FLORIDA REALTY $769,990Pending5 beds 5 baths3,783 sq. ft.
742 River Stone Trail, SANFORD, FL 32771
MLS# O6388542Listed by: KELLER WILLIAMS ADVANTAGE REALTY $335,000Active3 beds 3 baths1,642 sq. ft.
302 Maybeck Court, SANFORD, FL 32771
MLS# O6388725Listed by: FULL CIR REAL ESTATE & MANAGEMENT LLC $1,100,000Active4 beds 4 baths3,374 sq. ft.
8297 Day Lily Place, SANFORD, FL 32771
MLS# OM720230Listed by: FLORIDA CAPITAL REALTY $385,000Active4 beds 2 baths1,955 sq. ft.
109 Islamorada Way, SANFORD, FL 32771
MLS# O6387827Listed by: MODERN WORLD REALTY LLC $300,000Active3 beds 2 baths1,218 sq. ft.
112 Avocado Avenue, SANFORD, FL 32771
MLS# O6386732Listed by: LPT REALTY, LLC $390,000Active4 beds 3 baths1,807 sq. ft.
170 Cape Honeysuckle Place, SANFORD, FL 32771
MLS# O6385213Listed by: KELLER WILLIAMS CLASSIC $379,990Pending3 beds 3 baths1,782 sq. ft.
426 Beryl Cove, SANFORD, FL 32771
MLS# O6387331Listed by: PULTE REALTY OF NORTH FLORIDA LLC $249,900Active2 beds 1 baths993 sq. ft.
2402 Stevens Avenue, SANFORD, FL 32771
MLS# O6387124Listed by: KARDOSH REALTY $377,990Pending3 beds 3 baths1,782 sq. ft.
446 Beryl Cove, SANFORD, FL 32771
MLS# O6387247Listed by: PULTE REALTY OF NORTH FLORIDA LLC $975,000Active4 beds 4 baths3,000 sq. ft.
950 Friends Court, SANFORD, FL 32771
MLS# O6386395Listed by: SOL INTERNATIONAL REALTY LLC $250,000Active2 beds 2 baths1,084 sq. ft.
1208 W 10th Street, SANFORD, FL 32771
MLS# O6387021Listed by: FIGLOFT INC $329,000Active3 beds 2 baths1,337 sq. ft.
2427 Princeton Avenue, SANFORD, FL 32771
MLS# O6386898Listed by: EPIQUE REALTY, INC. $1,250,000Active5.35 Acres
921 Vihlen Road, SANFORD, FL 32771
MLS# O6384102Listed by: SPECIALIZED PROPERTY MANAGEMENT $530,000Active3 beds 2 baths1,850 sq. ft.
2418 W 1st Street, SANFORD, FL 32771
MLS# TB8475362Listed by: KELLER WILLIAMS REALTY SMART $464,000Active4 beds 3 baths2,410 sq. ft.
2029 Apalachicola Lane, SANFORD, FL 32771
MLS# V4947584Listed by: LPT REALTY, LLC $340,000Active3 beds 3 baths1,447 sq. ft.
1216 S Pomegranite Avenue, SANFORD, FL 32771
MLS# O6385796Listed by: EG ORLANDO LLC $359,900Pending3 beds 3 baths1,509 sq. ft.
6104 Saint Julian Drive, SANFORD, FL 32771
MLS# O6385820Listed by: REAL BROKER, LLC $340,000Pending3 beds 3 baths1,447 sq. ft.
909 Pecan Avenue, SANFORD, FL 32771
MLS# O6385941Listed by: EG ORLANDO LLC $740,000Active1.38 Acres
1720 W 1st Street, SANFORD, FL 32771
MLS# O6385742Listed by: SLOANE REALTY, LLC $975,000Active4 beds 4 baths3,670 sq. ft.
6473 Everingham Lane, SANFORD, FL 32771
MLS# O6383642Listed by: REAL PROPERTY INTERNATIONAL $340,000Active3 beds 2 baths1,447 sq. ft.
1405 W 14th Street, SANFORD, FL 32771
MLS# O6385623Listed by: LPT REALTY, LLC $240,000Pending3 beds 1 baths1,268 sq. ft.
3032 Truman Boulevard, SANFORD, FL 32771
MLS# O6380848Listed by: PORZIG REALTY $390,000Pending4 beds 2 baths1,846 sq. ft.
3383 Hammond Point, SANFORD, FL 32771
MLS# O6384678Listed by: CHARLES RUTENBERG REALTY ORLANDO $230,000Active2 beds 3 baths1,138 sq. ft.
1450 Stockton Drive, SANFORD, FL 32771
MLS# O6385066Listed by: COLDWELL BANKER REALTY $219,900Active3 beds 1 baths1,010 sq. ft.
1307 Shepherd Avenue, SANFORD, FL 32771
MLS# O6383216Listed by: KELLER WILLIAMS ADVANTAGE 2 REALTY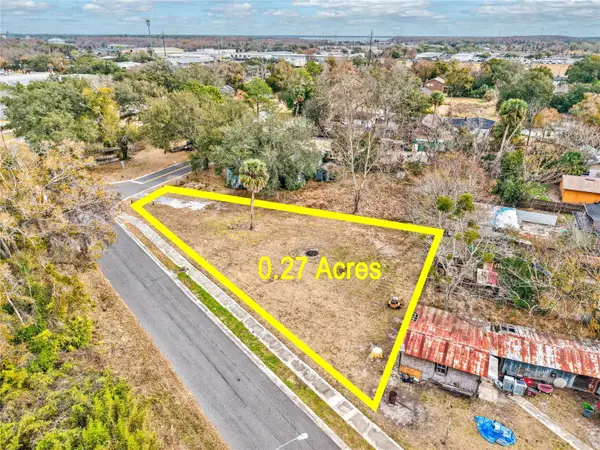 $79,900Active0.27 Acres
Mckay Street, SANFORD, FL 32771
MLS# S5144444Listed by: KELLER WILLIAMS LEGACY REALTY $748,000Active3 beds 4 baths3,080 sq. ft.
1031 Gloryland Court, SANFORD, FL 32771
MLS# O6384616Listed by: ORLANDO TBI REALTY LLC $635,000Active4 beds 3 baths2,625 sq. ft.
1058 Gloryland Court, SANFORD, FL 32771
MLS# O6384587Listed by: ORLANDO TBI REALTY LLC $395,000Active3 beds 3 baths1,802 sq. ft.
1371 Captiva Cove, SANFORD, FL 32771
MLS# O6384208Listed by: MLSB THE BUREAU POWERED BY CAROM REALTY $449,990Pending4 beds 3 baths2,261 sq. ft.
3536 Sungrove Circle, SANFORD, FL 32771
MLS# O6383115Listed by: CENTURY 21 ALTON CLARK $245,000Active2 beds 3 baths1,152 sq. ft.
803 Shropshire Loop, SANFORD, FL 32771
MLS# O6382992Listed by: INVESTOR'S REAL ESTATE LLC $330,000Active3 beds 3 baths1,379 sq. ft.
152 Cape Honeysuckle Place, SANFORD, FL 32771
MLS# O6383517Listed by: KELLER WILLIAMS REALTY AT THE PARKS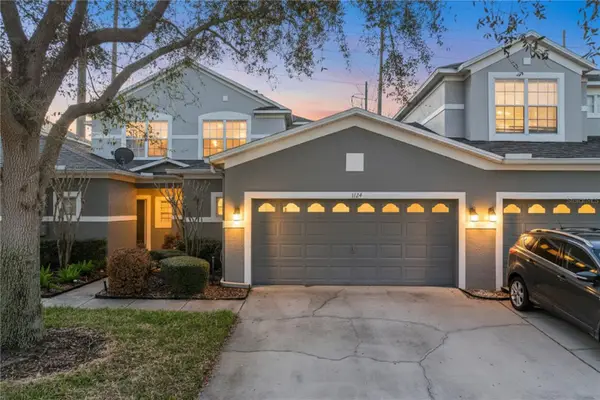 $304,999Active3 beds 3 baths1,680 sq. ft.
1124 Travertine Terrace, SANFORD, FL 32771
MLS# S5144096Listed by: THE FIRM RE $2,325,000Active5 beds 6 baths4,711 sq. ft.
601 Tuscany Court, SANFORD, FL 32771
MLS# O6383129Listed by: PREMIER SOTHEBYS INT'L REALTY $435,900Pending3 beds 2 baths1,493 sq. ft.
601 E 14th Street, SANFORD, FL 32771
MLS# O6381016Listed by: LEGACY REALTY & BROKERS LLC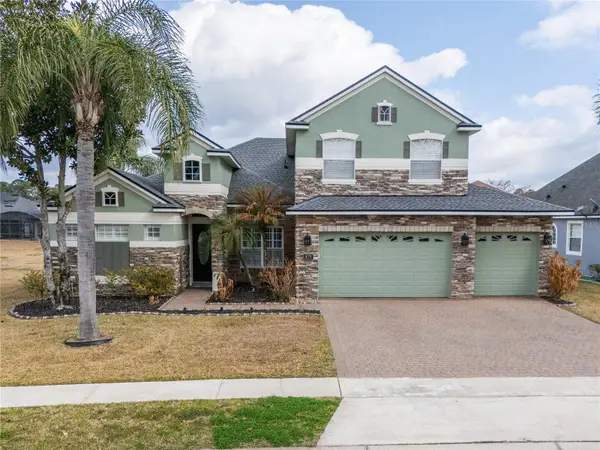 $675,000Active4 beds 3 baths2,833 sq. ft.
1679 Astor Farms Place, SANFORD, FL 32771
MLS# O6382059Listed by: ERA GRIZZARD REAL ESTATE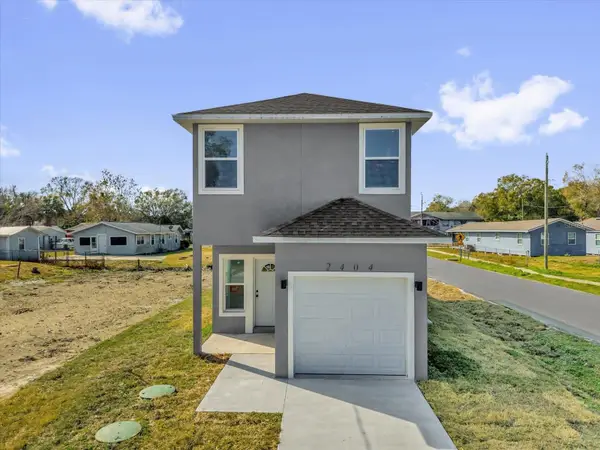 $325,000Active3 beds 3 baths1,285 sq. ft.
2404 Center Street, SANFORD, FL 32771
MLS# O6380939Listed by: LPT REALTY, LLC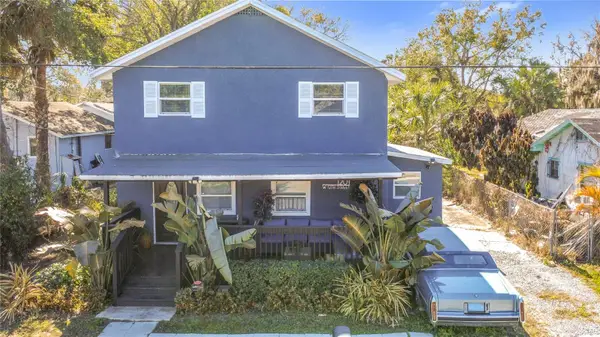 $289,000Active3 beds 2 baths1,272 sq. ft.
1201 W 12th Street, SANFORD, FL 32771
MLS# O6379028Listed by: FLORIDA ONE REAL ESTATE LLC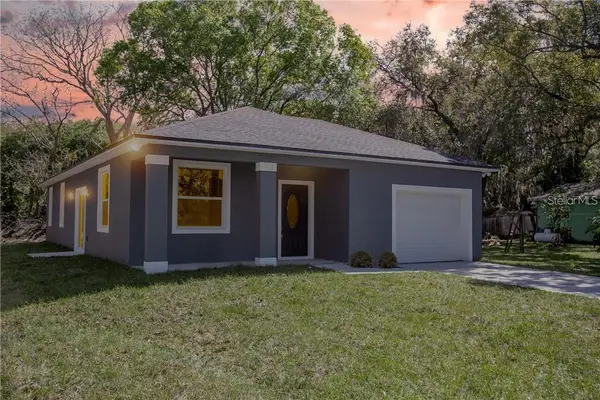 $299,000Active3 beds 2 baths1,422 sq. ft.
1777 Burrows Lane, SANFORD, FL 32771
MLS# O6380849Listed by: LIFESTYLE INTERNATIONAL REALTY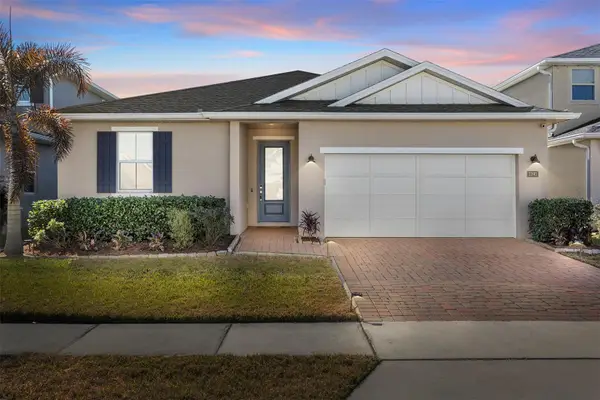 $549,990Active3 beds 2 baths2,226 sq. ft.
3393 Bluff Oak Lane, SANFORD, FL 32771
MLS# O6381065Listed by: CHARLES RUTENBERG REALTY ORLANDO $499,900Active3 beds 3 baths1,746 sq. ft.
0000 2nd, SANFORD, FL 32771
MLS# O6381392Listed by: SAND DOLLAR REALTY GROUP INC $265,000Pending3 beds 2 baths1,160 sq. ft.
1502 W 16th Street, SANFORD, FL 32771
MLS# O6380747Listed by: NOELKE REALTY $355,000Active3 beds 3 baths1,476 sq. ft.
1401 Captiva Cove #23, SANFORD, FL 32771
MLS# O6378625Listed by: CHARLES RUTENBERG REALTY ORLANDO
Local realty services provided by:CENTURY 21 Real Estate Champions, CENTURY 21 World Connection, CENTURY 21 Lighthouse Realty, CENTURY 21 Results, CENTURY 21 Move With Us, CENTURY 21 Sundance Realty
The information being provided by Stellar Mls is for the consumer's personal, non-commercial use and may not be used for any purpose other than to identify prospective properties consumer may be interested in purchasing. Any information relating to real estate for sale referenced on this web site comes from the Internet Data Exchange (IDX) program of the Stellar Mls. CENTURY 21 Real Estate Champions is not a Multiple Listing Service (MLS), nor does it offer MLS access. This website is a service of CENTURY 21 Real Estate Champions, a broker participant of Stellar Mls. This web site may reference real estate listing(s) held by a brokerage firm other than the broker and/or agent who owns this web site.
The accuracy of all information, regardless of source, including but not limited to open house information, square footages and lot sizes, is deemed reliable but not guaranteed and should be personally verified through personal inspection by and/or with the appropriate professionals. The data contained herein is copyrighted by Stellar Mls and is protected by all applicable copyright laws. Any unauthorized dissemination of this information is in violation of copyright laws and is strictly prohibited.
Properties in listings may have been sold or may no longer be available.
Copyright 2026 Stellar Mls. All rights reserved. MFRMLS Member Broker: Ruth Cabella
Information deemed reliable but not guaranteed. Information is provided, in part, by Greater Miami MLS. This information being provided is for consumer's personal, non-commercial use and may not be used for any other purpose other than to identify prospective properties consumers may be interested in purchasing.
Popular searches near 32771
Popular neighborhoods near 32771
- Deltona Lakes, Deltona homes for sale
- Dreamwold, Sanford homes for sale
- Glen Abbey, Debary homes for sale
- Heathrow, Lake Mary homes for sale
- Hidden Lake, Sanford homes for sale
- Highlands, Winter Springs homes for sale
- Lake Marie Estates, Debary homes for sale
- Land Of Lakes, Deltona homes for sale
- Longwood, Longwood homes for sale
- Midway, Sanford homes for sale
- North Orlando, Winter Springs homes for sale
- Orangedale, Orange City homes for sale
- Orlandia Heights, Debary homes for sale
- Parkst, Winter Springs homes for sale
- Plantation Estates, Debary homes for sale
- Primera, Lake Mary homes for sale
- Riviera Bella, Debary homes for sale
- Saint Josephs, Sanford homes for sale
- Savannah Park, Sanford homes for sale
- Timacuan, Lake Mary homes for sale
Counties near Sanford, 32771
- Alachua County homes for sale
- Bradford County homes for sale
- Brevard County homes for sale
- Citrus County homes for sale
- Clay County homes for sale
- Flagler County homes for sale
- Hernando County homes for sale
- Hillsborough County homes for sale
- Indian River County homes for sale
- Lake County homes for sale
- Marion County homes for sale
- Orange County homes for sale
- Osceola County homes for sale
- Pasco County homes for sale
- Polk County homes for sale
- Putnam County homes for sale
- St. Johns County homes for sale
- Seminole County homes for sale
- Sumter County homes for sale
- Volusia County homes for sale
Protect your home and budget from life's surprises with an Assurant Home Warranty, backed by a partner that supports you through every step of homeownership. Explore Plans.
©2026 Century 21 Real Estate LLC. All rights reserved. CENTURY 21®, the CENTURY 21 Logo and C21® are service marks owned by Century 21 Real Estate LLC. Century 21 Real Estate LLC fully supports the principles of the Fair Housing Act and the Equal Opportunity Act. Each office is independently owned and operated. Listing information is deemed reliable but not guaranteed accurate.