- Azalea Park homes for sale
- Bay Hill homes for sale
- Belle Isle homes for sale
- Conway homes for sale
- Doctor Phillips homes for sale
- Edgewood homes for sale
- Holden Heights homes for sale
- Holden Lakes homes for sale
- Hunters Creek homes for sale
- Meadow Woods homes for sale
- Oak Ridge homes for sale
- Orlovista homes for sale
- Pine Castle homes for sale
- Sky Lake homes for sale
- Southchase homes for sale
- Southwest Orange homes for sale
- Taft homes for sale
- Tangelo Park homes for sale
- Williamsburg homes for sale
- Windermere homes for sale
32809, FL - homes for rent
3 of 3 results displayed
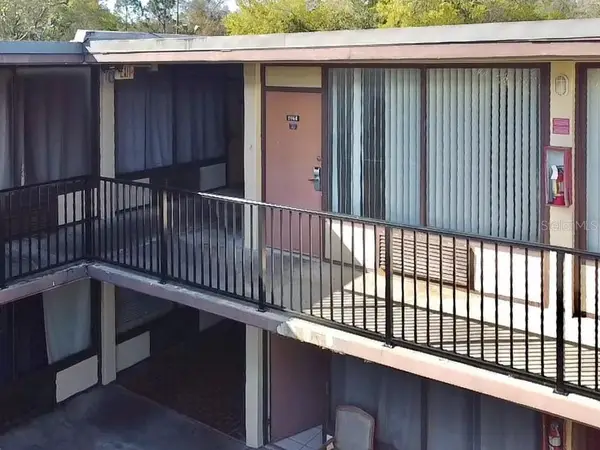
 $600 per monthActive1 beds 1 baths276 sq. ft.
7900 S Orange Blossom Trail #2066, ORLANDO, FL 32809
MLS# O6317491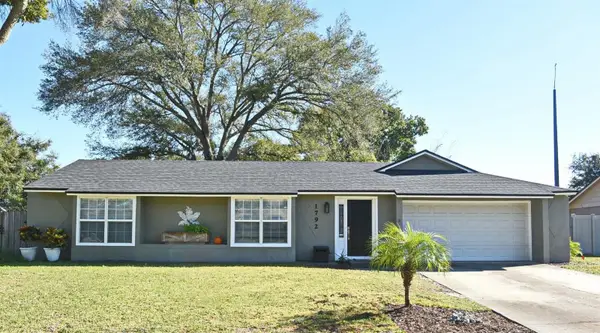 $2,500 per monthActive3 beds 2 baths1,994 sq. ft.
1792 Pam Circle, BELLE ISLE, FL 32809
MLS# O6253526 $950 per monthActive1 beds 1 baths276 sq. ft.
7900 S Orange Blossom Trail #2066, ORLANDO, FL 32809
MLS# O6181486
Popular searches near 32809
Popular neighborhoods near 32809
- Boggy Creek, Orlando homes for sale
- Catalina, Orlando homes for sale
- Conway, Orlando homes for sale
- Crescent Park, Orlando homes for sale
- Florida Center, Orlando homes for sale
- Florida Center North, Orlando homes for sale
- Holden Heights, Orlando homes for sale
- Holden Heights, Orlando homes for sale
- Johnson Village, Orlando homes for sale
- Millenia, Orlando homes for sale
- Oak Ridge, Orlando homes for sale
- Park Central, Orlando homes for sale
- Pine Castle, Orlando homes for sale
- Rio Grande Park, Orlando homes for sale
- Sky Lake, Orlando homes for sale
- South Orange, Orlando homes for sale
- Southport, Orlando homes for sale
- Taft, Orlando homes for sale
- Tangelo Park, Orlando homes for sale
- Wadeview Park, Orlando homes for sale
Counties near Orlando, 32809
- Brevard County homes for sale
- Citrus County homes for sale
- DeSoto County homes for sale
- Flagler County homes for sale
- Hardee County homes for sale
- Hernando County homes for sale
- Highlands County homes for sale
- Hillsborough County homes for sale
- Indian River County homes for sale
- Lake County homes for sale
- Marion County homes for sale
- Okeechobee County homes for sale
- Orange County homes for sale
- Osceola County homes for sale
- Pasco County homes for sale
- Polk County homes for sale
- Putnam County homes for sale
- Seminole County homes for sale
- Sumter County homes for sale
- Volusia County homes for sale
Protect your home and budget from life's surprises with an Assurant Home Warranty, backed by a partner that supports you through every step of homeownership. Explore Plans.
©2026 Century 21 Real Estate LLC. All rights reserved. CENTURY 21®, the CENTURY 21 Logo and C21® are service marks owned by Century 21 Real Estate LLC. Century 21 Real Estate LLC fully supports the principles of the Fair Housing Act and the Equal Opportunity Act. Each office is independently owned and operated. Listing information is deemed reliable but not guaranteed accurate.