- Aripeka homes for sale
- Bayonet Point homes for sale
- Beacon Square homes for sale
- Elfers homes for sale
- Heritage Pines homes for sale
- Hernando Beach homes for sale
- Hudson homes for sale
- Jasmine Estates homes for sale
- Meadow Oaks homes for sale
- Moon Lake homes for sale
- New Port Richey homes for sale
- New Port Richey East homes for sale
- Port Richey homes for sale
- Quail Ridge homes for sale
- River Ridge homes for sale
- Shady Hills homes for sale
- Spring Hill homes for sale
- Timber Pines homes for sale
- Weeki Wachee homes for sale
- Weeki Wachee Gardens homes for sale
34667, FL - homes for sale
300 of 653 results displayed
- New
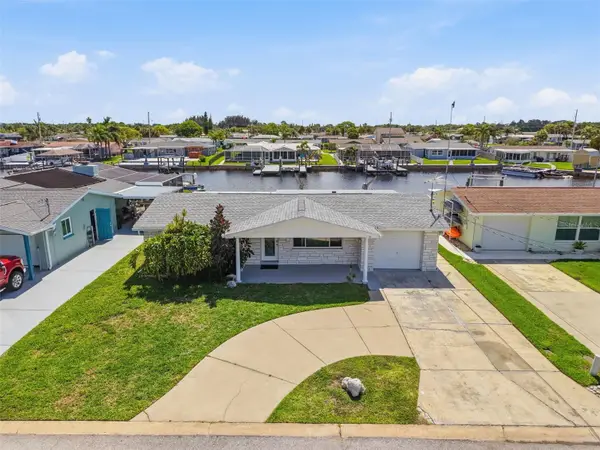
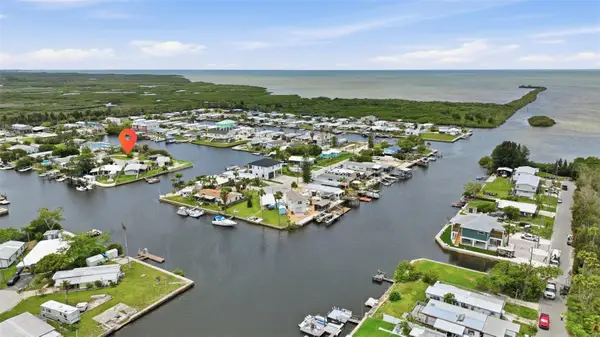
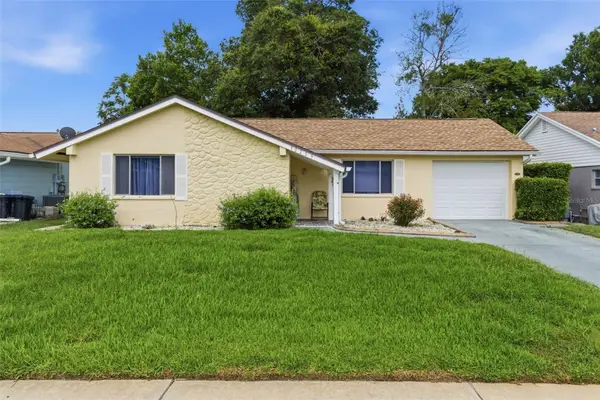
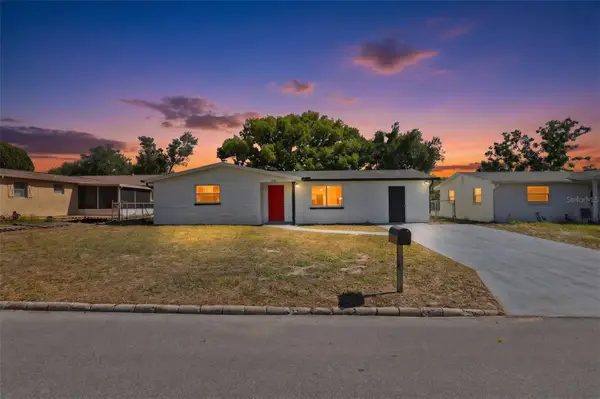
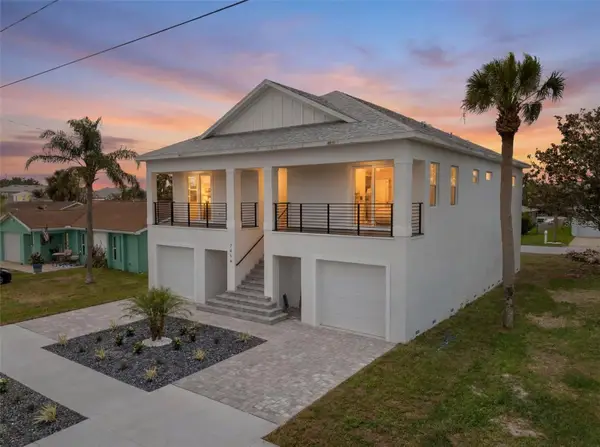 $690,000Active3 beds 3 baths2,004 sq. ft.
7414 Mako Drive, HUDSON, FL 34667
MLS# TB8516631Listed by: SPIEGEL LUXURY GROUP - New
 $90,000Active2 beds 2 baths960 sq. ft.
10339 Marinette Avenue, HUDSON, FL 34667
MLS# TB8516601Listed by: INSPIRED REALTY, LLC - New
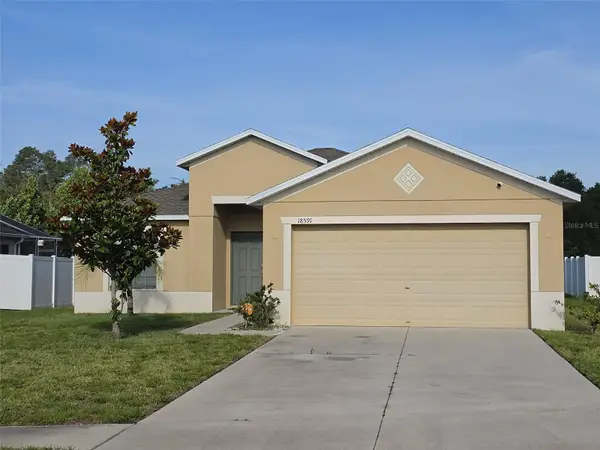 $299,000Active3 beds 2 baths1,360 sq. ft.
18591 Briar Oaks Drive, HUDSON, FL 34667
MLS# O6414610Listed by: LOKATION - Open Sat, 11am to 2pmNew
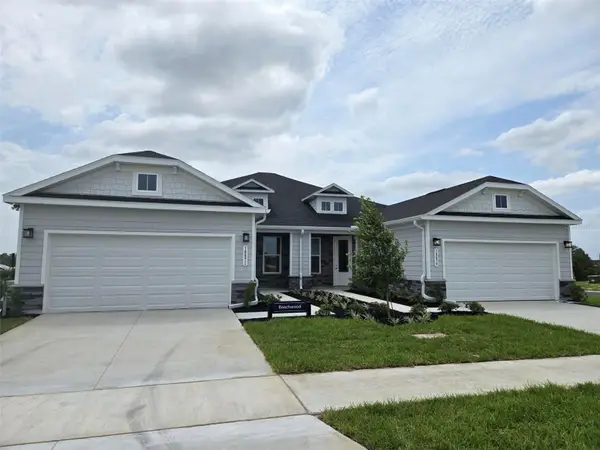
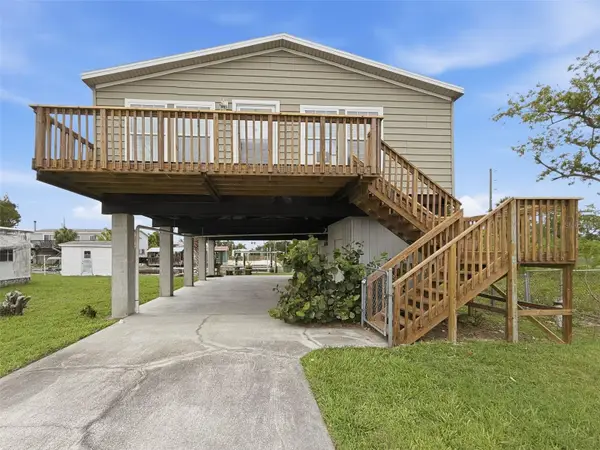
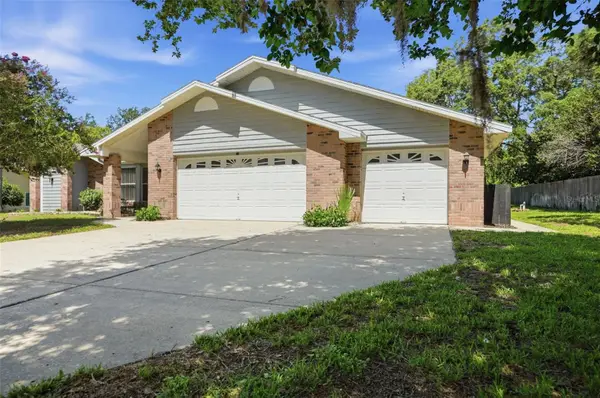 $465,000Active3 beds 3 baths1,967 sq. ft.
18451 Winding Oaks Boulevard, HUDSON, FL 34667
MLS# W7886480Listed by: WEICHERT REALTORS FL TROPICS - New
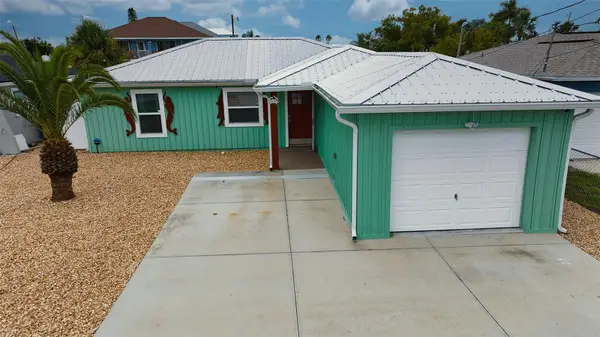
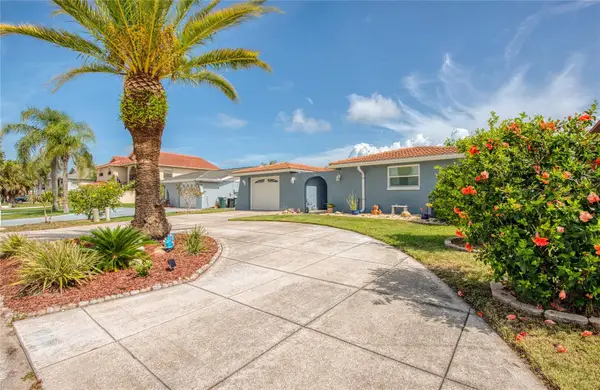
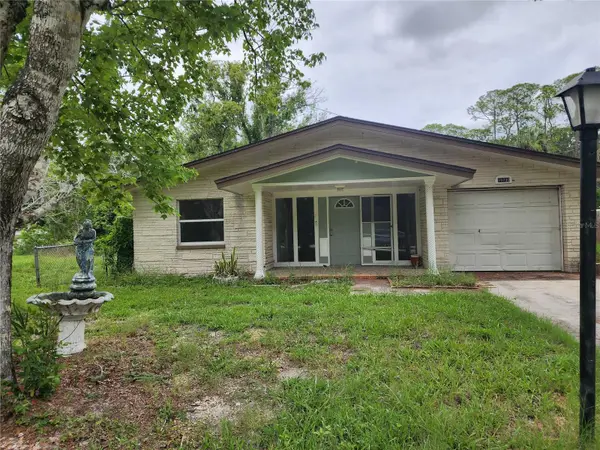 $120,000Active3 beds 2 baths1,252 sq. ft.
18730 Rosemary Road, HUDSON, FL 34667
MLS# W7886483Listed by: SIRROM REALTY LLC - New
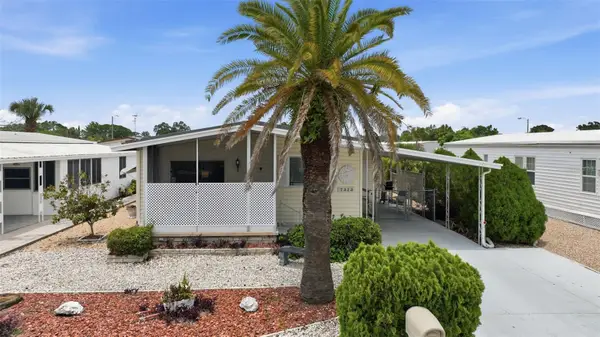
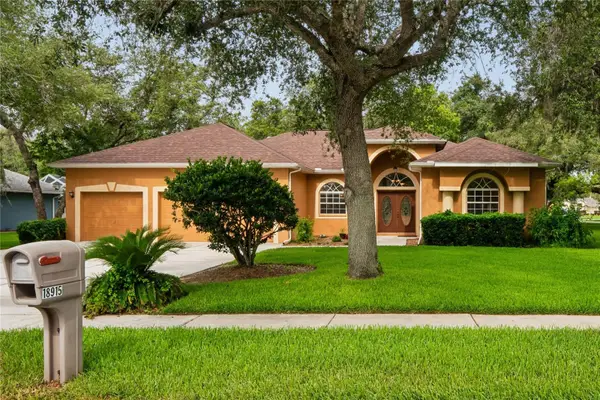 $385,000Active3 beds 2 baths2,164 sq. ft.
18915 Bascomb Lane, HUDSON, FL 34667
MLS# W7886491Listed by: TROPIC SHORES REALTY LLC - New
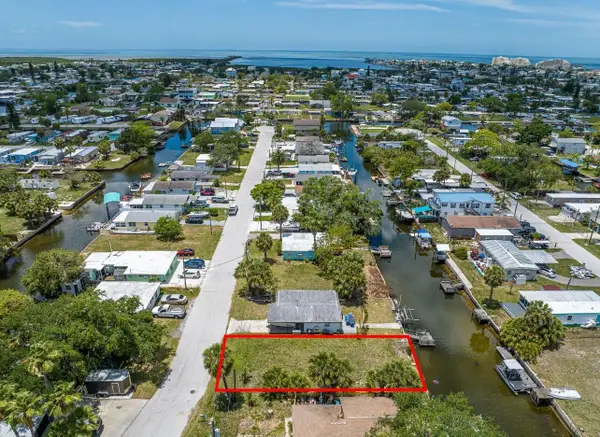
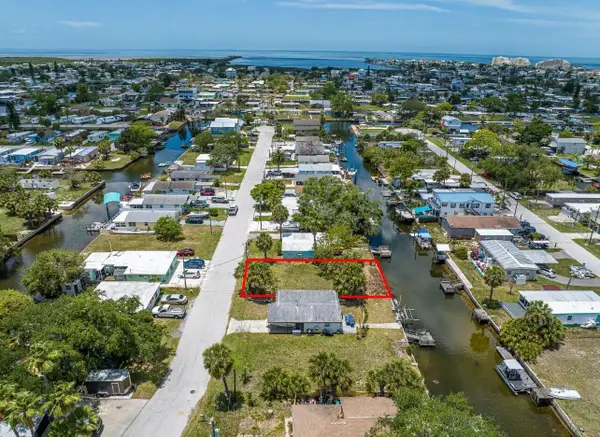
 $200,000Active3.47 Acres
7675 Detroit Avenue, Hudson, FL 34667
MLS# 2026024932Listed by: ICON REAL ESTATE AND ASSOCIATE  $700,000Pending4 beds 3 baths2,269 sq. ft.
6511 Clark Street, HUDSON, FL 34667
MLS# W7886449Listed by: LPT REALTY, LLC- New
 $319,900Active3 beds 2 baths1,979 sq. ft.
14551 Potterton Circle, HUDSON, FL 34667
MLS# TB8516074Listed by: BLACKSTONE REAL ESTATE SERVICES - New
 $319,900Active3 beds 2 baths1,672 sq. ft.
13316 Brigham Lane, HUDSON, FL 34667
MLS# TB8515207Listed by: RE/MAX ALLIANCE GROUP - New
 $365,000Active2 beds 2 baths1,192 sq. ft.
12800 5th Isle, HUDSON, FL 34667
MLS# W7886302Listed by: BHHS FLORIDA PROPERTIES GROUP - New
 $267,990Active3 beds 2 baths1,488 sq. ft.
18857 Emerald Summit Drive, SPRING HILL, FL 34610
MLS# W7886409Listed by: MALTBIE REALTY GROUP - New
 $474,000Active2 beds 2 baths1,214 sq. ft.
6420 Boatyard Drive, HUDSON, FL 34667
MLS# TB8507134Listed by: LPT REALTY, LLC - New
 $267,990Active3 beds 2 baths1,488 sq. ft.
18863 Emerald Summit Drive, SPRING HILL, FL 34610
MLS# W7886414Listed by: MALTBIE REALTY GROUP - New
 $276,720Active3 beds 2 baths1,488 sq. ft.
18720 Emerald Summit Drive, SPRING HILL, FL 34610
MLS# W7886423Listed by: MALTBIE REALTY GROUP - New
 $159,900Active2 beds 2 baths1,056 sq. ft.
7323 Grand Pine Drive, HUDSON, FL 34667
MLS# W7886220Listed by: WEICHERT REALTORS FL TROPICS - New
 $199,900Active0.27 Acres
13039 Port Court, HUDSON, FL 34667
MLS# W7886399Listed by: WEICHERT REALTORS FL TROPICS 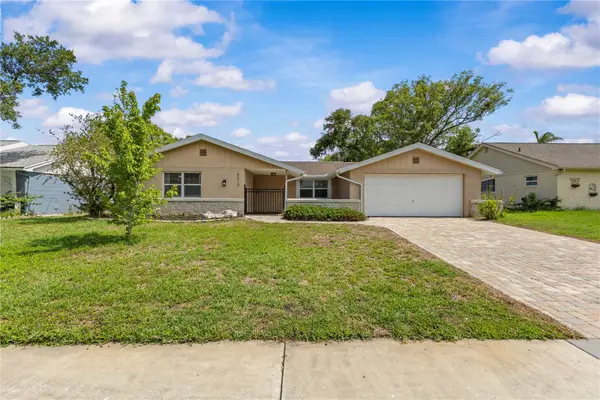 $242,500Pending2 beds 2 baths1,638 sq. ft.
8519 Arrowhead Drive, HUDSON, FL 34667
MLS# W7886356Listed by: CHARLES RUTENBERG REALTY INC- New
 $345,000Active2 beds 2 baths1,320 sq. ft.
6839 Curlew Lane, HUDSON, FL 34667
MLS# W7886282Listed by: FLORIDA LUXURY REALTY INC - New
 $610,000Active2 beds 2 baths1,786 sq. ft.
7039 Southwind Drive, HUDSON, FL 34667
MLS# W7886381Listed by: GULF COAST FISHING HOMES RLTY - New
 $479,900Active3 beds 2 baths2,375 sq. ft.
18162 Autumn Lake Boulevard, HUDSON, FL 34667
MLS# TB8514829Listed by: MIHARA & ASSOCIATES INC. - New
 $275,000Active3 beds 2 baths1,024 sq. ft.
7328 Mako Drive, HUDSON, FL 34667
MLS# TB8514980Listed by: REALTY ONE GROUP ADVANTAGE - New$129,000Active2 beds 2 baths1,464 sq. ft.
12521 Merry Lane, HUDSON, FL 34667
MLS# O6413037Listed by: EXIT REALTY PREMIER LEGACY - New
 $319,000Active2 beds 2 baths1,519 sq. ft.
8702 Powderhorn Row, HUDSON, FL 34667
MLS# W7886301Listed by: 1% LISTS CENTRAL FLORIDA - New
 $299,900Active2 beds 2 baths1,128 sq. ft.
12524 5th Isle, HUDSON, FL 34667
MLS# TB8514602Listed by: LAWRENCE W SCADUTO LLC - New
 $358,000Active3 beds 2 baths1,622 sq. ft.
18817 Parade Road, HUDSON, FL 34667
MLS# TB8514534Listed by: DALTON WADE INC - New
 $133,900Active2 beds 2 baths1,144 sq. ft.
12913 Fairway Drive #D, HUDSON, FL 34667
MLS# TB8514332Listed by: LAWRENCE W SCADUTO LLC - New
 $169,900Active2 beds 2 baths963 sq. ft.
12510 Cobble Stone Drive, HUDSON, FL 34667
MLS# W7886313Listed by: RE/MAX SUNSET REALTY - New
 $155,500Active2 beds 2 baths989 sq. ft.
7306 Grand Pine Drive, HUDSON, FL 34667
MLS# W7886297Listed by: F I GREY & SON RESIDENTIAL - New
 $20,000Active0.35 Acres
TBD Dayton, HUDSON, FL 34667
MLS# W7886260Listed by: SANDPEAK REALTY - New
 $359,000Active3 beds 2 baths1,974 sq. ft.
8404 Millwood Drive, HUDSON, FL 34667
MLS# TB8509975Listed by: CHARLES RUTENBERG REALTY INC - New
 $332,000Active3 beds 2 baths1,835 sq. ft.
8741 Braxton Drive, HUDSON, FL 34667
MLS# TB8513241Listed by: RE/MAX REALTEC GROUP INC - New
 $194,900Active4 beds 3 baths2,047 sq. ft.
8018 Wildflower Row, HUDSON, FL 34667
MLS# W7886267Listed by: REALTY EXECUTIVES AMERICA INC  $249,999Pending3 beds 3 baths1,344 sq. ft.
13006 Port Court, HUDSON, FL 34667
MLS# TB8513907Listed by: COMPASS FLORIDA LLC- New
 $400,000Active2 beds 1 baths1,062 sq. ft.
6416 Boatyard Drive, HUDSON, FL 34667
MLS# G5112982Listed by: KELLER WILLIAMS ELITE PARTNERS III REALTY - New
 $300,000Active3 beds 2 baths1,689 sq. ft.
8617 Stonehedge Way, HUDSON, FL 34667
MLS# TB8512977Listed by: ORCHARD BROKERAGE, LLC - New
 $58,000Active0.08 Acres
6845 Sanderling Lane, HUDSON, FL 34667
MLS# A4695320Listed by: COMPASS FLORIDA LLC - New
 $5,000Active4 beds 2 baths1,825 sq. ft.
12605 River Mill Drive, Other Florida, FL 34667
MLS# 400570Listed by: JAMIE L BOONE LLC - New
 $58,000Active0.08 Acres
6837 Sanderling Lane, HUDSON, FL 34667
MLS# A4695299Listed by: COMPASS FLORIDA LLC  $195,000Pending2 beds 2 baths1,068 sq. ft.
8705 Powderhorn Row, HUDSON, FL 34667
MLS# TB8513574Listed by: COASTAL PROPERTIES GROUP INTER- New
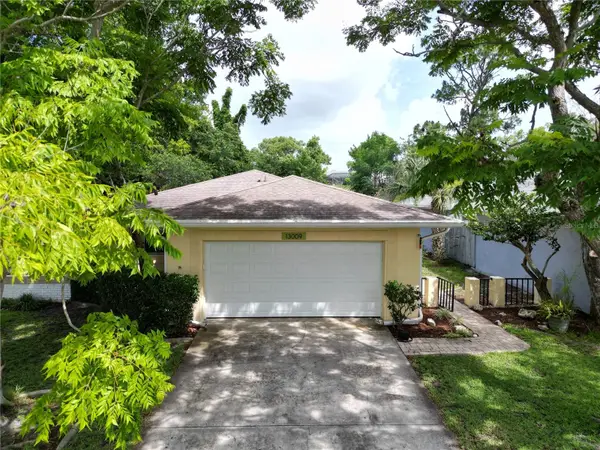 $275,000Active3 beds 2 baths1,356 sq. ft.
13009 Club Drive, HUDSON, FL 34667
MLS# TB8511362Listed by: KELLER WILLIAMS SUBURBAN TAMPA - New
 $799,900Active3 beds 3 baths2,995 sq. ft.
13063 Oldenburg Drive, HUDSON, FL 34667
MLS# TB8513559Listed by: LGI REALTY- FLORIDA, LLC - New
 $460,000Active4 beds 3 baths2,418 sq. ft.
13610 Morning Court, HUDSON, FL 34667
MLS# TB8512865Listed by: CENTURY 21 CIRCLE - New
 $69,900Active0.07 Acres
6836 Gull Lane, HUDSON, FL 34667
MLS# W7886206Listed by: GULF COAST FISHING HOMES RLTY - New
 $249,900Active2 beds 2 baths1,200 sq. ft.
12219 Quail Run Row, BAYONET POINT, FL 34667
MLS# W7886181Listed by: KELLER WILLIAMS REALTY- PALM H 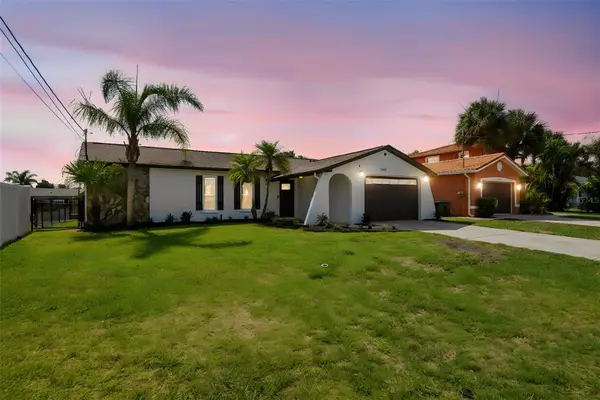 $394,900Active2 beds 2 baths1,266 sq. ft.
13840 Barnard Avenue, HUDSON, FL 34667
MLS# TB8510411Listed by: CHARLES RUTENBERG REALTY INC $345,000Active4 beds 3 baths2,348 sq. ft.
16206 Sea Pines Drive, HUDSON, FL 34667
MLS# OM725447Listed by: GAILEY ENTERPRISES REAL ESTATE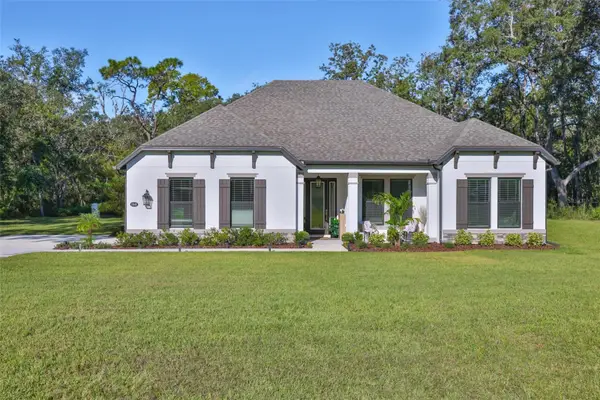 $699,000Active4 beds 2 baths2,672 sq. ft.
13148 Oldenburg Drive, HUDSON, FL 34667
MLS# TB8511125Listed by: IMPACT REALTY TAMPA BAY $149,000Active2 beds 2 baths873 sq. ft.
12049 Hoosier Court #203, HUDSON, FL 34667
MLS# TB8512230Listed by: AGILE GROUP REALTY $224,900Pending2 beds 2 baths840 sq. ft.
16433 Ramona Lane, HUDSON, FL 34667
MLS# TB8510773Listed by: BHHS FLORIDA PROPERTIES GROUP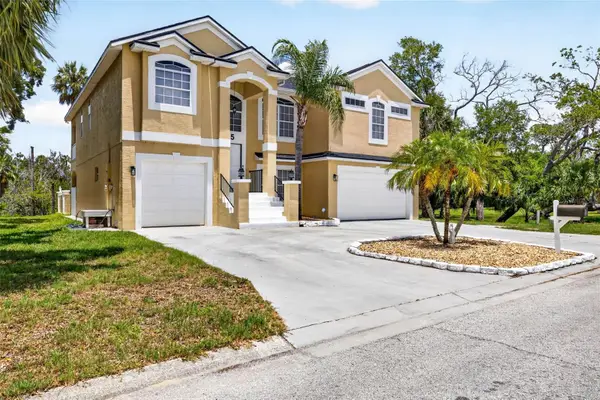 $500,000Active4 beds 3 baths2,168 sq. ft.
7445 Gulf Way, HUDSON, FL 34667
MLS# W7885987Listed by: SAILWINDS REALTY $359,000Active3 beds 2 baths1,276 sq. ft.
13714 Allyn Drive, HUDSON, FL 34667
MLS# TB8511997Listed by: MARK SPAIN REAL ESTATE $155,000Active2 beds 2 baths1,144 sq. ft.
12922 Wedgewood Way #A, HUDSON, FL 34667
MLS# TB8511875Listed by: CHARLES RUTENBERG REALTY INC $299,900Active3 beds 2 baths1,748 sq. ft.
8607 Longboat Lane, HUDSON, FL 34667
MLS# TB8511931Listed by: JPT REALTY LLC $295,000Pending3 beds 2 baths1,512 sq. ft.
17889 Thomas Boulevard, HUDSON, FL 34667
MLS# TB8511910Listed by: DEAL HOUSE REALTY LLC $249,000Active2 beds 2 baths1,330 sq. ft.
7206 Dorchester Court, HUDSON, FL 34667
MLS# TB8511668Listed by: LIPPLY REAL ESTATE $425,000Pending4 beds 3 baths1,873 sq. ft.
18749 Lansford Drive, HUDSON, FL 34667
MLS# V4949193Listed by: RHYNES REAL ESTATE $279,000Pending3 beds 2 baths1,652 sq. ft.
13617 Jennita Drive, HUDSON, FL 34667
MLS# W7885916Listed by: FLORIDA LUXURY REALTY INC $475,000Active3 beds 3 baths2,344 sq. ft.
8535 Caitlin Court, HUDSON, FL 34667
MLS# TB8511251Listed by: IMPACT REALTY TAMPA BAY $515,151Active3 beds 2 baths2,224 sq. ft.
14172 Faldo Court, HUDSON, FL 34667
MLS# TB8511262Listed by: CHARLES RUTENBERG REALTY INC $335,000Active3 beds 2 baths1,400 sq. ft.
14339 Rice Road, HUDSON, FL 34667
MLS# W7885904Listed by: BHHS FLORIDA PROPERTIES GROUP $256,900Active3 beds 2 baths1,532 sq. ft.
7412 University Drive, HUDSON, FL 34667
MLS# TB8508898Listed by: POWERS REAL ESTATE SOLUTIONS LLC $205,000Pending2 beds 2 baths1,260 sq. ft.
16032 Tree Line Drive, HUDSON, FL 34667
MLS# TB8510856Listed by: ALIGN RIGHT REALTY SUNCOAST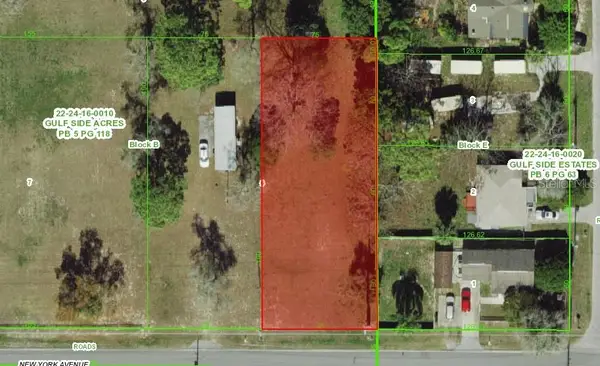 $42,000Active0.33 Acres
7719 New York Avenue, HUDSON, FL 34667
MLS# A4694188Listed by: SAVVY AVENUE, LLC $340,000Active2 beds 2 baths1,818 sq. ft.
18508 Grand Club Drive, HUDSON, FL 34667
MLS# W7885966Listed by: RE/MAX MARKETING SPECIALISTS $59,000Pending0.59 Acres
15546 Hicks Road, HUDSON, FL 34667
MLS# W7885919Listed by: CENTURY 21 ALLIANCE REALTY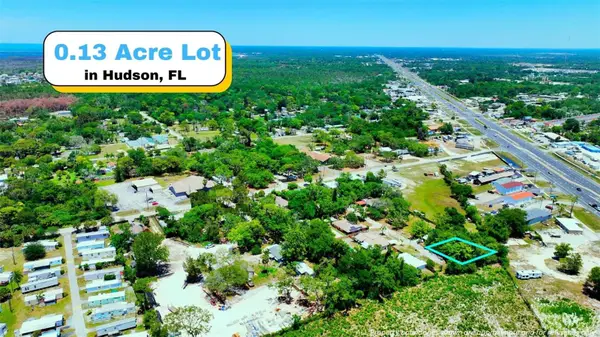 $23,400Active0.13 Acres
TBD Lot 6 Scamp Drive, HUDSON, FL 34667
MLS# A4694336Listed by: SAVVY AVENUE, LLC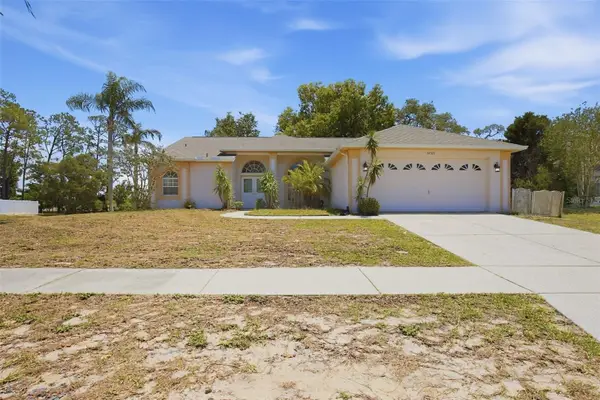 $274,900Active3 beds 2 baths2,027 sq. ft.
14521 Pimberton Drive, HUDSON, FL 34667
MLS# O6408435Listed by: MAINSTAY BROKERAGE LLC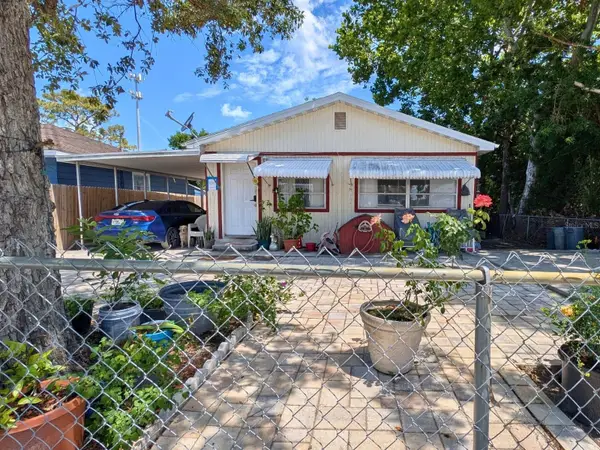 $125,000Active3 beds 1 baths1,400 sq. ft.
7101 Jeanne Avenue, HUDSON, FL 34667
MLS# TB8509966Listed by: JPT REALTY LLC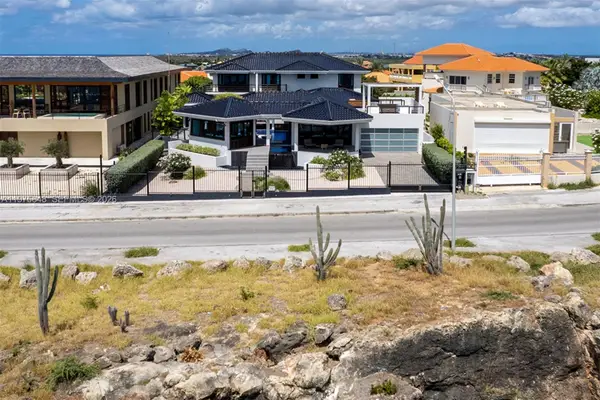 $2,600,000Active7 beds 7 baths7,082 sq. ft.
T17 Vista Royal, , FL 0000
MLS# A11975848Listed by: ONE SOTHEBY'S INTERNATIONAL REALTY $399,000Active2 beds 2 baths1,657 sq. ft.
12735 1st Isle, HUDSON, FL 34667
MLS# W7885873Listed by: BHHS FLORIDA PROPERTIES GROUP $349,000Active2 beds 2 baths1,573 sq. ft.
8635 Braxton Drive, HUDSON, FL 34667
MLS# W7885866Listed by: 1% LISTS CENTRAL FLORIDA $479,999Active3 beds 2 baths2,012 sq. ft.
13408 Whitby Rd,, Hudson, FL 34667
MLS# A12020131Listed by: 4EVER HOMES REALTY LLC $78,000Active0.07 Acres
6832 Albatross Lane, HUDSON, FL 34667
MLS# TB8508533Listed by: KELLER WILLIAMS SOUTH SHORE $595,000Active3 beds 2 baths1,964 sq. ft.
7119 Fair Lane, HUDSON, FL 34667
MLS# TB8481572Listed by: CHARLES RUTENBERG REALTY INC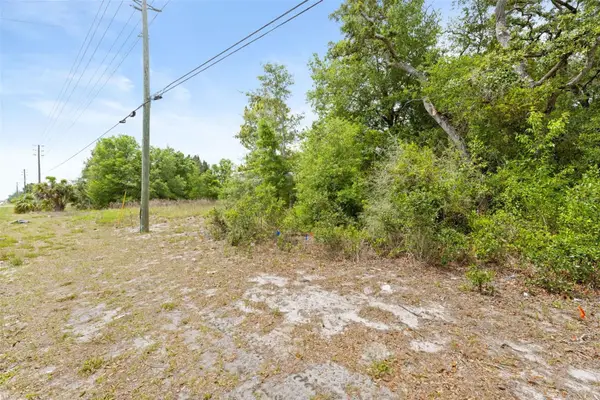 $49,000Pending0.32 Acres
8093 County Line Road, SPRING HILL, FL 34606
MLS# OM724852Listed by: REMAX REALTY ONE $335,000Active2 beds 2 baths1,913 sq. ft.
11709 Spindrift Loop, HUDSON, FL 34667
MLS# TB8508608Listed by: FUTURE HOME REALTY INC $398,000Active4 beds 3 baths2,038 sq. ft.
7978 Chandler Lake Court, HUDSON, FL 34667
MLS# R4911275Listed by: ON POINT REALTY INC. $319,000Active2 beds 2 baths1,152 sq. ft.
13605 Garris Drive, HUDSON, FL 34667
MLS# W7885778Listed by: BHHS FLORIDA PROPERTIES GROUP $199,000Active0.16 Acres
LOT 8 Rice Road, HUDSON, FL 34667
MLS# W7884842Listed by: FLORIDA LUXURY REALTY INC $159,000Pending0.12 Acres
LOT 6 Capri Lane, HUDSON, FL 34667
MLS# W7885674Listed by: FLORIDA LUXURY REALTY INC $130,000Active2 beds 2 baths1,144 sq. ft.
12308 Eagleswood Drive #D, HUDSON, FL 34667
MLS# TB8507556Listed by: CHARLES RUTENBERG REALTY INC $312,000Active3 beds 2 baths1,080 sq. ft.
6724 Gull Lane, HUDSON, FL 34667
MLS# W7885399Listed by: FLORIDA LUXURY REALTY INC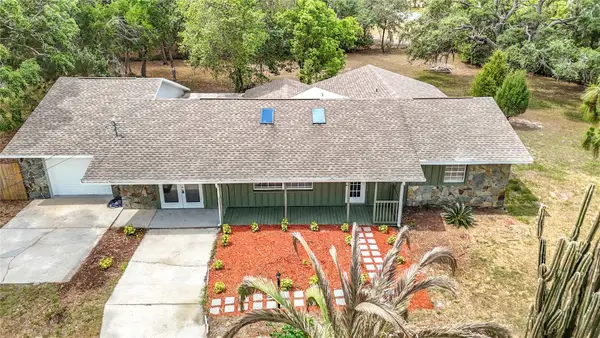 $419,900Active4 beds 2 baths2,096 sq. ft.
13206 Tyrone Street, HUDSON, FL 34667
MLS# O6408410Listed by: TRUST REALTY USA, LLC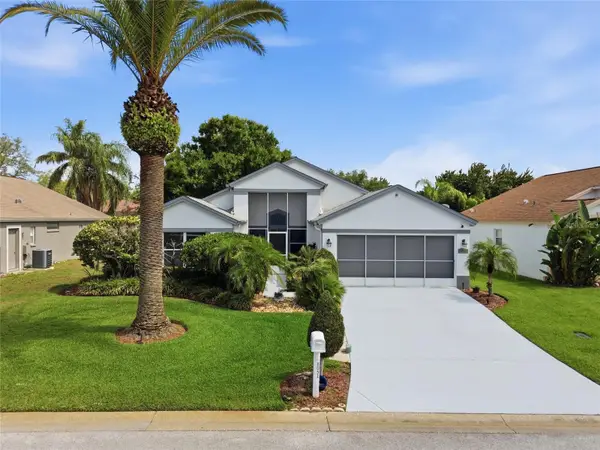 $339,000Active3 beds 2 baths1,469 sq. ft.
8051 Thatch Terrace, HUDSON, FL 34667
MLS# TB8508882Listed by: EXP REALTY LLC $499,900Active0.33 Acres
14539 Old Dixie Highway, HUDSON, FL 34667
MLS# TB8509216Listed by: COMPASS FLORIDA LLC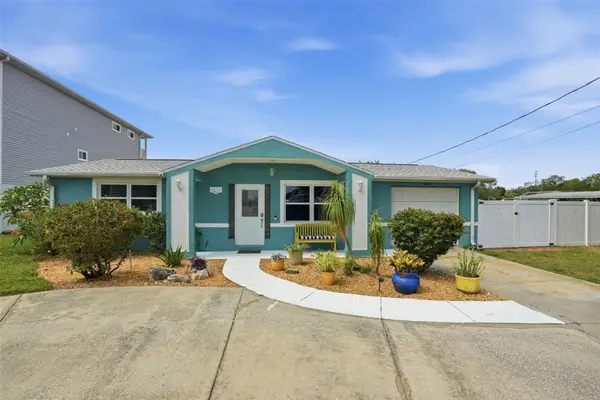 $599,900Active3 beds 2 baths1,610 sq. ft.
6907 Clark Street, HUDSON, FL 34667
MLS# TB8506128Listed by: PEOPLE'S TRUST REALTY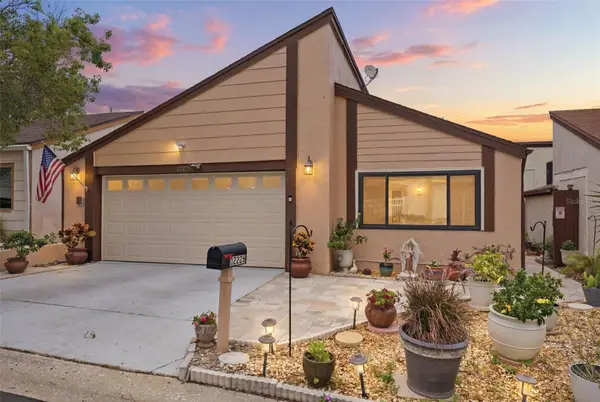 $250,000Active2 beds 2 baths1,998 sq. ft.
12226 Cider Mill Lane, HUDSON, FL 34667
MLS# TB8507591Listed by: FINEHIRSH REALTY POWERED BY SELLSTATE $249,900Active3 beds 2 baths1,878 sq. ft.
18208 Breland Drive, HUDSON, FL 34667
MLS# W7885762Listed by: FIND YOUR PARADISE $345,000Active3 beds 2 baths1,100 sq. ft.
10617 Denton Avenue, HUDSON, FL 34667
MLS# W7885646Listed by: BHHS FLORIDA PROPERTIES GROUP $225,000Active0.14 Acres
6733 Driftwood Drive, HUDSON, FL 34667
MLS# TB8507983Listed by: CAPSTONE REALTY & ASSOCIATES $174,900Active2 beds 1 baths930 sq. ft.
7830 Butler Avenue, HUDSON, FL 34667
MLS# TB8507166Listed by: REALTY ONE GROUP MVP $434,900Active3 beds 2 baths1,700 sq. ft.
6950 Southwind Drive, HUDSON, FL 34667
MLS# TB8507935Listed by: LPT REALTY, LLC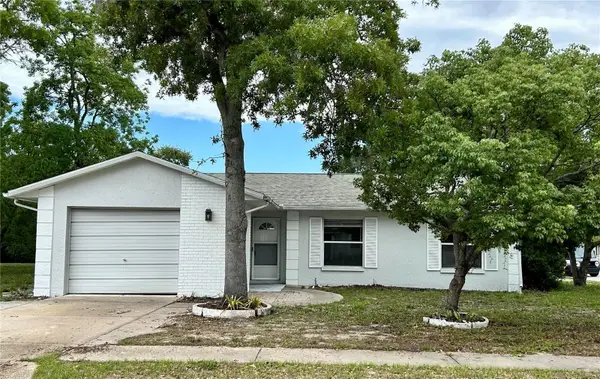 $247,900Active3 beds 2 baths1,051 sq. ft.
8907 Wayward Circle, HUDSON, FL 34667
MLS# O6407239Listed by: BEYCOME OF FLORIDA LLC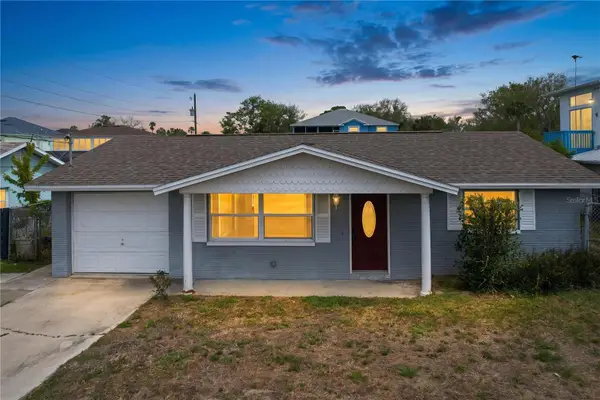 $350,000Active2 beds 2 baths1,077 sq. ft.
7513 Hatteras Drive, HUDSON, FL 34667
MLS# W7885662Listed by: NJS REALTY PLLC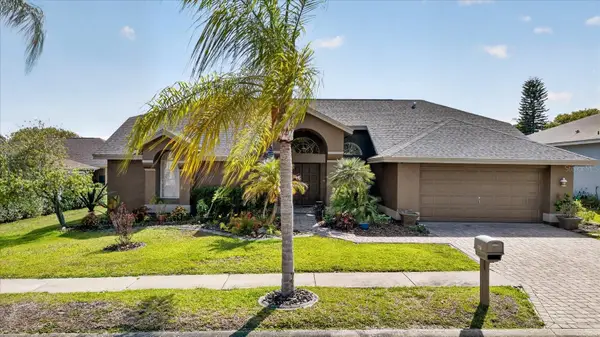 $425,000Active4 beds 3 baths2,633 sq. ft.
8687 Ashbury Drive, HUDSON, FL 34667
MLS# TB8507464Listed by: KELLER WILLIAMS REALTY- PALM H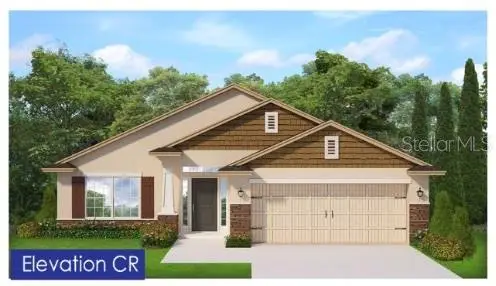 $386,000Active4 beds 2 baths1,820 sq. ft.
9393 Highland Hills Dr Street, HUDSON, FL 34667
MLS# TB8505256Listed by: ADAMS HOMES REALTY,INC.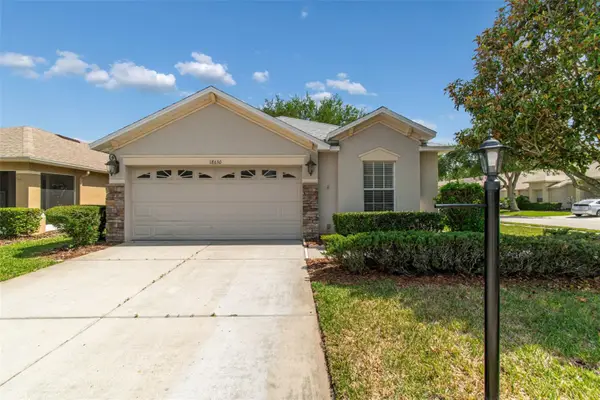 $255,000Active3 beds 2 baths1,478 sq. ft.
18630 Rolling Hills Loop, HUDSON, FL 34667
MLS# W7885645Listed by: RE/MAX MARKETING SPECIALISTS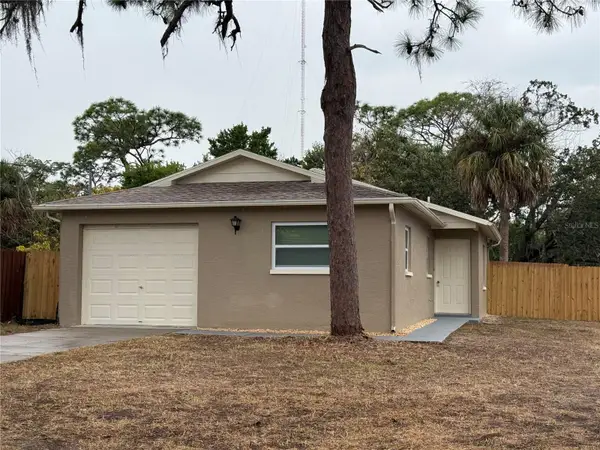 $175,000Pending2 beds 2 baths820 sq. ft.
15217 Omaha Street, HUDSON, FL 34667
MLS# TB8507081Listed by: SPEED EQUITY REALTY LLC $345,000Active3 beds 2 baths1,874 sq. ft.
13100 Western Circle, HUDSON, FL 34667
MLS# TB8505549Listed by: LPT REALTY, LLC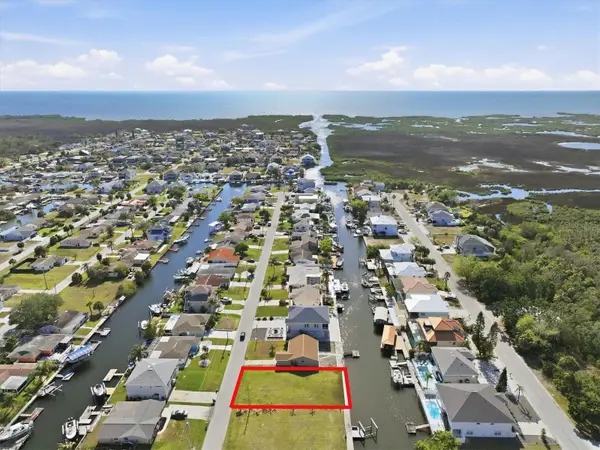 $165,000Active0.14 Acres
7429 Hatteras Drive, HUDSON, FL 34667
MLS# W7885630Listed by: GULF COAST FISHING HOMES RLTY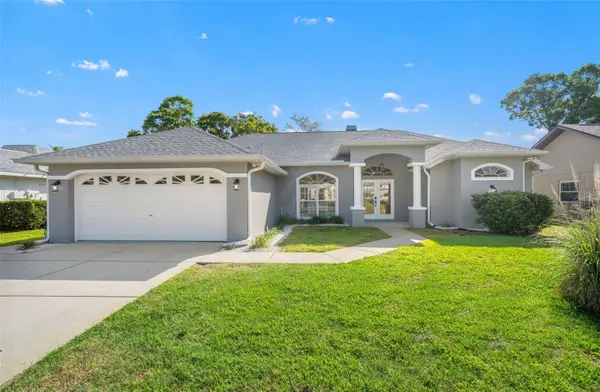 $325,000Pending3 beds 2 baths1,866 sq. ft.
13602 Glaze Brook Drive, HUDSON, FL 34667
MLS# TB8506094Listed by: OPTIMA ONE REALTY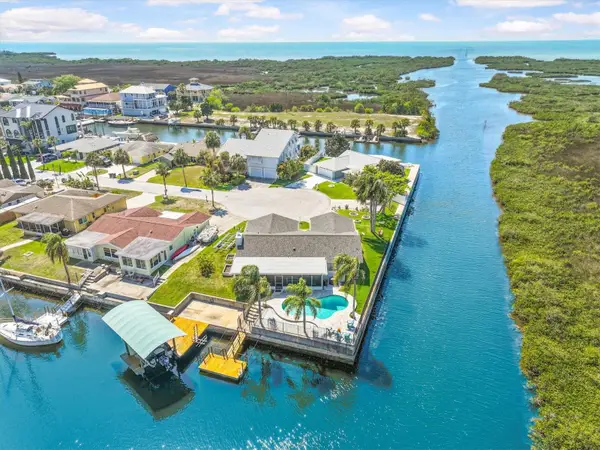 $830,000Active3 beds 2 baths1,728 sq. ft.
15722 Donzi Drive, HUDSON, FL 34667
MLS# W7885604Listed by: RE/MAX ALLIANCE GROUP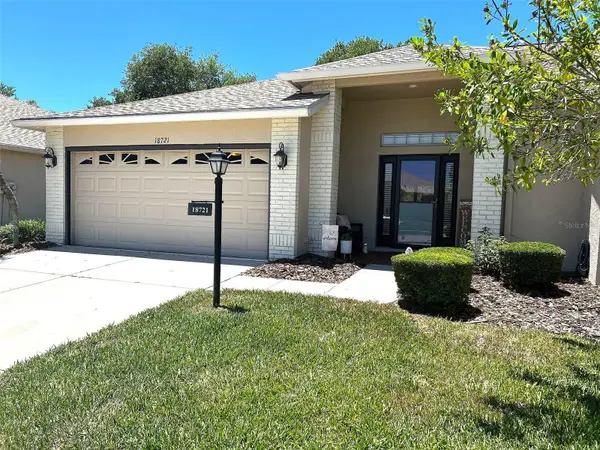 $305,000Pending2 beds 2 baths1,703 sq. ft.
18721 Water Lily Lane, HUDSON, FL 34667
MLS# TB8506717Listed by: LIPPLY REAL ESTATE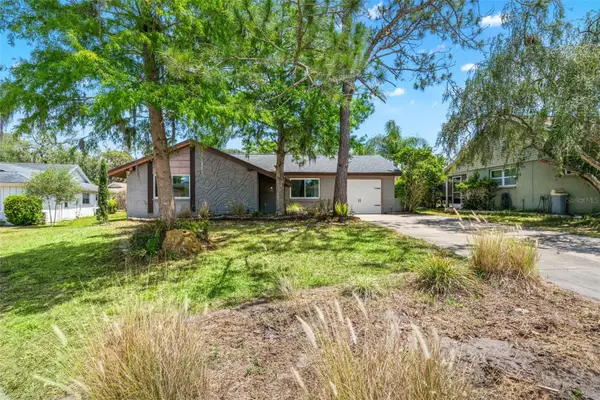 $239,000Active2 beds 2 baths1,200 sq. ft.
8804 Lincolnshire Drive, HUDSON, FL 34667
MLS# W7885317Listed by: FLORIDA CRACKER PROPERTIES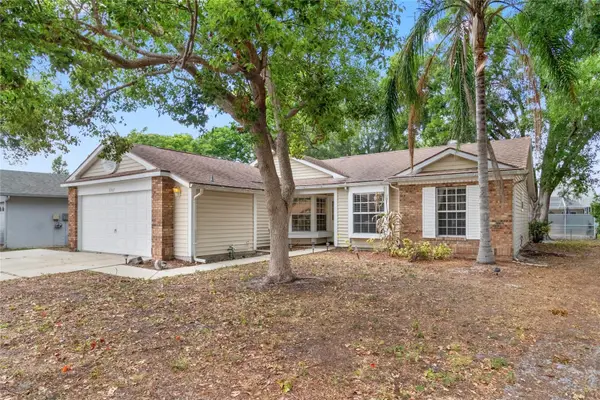 $234,900Pending4 beds 2 baths1,272 sq. ft.
8907 Whistler Way, HUDSON, FL 34667
MLS# W7885325Listed by: FLORIDA CRACKER PROPERTIES $145,000Active1 beds 1 baths731 sq. ft.
7712 Hillside Court #201, HUDSON, FL 34667
MLS# W7885493Listed by: BHHS FLORIDA PROPERTIES GROUP $399,000Active3 beds 2 baths2,167 sq. ft.
12802 Ironwood Circle, HUDSON, FL 34667
MLS# TB8506025Listed by: TROPICAL LIFE REALTY, INC. $440,000Active3 beds 2 baths1,222 sq. ft.
13912 Darlene Avenue, HUDSON, FL 34667
MLS# W7885590Listed by: RE/MAX SUNSET REALTY $270,000Pending2 beds 1 baths1,020 sq. ft.
13231 Starfish Drive, HUDSON, FL 34667
MLS# W7885463Listed by: RE/MAX MARKETING SPECIALISTS $360,000Active4 beds 2 baths1,599 sq. ft.
13804 Malcolm Avenue, HUDSON, FL 34667
MLS# W7885376Listed by: RE/MAX SUNSET REALTY $375,000Active3 beds 2 baths1,877 sq. ft.
8141 Golf Club Court, HUDSON, FL 34667
MLS# TB8505790Listed by: REALTY ONE GROUP SUNSHINE $339,000Active2 beds 2 baths1,247 sq. ft.
13930 Sommers Avenue, HUDSON, FL 34667
MLS# W7885365Listed by: MERIDIAN REAL ESTATE $424,700Active3 beds 2 baths1,396 sq. ft.
13912 Duley Avenue, HUDSON, FL 34667
MLS# A4692099Listed by: LA ROSA REALTY LLC $135,000Active0.11 Acres
6736 Curlew Lane, HUDSON, FL 34667
MLS# TB8505587Listed by: FUTURE HOME REALTY INC $239,900Active2 beds 2 baths1,664 sq. ft.
18037 Baywood Forest Drive, HUDSON, FL 34667
MLS# W7885470Listed by: RE/MAX SUNSET REALTY $299,999Active4 beds 2 baths1,971 sq. ft.
12706 Whisper Circle, HUDSON, FL 34667
MLS# TB8502605Listed by: MARK SPAIN REAL ESTATE $399,000Active3 beds 2 baths1,929 sq. ft.
18530 Water Lily Lane, HUDSON, FL 34667
MLS# TB8505420Listed by: LIPPLY REAL ESTATE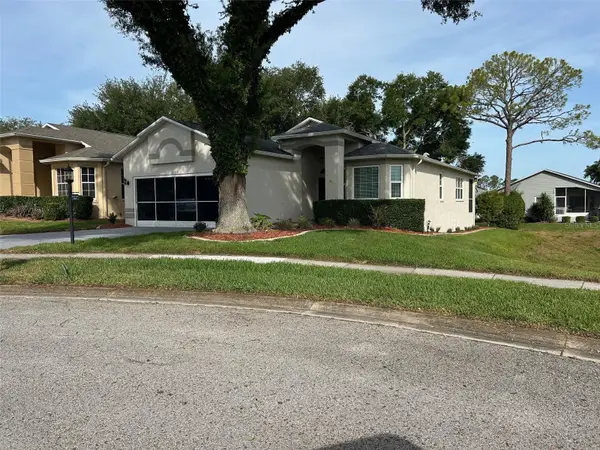 $289,900Active2 beds 2 baths1,951 sq. ft.
18109 Tiverton Court, HUDSON, FL 34667
MLS# W7885465Listed by: CHARLES RUTENBERG REALTY INC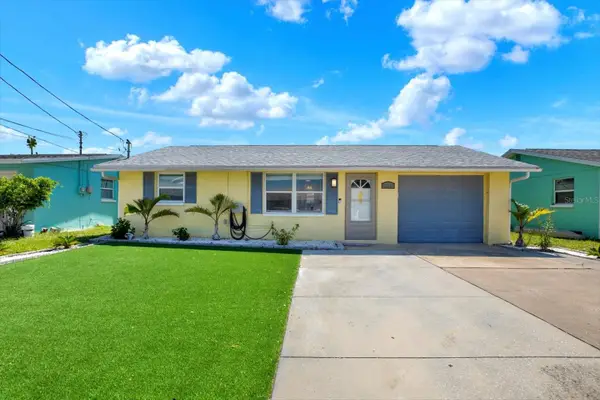 $290,000Active2 beds 1 baths968 sq. ft.
13526 Outboard Court, HUDSON, FL 34667
MLS# A4692684Listed by: MANGROVE BAY REALTY LLC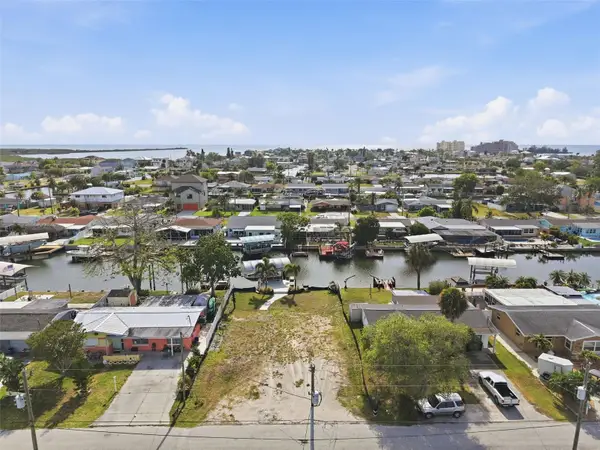 $189,000Pending0.14 Acres
13625 Britton Drive, HUDSON, FL 34667
MLS# W7885460Listed by: RE/MAX ALLIANCE GROUP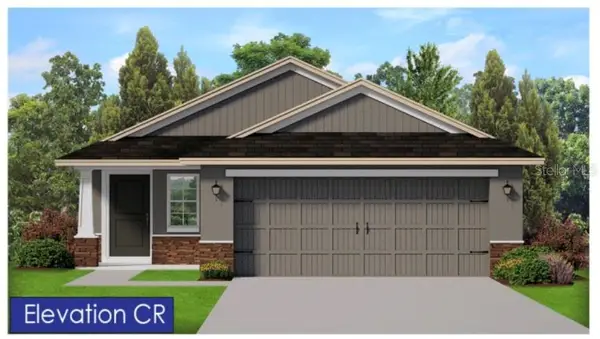 $367,400Active3 beds 2 baths1,415 sq. ft.
9443 Highland Hills Dr Street, HUDSON, FL 34667
MLS# TB8505277Listed by: ADAMS HOMES REALTY,INC.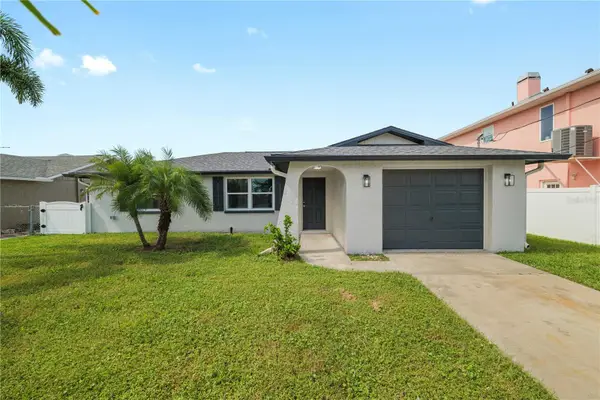 $449,000Active2 beds 2 baths1,161 sq. ft.
6617 Harbor Drive, HUDSON, FL 34667
MLS# TB8504815Listed by: PREMIER SOTHEBYS INTL REALTY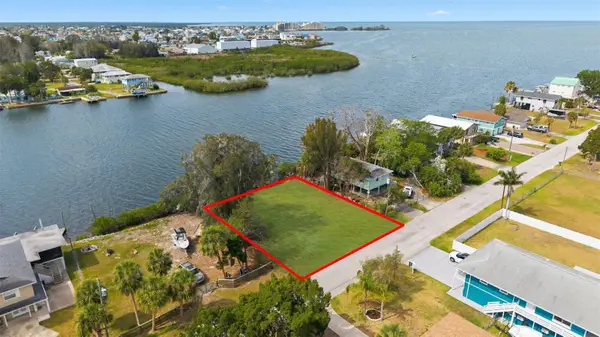 $425,000Active0.23 Acres
6646 Seaview Boulevard, HUDSON, FL 34667
MLS# TB8504993Listed by: SMITH & ASSOCIATES REAL ESTATE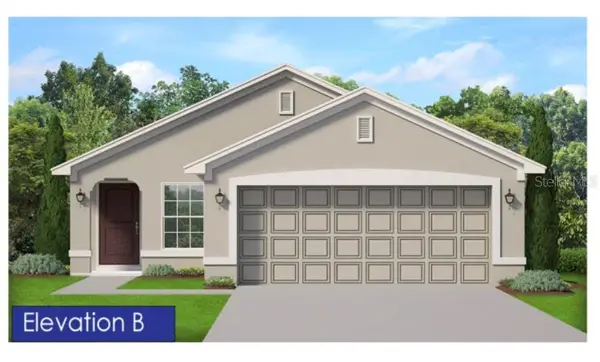 $362,900Active3 beds 2 baths1,515 sq. ft.
9351 Highland Hills Dr Street, HUDSON, FL 34667
MLS# TB8504574Listed by: ADAMS HOMES REALTY,INC.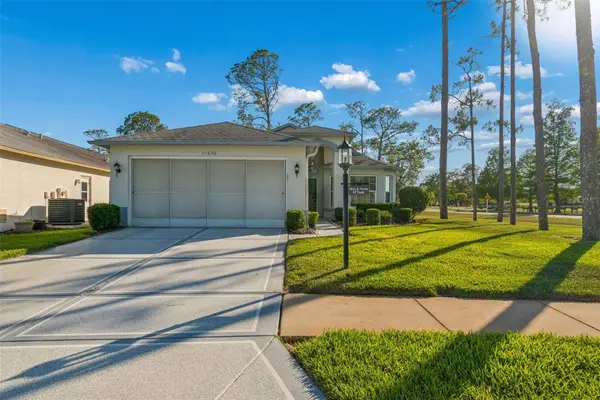 $275,000Pending3 beds 2 baths1,556 sq. ft.
11630 Wheatfield Loop, HUDSON, FL 34667
MLS# W7885438Listed by: RE/MAX MARKETING SPECIALISTS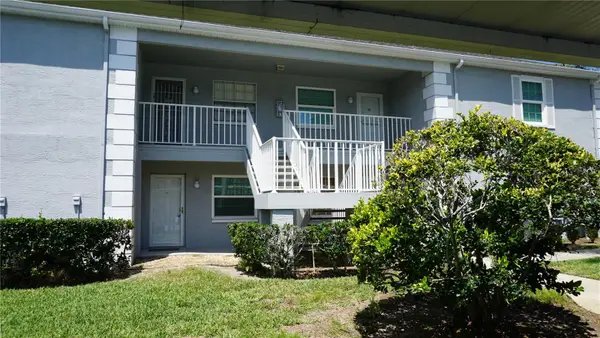 $129,900Active2 beds 2 baths1,103 sq. ft.
7713 Hillside Court #203, HUDSON, FL 34667
MLS# W7885437Listed by: RE/MAX SUNSET REALTY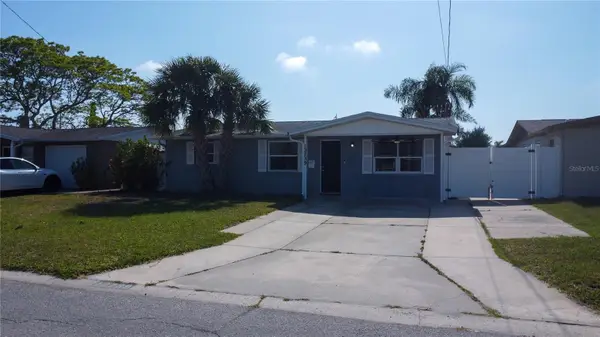 $414,999Active3 beds 2 baths1,444 sq. ft.
12739 1st Isle, HUDSON, FL 34667
MLS# W7885390Listed by: FUTURE HOME REALTY INC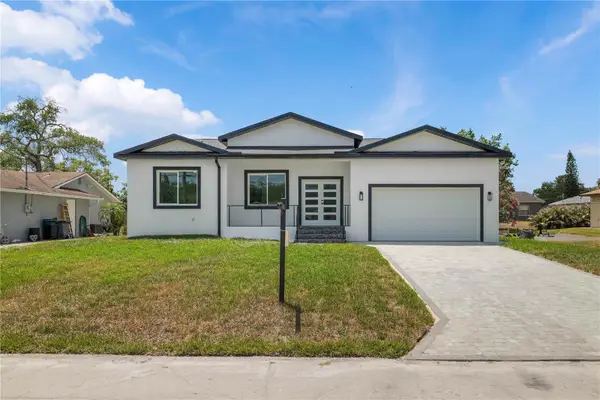 $479,000Active3 beds 2 baths2,068 sq. ft.
8526 Indies Drive, HUDSON, FL 34667
MLS# TB8504301Listed by: EXP REALTY LLC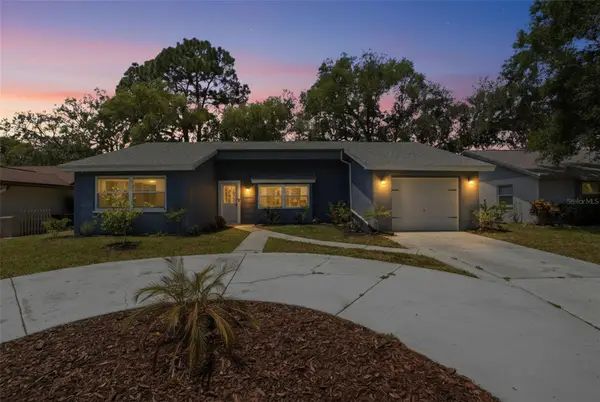 $249,000Pending3 beds 2 baths1,530 sq. ft.
12607 Blackberry Row, HUDSON, FL 34667
MLS# TB8504358Listed by: THE SHOP REAL ESTATE CO.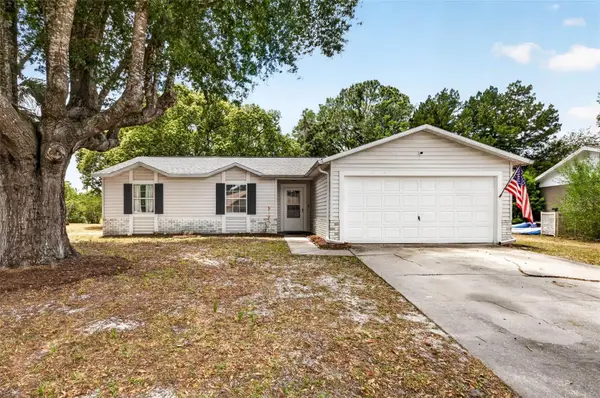 $229,900Active3 beds 2 baths1,019 sq. ft.
13205 Wagner Drive, HUDSON, FL 34667
MLS# TB8504286Listed by: KELLER WILLIAMS RLTY NEW TAMPA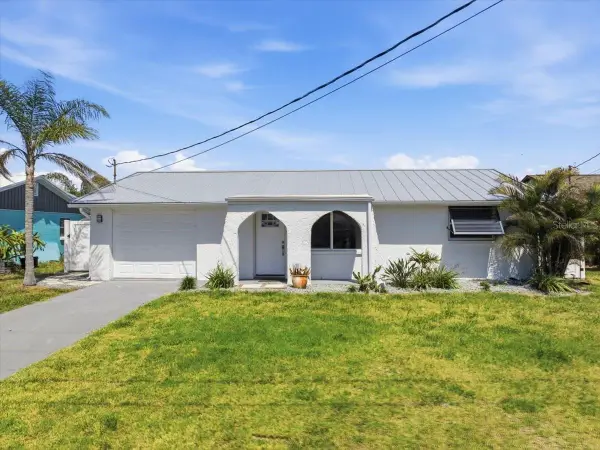 $350,000Active2 beds 2 baths1,092 sq. ft.
13902 Barnard Avenue, HUDSON, FL 34667
MLS# W7885410Listed by: FLORIDA LUXURY REALTY INC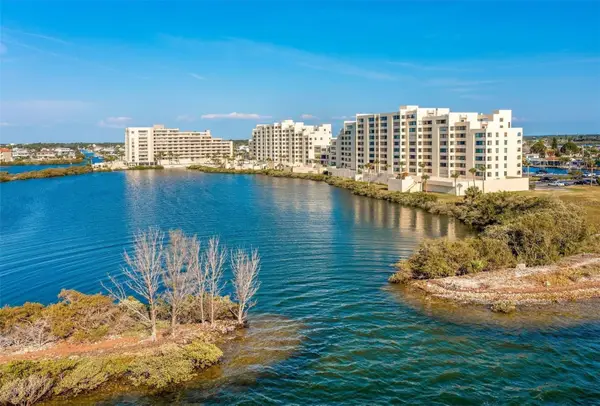 $214,000Active1 beds 1 baths733 sq. ft.
5915 Sea Ranch Drive #310, HUDSON, FL 34667
MLS# TB8503818Listed by: KEYS TO THE BAY REAL ESTATE $439,900Active4 beds 3 baths1,669 sq. ft.
15808 Archer Street, HUDSON, FL 34667
MLS# TB8503839Listed by: CHARLES RUTENBERG REALTY INC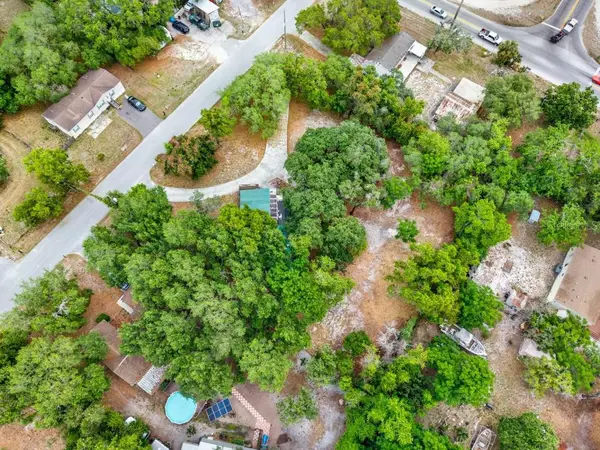 $95,000Active3 beds 2 baths1,128 sq. ft.
9918 Fargo Drive, HUDSON, FL 34667
MLS# A4692365Listed by: FLATFEE.COM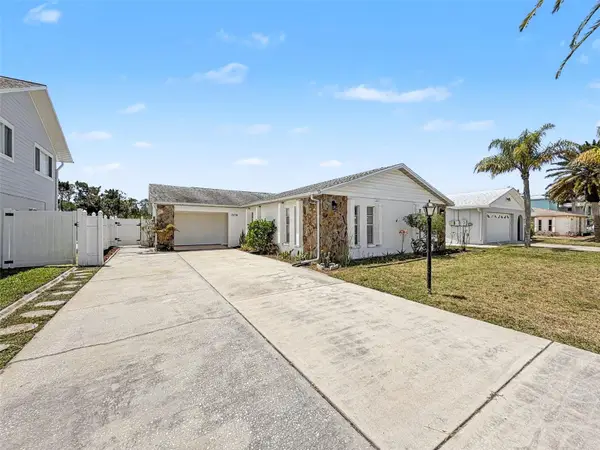 $318,000Active3 beds 2 baths1,596 sq. ft.
7038 Southwind Drive, HUDSON, FL 34667
MLS# W7885196Listed by: FLORIDA LUXURY REALTY INC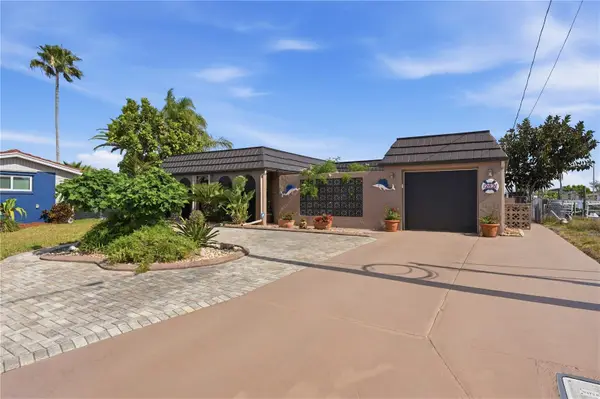 $469,900Active2 beds 2 baths1,568 sq. ft.
12821 4th Isle, HUDSON, FL 34667
MLS# TB8503884Listed by: HOMEXPRESS REALTY, INC.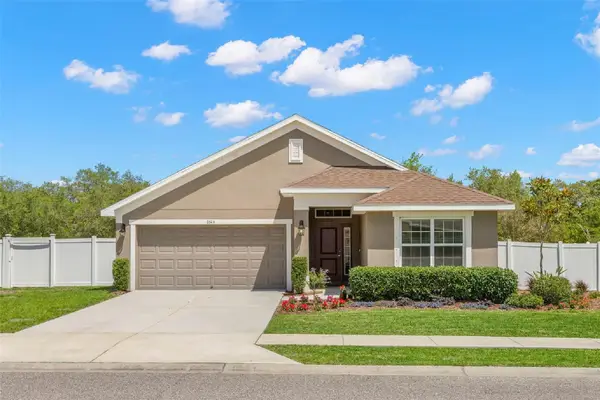 $325,000Pending3 beds 2 baths1,718 sq. ft.
16114 Vine Cliff Avenue, HUDSON, FL 34667
MLS# TB8502069Listed by: KELLER WILLIAMS SOUTH TAMPA $279,900Active3 beds 2 baths1,386 sq. ft.
8836 Kilmer Way, HUDSON, FL 34667
MLS# W7885261Listed by: RE/MAX SUNSET REALTY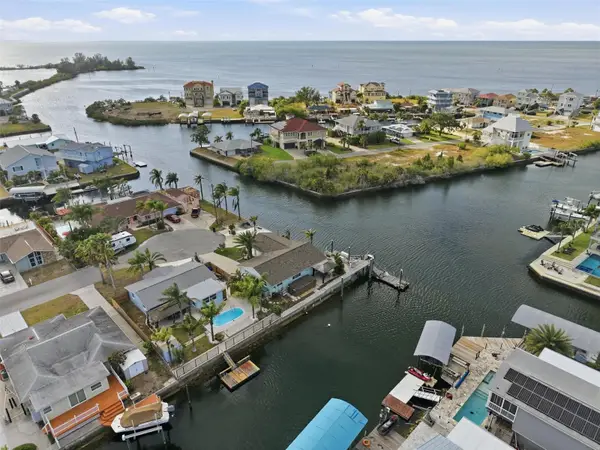 $425,000Active2 beds 2 baths1,176 sq. ft.
13822 Malcolm Avenue, HUDSON, FL 34667
MLS# W7885254Listed by: RE/MAX ALLIANCE GROUP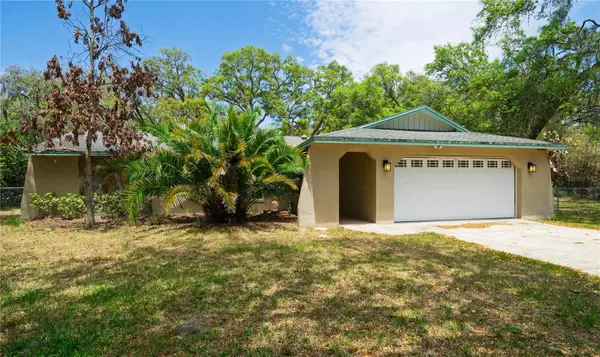 $400,000Pending2 beds 2 baths1,588 sq. ft.
12615 Oak Tree Drive, HUDSON, FL 34667
MLS# TB8503103Listed by: MIHARA & ASSOCIATES INC.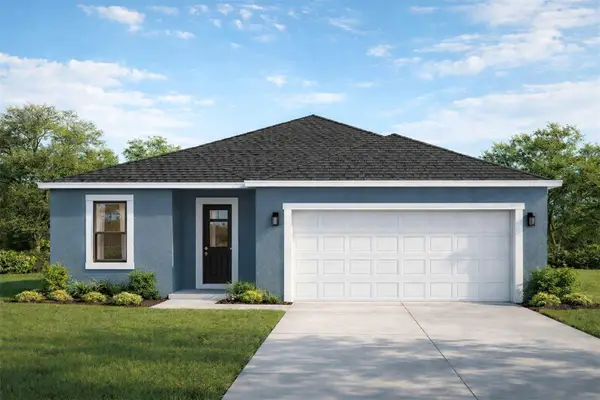 $350,000Active3 beds 2 baths1,387 sq. ft.
10111 Briar Circle, HUDSON, FL 34667
MLS# TB8499036Listed by: EXP REALTY LLC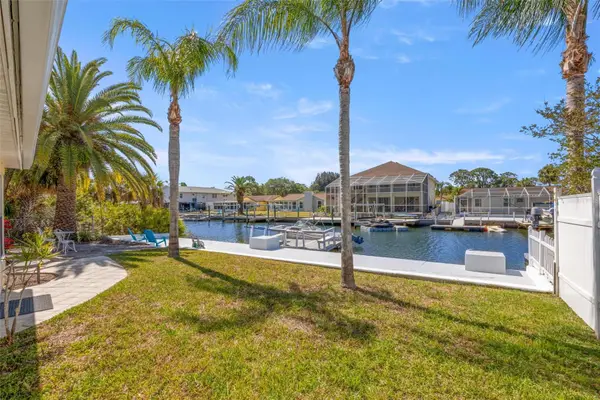 $435,000Active2 beds 2 baths1,432 sq. ft.
7418 Islander Lane, HUDSON, FL 34667
MLS# TB8501884Listed by: KELLER WILLIAMS REALTY PORTFOLIO COLLECTION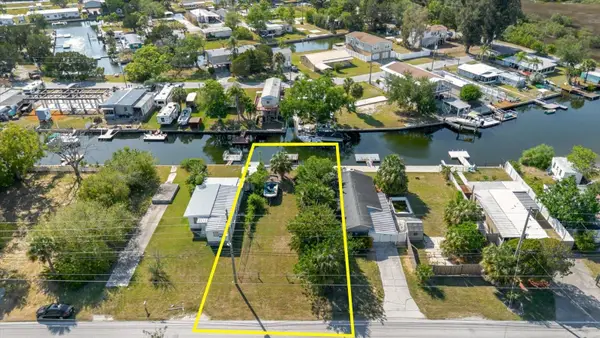 $120,000Active0.09 Acres
14905 Old Dixie Highway, HUDSON, FL 34667
MLS# TB8502374Listed by: ALIGN RIGHT REALTY LLC $249,900Active2 beds 2 baths1,366 sq. ft.
12415 Stagecoach Lane, HUDSON, FL 34667
MLS# W7885283Listed by: BHHS FLORIDA PROPERTIES GROUP $249,900Active2 beds 1 baths1,040 sq. ft.
17322 Harmony Drive, HUDSON, FL 34667
MLS# W7885085Listed by: HOMAN REALTY GROUP INC $124,900Active2 beds 2 baths1,029 sq. ft.
7233 Greystone Drive, HUDSON, FL 34667
MLS# W7885232Listed by: FIND YOUR PARADISE $185,000Pending2 beds 2 baths644 sq. ft.
6815 Flicker Lane, HUDSON, FL 34667
MLS# TB8502138Listed by: KELLER WILLIAMS REALTY- PALM H $145,100Active0.1 Acres
6731 Curlew, HUDSON, FL 34667
MLS# TB8502074Listed by: FRIENDS REALTY LLC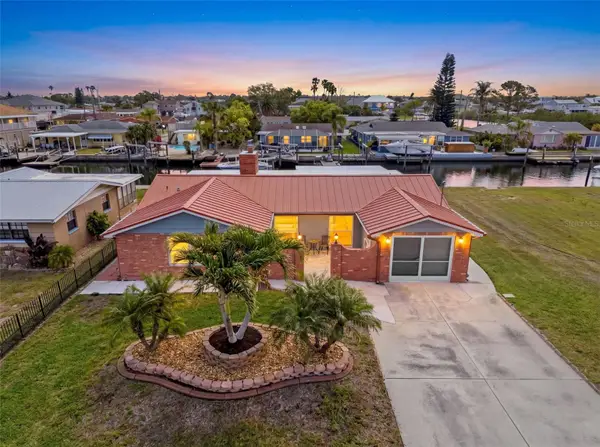 $440,000Active2 beds 2 baths1,802 sq. ft.
13520 Allyn Drive, HUDSON, FL 34667
MLS# W7885019Listed by: FLORIDA LUXURY REALTY INC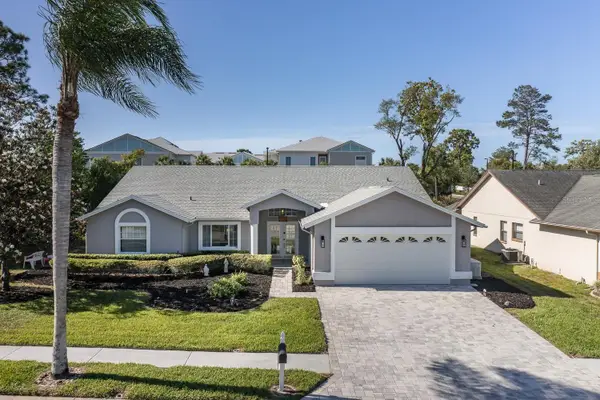 $339,900Pending3 beds 2 baths2,013 sq. ft.
8912 Thoreau Place, HUDSON, FL 34667
MLS# W7885206Listed by: RE/MAX MARKETING SPECIALISTS $300,000Pending2 beds 2 baths1,777 sq. ft.
12813 3rd Isle, HUDSON, FL 34667
MLS# W7885171Listed by: BHHS FLORIDA PROPERTIES GROUP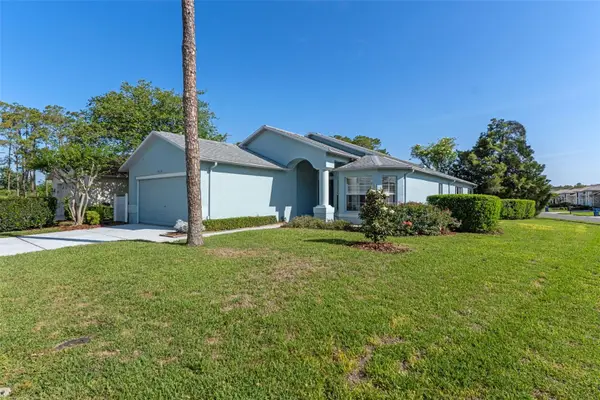 $304,700Active2 beds 2 baths1,970 sq. ft.
18236 Webster Grove Drive, HUDSON, FL 34667
MLS# A4691455Listed by: 365 REALTY GROUP INC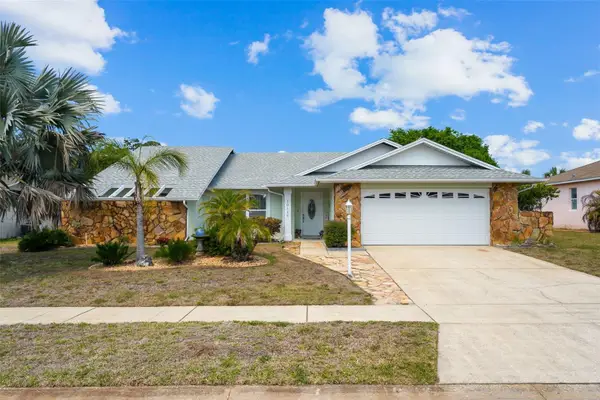 $359,900Pending3 beds 2 baths1,565 sq. ft.
10116 Landmark Drive, HUDSON, FL 34667
MLS# W7885211Listed by: RE/MAX ALLIANCE GROUP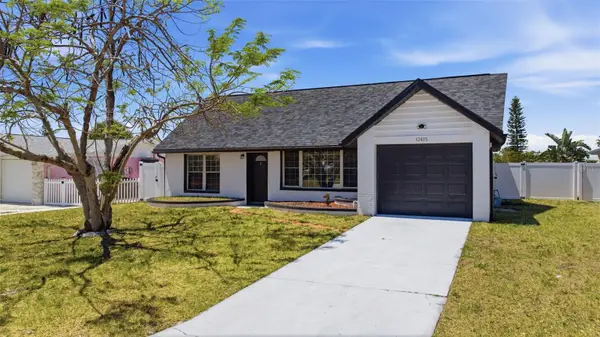 $409,900Active3 beds 2 baths1,466 sq. ft.
13615 Garris Drive, HUDSON, FL 34667
MLS# TB8500515Listed by: REAL BROKER, LLC $299,900Pending2 beds 2 baths1,478 sq. ft.
7604 Mako, HUDSON, FL 34667
MLS# W7885210Listed by: SIRROM REALTY LLC $57,000Active0.44 Acres
Hicks Road, HUDSON, FL 34667
MLS# TB8500845Listed by: BLUE SUN REALTY LLC $159,500Active2 beds 2 baths1,129 sq. ft.
12539 Greylock Lane #12539, HUDSON, FL 34667
MLS# W7885142Listed by: PARADISE WEST REALTY, INC $369,900Active3 beds 2 baths1,916 sq. ft.
13635 Muffin Court, HUDSON, FL 34667
MLS# TB8500503Listed by: RE/MAX ELITE REALTY $109,500Active3 beds 2 baths1,140 sq. ft.
12017 Cartwright Drive, HUDSON, FL 34667
MLS# W7885079Listed by: RE/MAX SUNSET REALTY $399,900Active3 beds 3 baths1,450 sq. ft.
7235 Maryland Avenue, HUDSON, FL 34667
MLS# TB8501277Listed by: PEOPLE'S TRUST REALTY $375,000Active2 beds 2 baths1,392 sq. ft.
17528 Coyote Road, HUDSON, FL 34667
MLS# TB8499664Listed by: AGILE GROUP REALTY $117,500Active2 beds 2 baths1,103 sq. ft.
7713 Hillside Court #204, HUDSON, FL 34667
MLS# TB8500734Listed by: REDFIN CORPORATION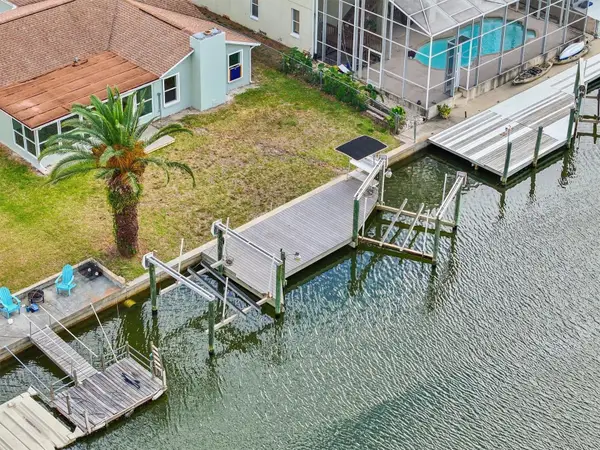 $490,000Active3 beds 2 baths1,662 sq. ft.
7427 Southwind Drive, HUDSON, FL 34667
MLS# W7885129Listed by: GULF COAST FISHING HOMES RLTY $310,000Active2 beds 2 baths950 sq. ft.
5915 Sea Ranch Drive #308, HUDSON, FL 34667
MLS# TB8500638Listed by: PLANTATION REALTY, INC.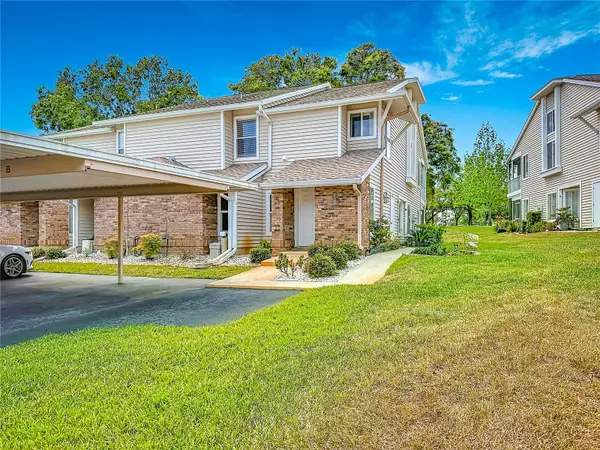 $134,900Pending2 beds 2 baths1,123 sq. ft.
12405 Eagleswood Drive #D, HUDSON, FL 34667
MLS# TB8500335Listed by: LAWRENCE W SCADUTO LLC $88,900Active0.07 Acres
6741 Flicker Lane, HUDSON, FL 34667
MLS# A4690504Listed by: SAVVY AVENUE, LLC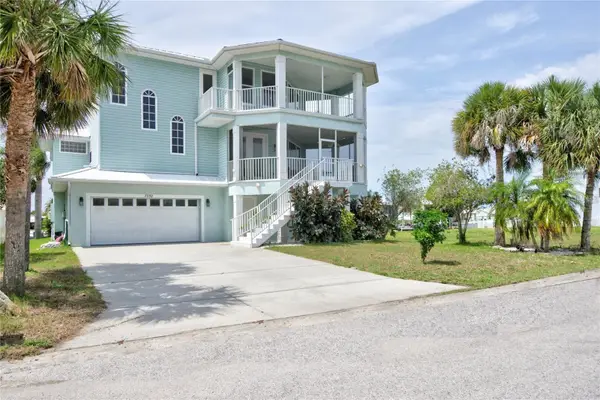 $789,900Active4 beds 3 baths2,926 sq. ft.
7352 Gulf Way, HUDSON, FL 34667
MLS# W7885031Listed by: GULF COAST FISHING HOMES RLTY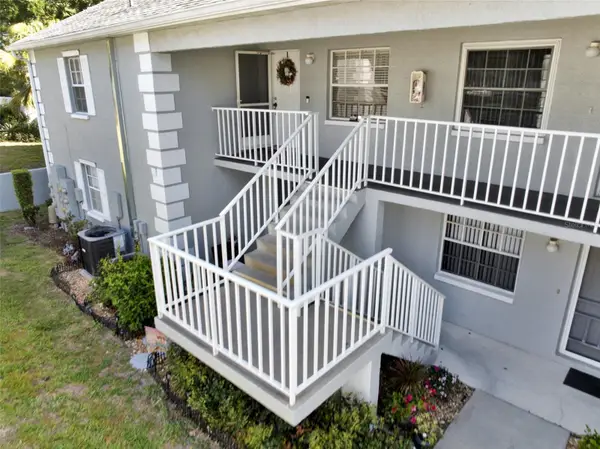 $165,000Active2 beds 2 baths1,103 sq. ft.
12133 Spartan Way #204, HUDSON, FL 34667
MLS# TB8492711Listed by: HOME PRIME REALTY LLC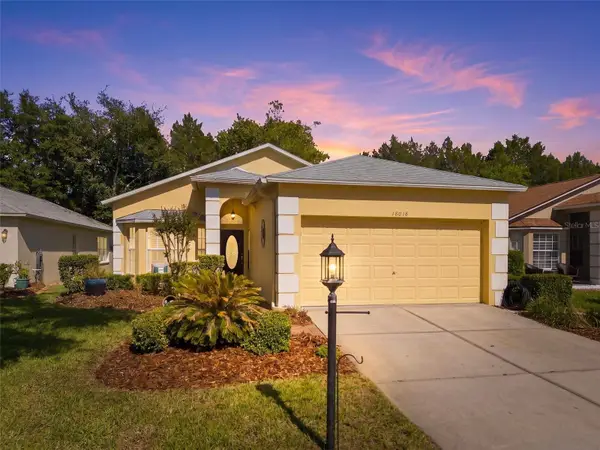 $274,900Active2 beds 2 baths1,536 sq. ft.
18018 Webster Grove Drive, HUDSON, FL 34667
MLS# W7884952Listed by: F I GREY & SON RESIDENTIAL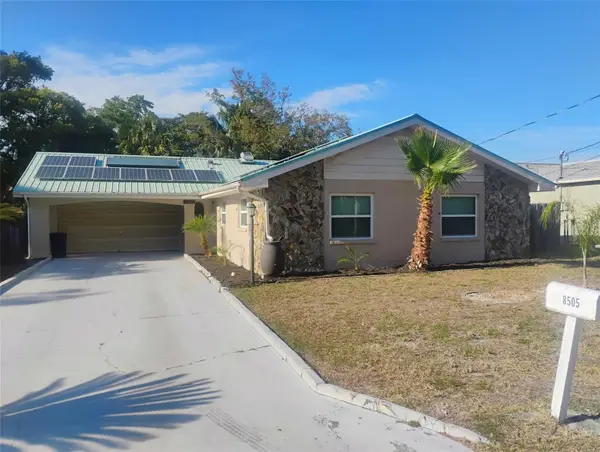 $279,900Active3 beds 2 baths1,540 sq. ft.
8505 Jolly Roger Drive, HUDSON, FL 34667
MLS# TB8497924Listed by: AMETHYST PROPERTY ADVISORS LLC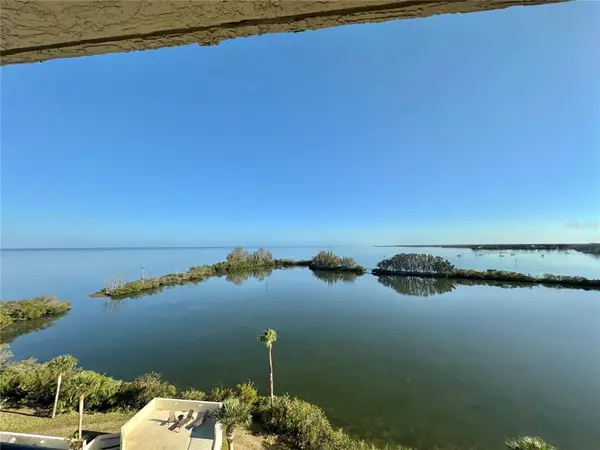 $225,000Active1 beds 1 baths733 sq. ft.
5915 Sea Ranch Drive #711, HUDSON, FL 34667
MLS# S5148090Listed by: LIBBY REALTY, INC.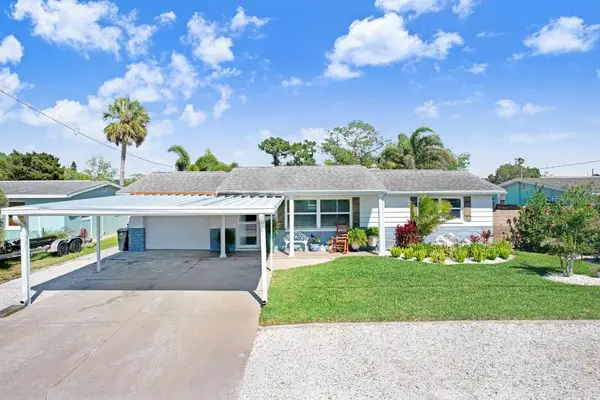 $340,000Pending2 beds 2 baths1,049 sq. ft.
13400 Neptune Drive, HUDSON, FL 34667
MLS# TB8497989Listed by: EXP REALTY LLC $357,000Active3 beds 2 baths2,056 sq. ft.
18334 Waydale Loop, HUDSON, FL 34667
MLS# TB8497369Listed by: PREFERRED PROPERTY ASSOC INC $450,000Active4 beds 3 baths2,638 sq. ft.
8723 Ashbury Drive, HUDSON, FL 34667
MLS# TB8498803Listed by: PREMIER SOTHEBY'S INTL REALTY- Open Sat, 1 to 3pm
 $265,000Active4 beds 2 baths1,476 sq. ft.
7410 Duke Drive, HUDSON, FL 34667
MLS# TB8476543Listed by: VITA LUXURY REALTY LLC 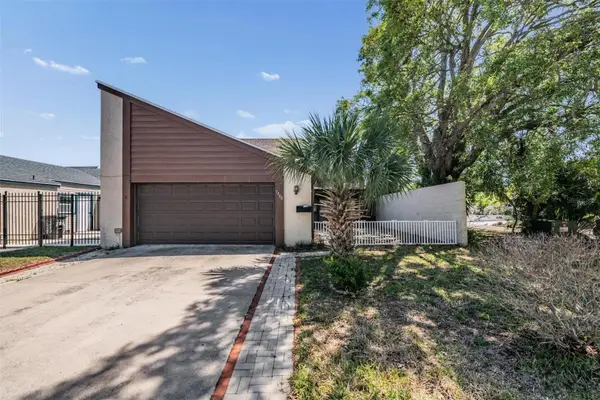 $249,900Active3 beds 3 baths1,732 sq. ft.
7300 Bellows Falls Lane, HUDSON, FL 34667
MLS# TB8498507Listed by: CENTURY 21 COASTAL ALLIANCE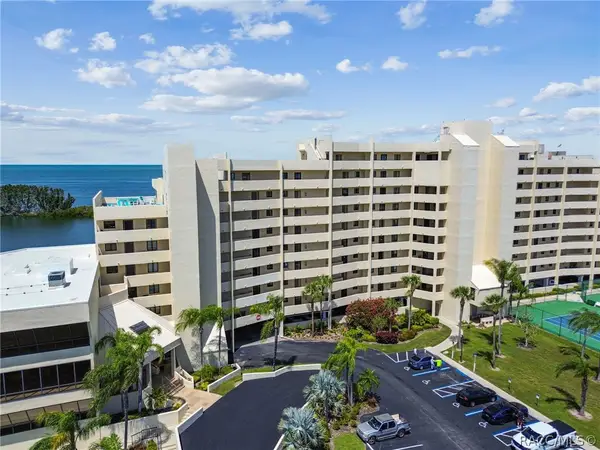 $298,000Active2 beds 2 baths950 sq. ft.
6009 Sea Ranch Drive #107, Hudson, FL 34667
MLS# 854055Listed by: PLANTATION REALTY, INC.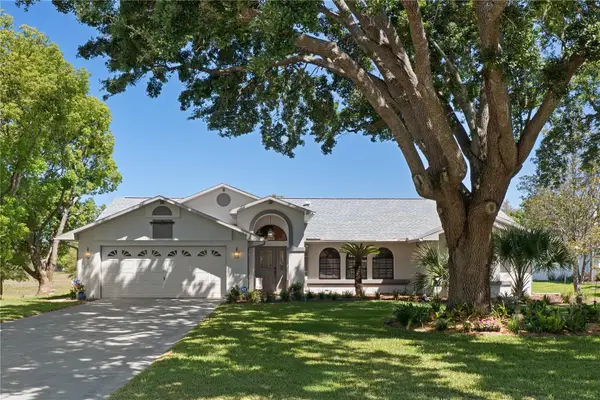 $474,900Active3 beds 2 baths2,024 sq. ft.
18652 Autumn Lake Boulevard, HUDSON, FL 34667
MLS# TB8498292Listed by: BEACHES TO RANCHES REALTY $59,900Active0.07 Acres
6760 Puffin Lane, HUDSON, FL 34667
MLS# W7884881Listed by: LISTWITHFREEDOM.COM $240,000Active3 beds 2 baths1,413 sq. ft.
8704 Long Boat Lane, HUDSON, FL 34667
MLS# G5111067Listed by: LPT REALTY, LLC $269,999Pending3 beds 2 baths1,176 sq. ft.
7212 Princeton Drive, HUDSON, FL 34667
MLS# TB8498266Listed by: GRAYSTONE REAL ESTATE $390,000Active2 beds 2 baths1,294 sq. ft.
6521 Leeside Isle, HUDSON, FL 34667
MLS# W7884500Listed by: BHHS FLORIDA PROPERTIES GROUP $350,000Pending3 beds 2 baths2,097 sq. ft.
10328 Rainbow Oaks Drive, HUDSON, FL 34667
MLS# TB8497907Listed by: TRINITY REALTY SOLUTIONS, LLC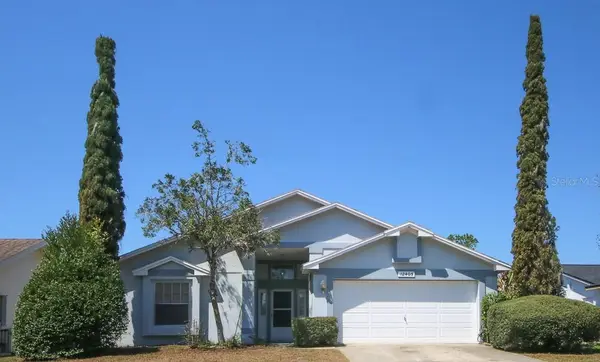 $199,000Pending2 beds 2 baths1,336 sq. ft.
12405 Stagecoach Lane, HUDSON, FL 34667
MLS# W7884153Listed by: RE/MAX SUNSET REALTY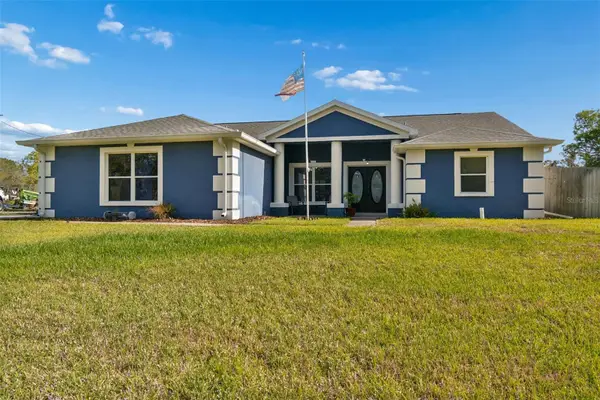 $549,000Active3 beds 2 baths1,896 sq. ft.
12916 Ithaca Avenue, HUDSON, FL 34667
MLS# TB8497246Listed by: BLUEWATER BAY REALTY GROUP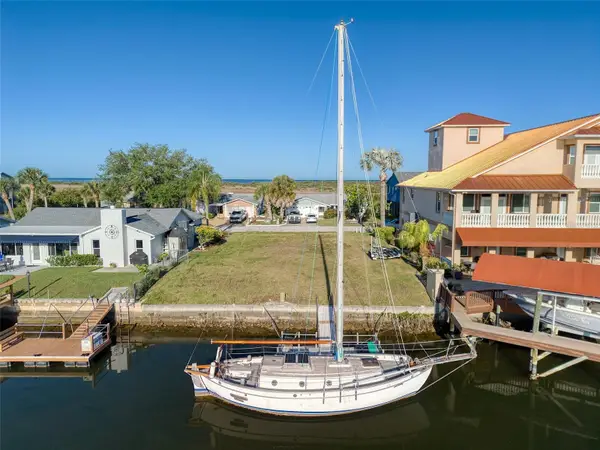 $320,000Active0.14 Acres
Southwind Drive #lot 130, HUDSON, FL 34667
MLS# TB8496853Listed by: COASTAL PROPERTIES GROUP INTERNATIONAL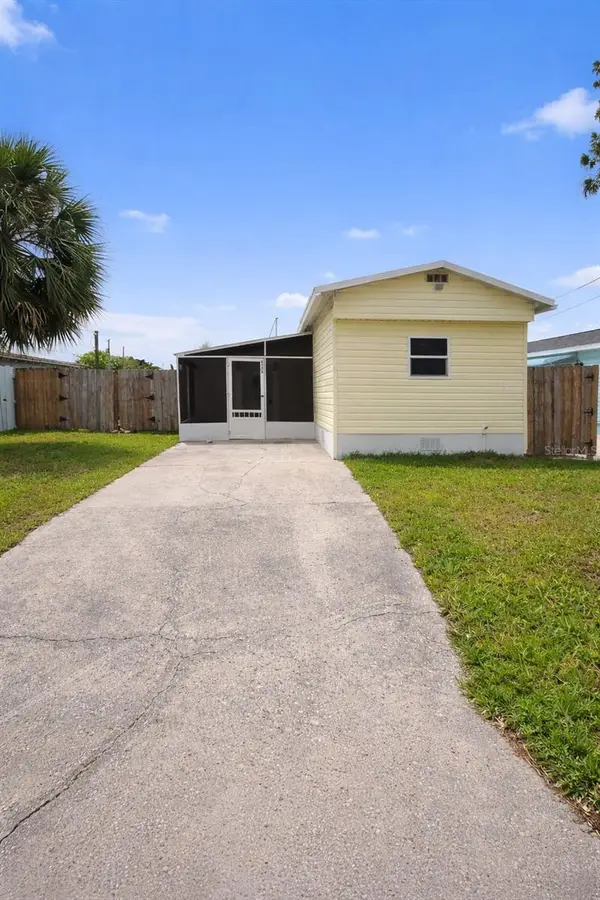 $214,900Active3 beds 2 baths780 sq. ft.
6726 Albatross Lane, HUDSON, FL 34667
MLS# TB8497308Listed by: CENTURY 21 CIRCLE $349,900Pending2 beds 2 baths1,278 sq. ft.
13531 Claudia Drive, HUDSON, FL 34667
MLS# W7884278Listed by: MERIDIAN REAL ESTATE $294,900Active3 beds 2 baths1,932 sq. ft.
13404 Rayburn Road, HUDSON, FL 34667
MLS# W7884807Listed by: REAL BROKER, LLC $129,000Active2 beds 2 baths960 sq. ft.
12019 Cartwright Drive, HUDSON, FL 34667
MLS# W7884804Listed by: FIND YOUR PARADISE $134,000Pending2 beds 2 baths1,029 sq. ft.
12518 Dearborn Drive #12518, HUDSON, FL 34667
MLS# W7884600Listed by: LPT REALTY, LLC $23,900Active0.16 Acres
8501 Gulf Way, HUDSON, FL 34667
MLS# O6398616Listed by: FLORIDA RE ANALYSTS, INC $175,000Active0.14 Acres
7435 Hatteras Drive, HUDSON, FL 34667
MLS# W7884786Listed by: GULF COAST FISHING HOMES RLTY $434,000Active3 beds 2 baths1,400 sq. ft.
12532 5th Isle, HUDSON, FL 34667
MLS# TB8496747Listed by: HOMEXPRESS REALTY, INC. $154,999Pending2 beds 2 baths1,100 sq. ft.
7318 Osage Drive, HUDSON, FL 34667
MLS# W7884719Listed by: SANDPEAK REALTY $374,500Pending2 beds 2 baths1,239 sq. ft.
7604 Hatteras Drive, HUDSON, FL 34667
MLS# TB8496661Listed by: HOMEXPRESS REALTY, INC.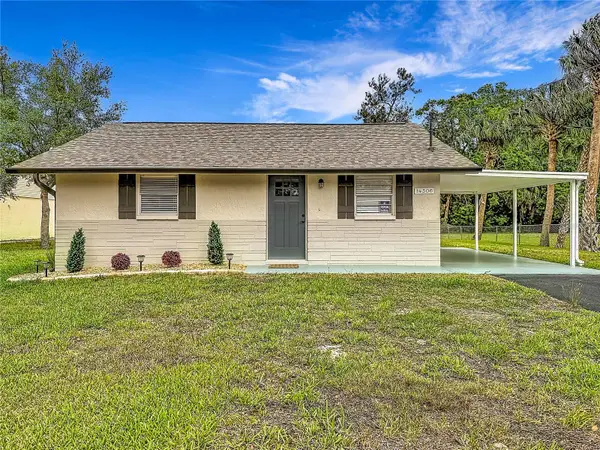 $219,900Active2 beds 1 baths812 sq. ft.
14306 Guava Street, HUDSON, FL 34667
MLS# TB8496311Listed by: DALTON WADE INC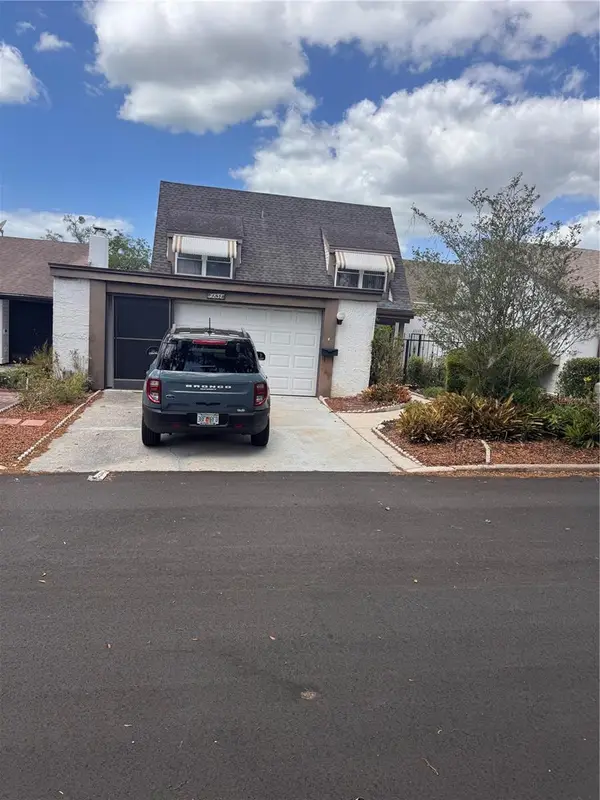 $210,000Pending3 beds 3 baths1,732 sq. ft.
7831 Bridle Path Row, HUDSON, FL 34667
MLS# TB8496625Listed by: CHARLES RUTENBERG REALTY INC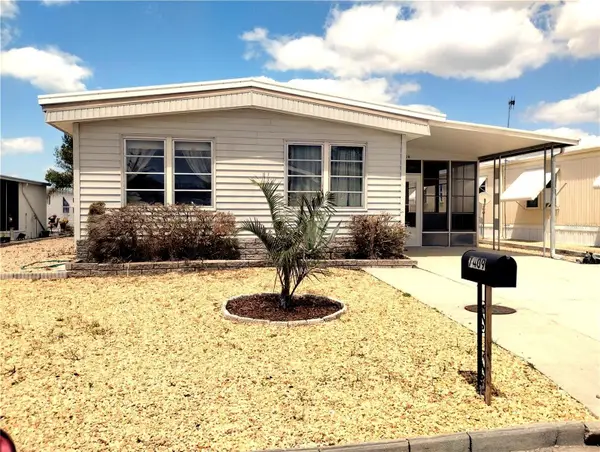 $129,000Active3 beds 2 baths1,064 sq. ft.
7409 Skyline Drive, HUDSON, FL 34667
MLS# W7884734Listed by: SUCCESS PROPERTY MANAGEMENT IN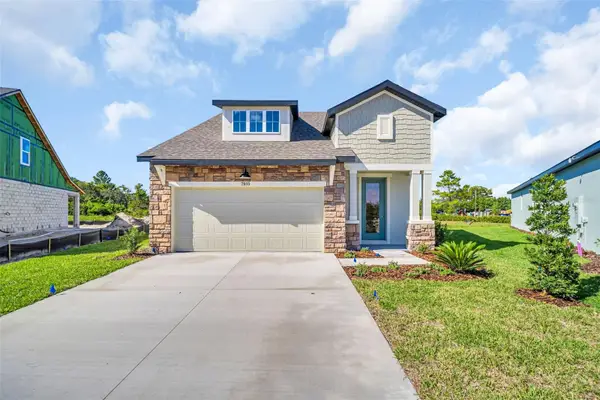 $373,818Active3 beds 3 baths1,819 sq. ft.
13718 Homeridge Court, HUDSON, FL 34667
MLS# R4911029Listed by: ON POINT REALTY INC. $369,900Active4 beds 3 baths1,983 sq. ft.
12709 Castleberry Court, HUDSON, FL 34667
MLS# W7884700Listed by: STROMER GROUP INC $265,000Pending3 beds 2 baths1,615 sq. ft.
8501 Mill Creek Lane, HUDSON, FL 34667
MLS# W7884704Listed by: HOMAN REALTY GROUP INC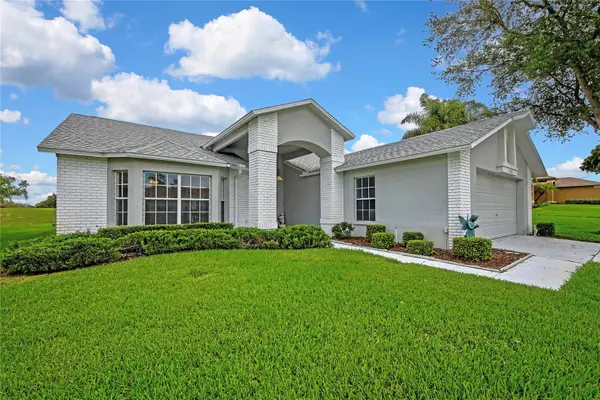 $300,000Active3 beds 2 baths2,131 sq. ft.
11203 Sun Tree Road, HUDSON, FL 34667
MLS# TB8495718Listed by: DALTON WADE INC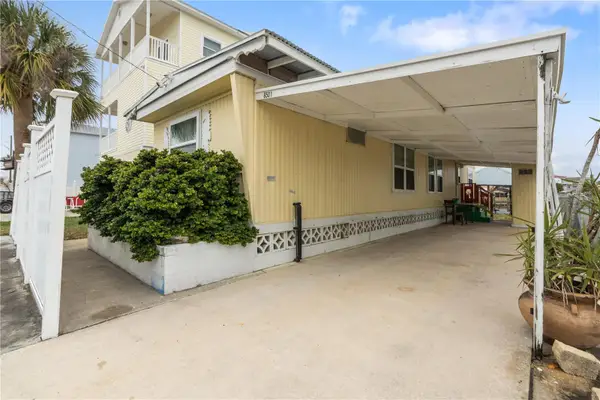 $259,900Active2 beds 2 baths890 sq. ft.
6501 Clark Street, HUDSON, FL 34667
MLS# W7883957Listed by: RE/MAX SUNSET REALTY $195,000Pending2 beds 2 baths1,068 sq. ft.
8515 Windy Hill Lane, HUDSON, FL 34667
MLS# W7884698Listed by: KELLER WILLIAMS REALTY- PALM H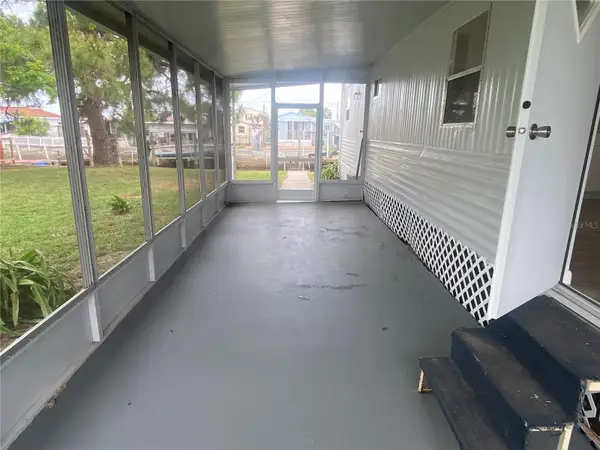 $154,150Active2 beds 1 baths564 sq. ft.
6841 Osprey Lane, HUDSON, FL 34667
MLS# W7884691Listed by: NEXTHOME CABANAS REALTY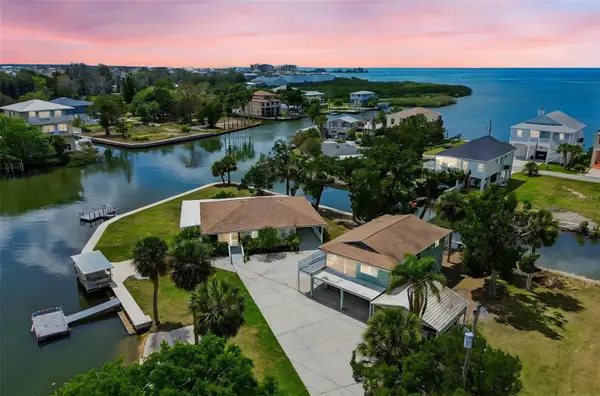 $897,000Active5 beds 3 baths2,254 sq. ft.
14539 Coffey Lane, HUDSON, FL 34667
MLS# O6398968Listed by: BEYCOME OF FLORIDA LLC $265,000Active3 beds 2 baths1,683 sq. ft.
18452 Fairway Green Drive, HUDSON, FL 34667
MLS# W7884667Listed by: RE/MAX MARKETING SPECIALISTS $65,000Pending3 beds 2 baths1,000 sq. ft.
7515 Maryland Avenue, HUDSON, FL 34667
MLS# TB8495228Listed by: FUTURE HOME REALTY INC $224,900Active2 beds 2 baths1,292 sq. ft.
12302 Cobble Stone Drive, HUDSON, FL 34667
MLS# TB8495397Listed by: FUTURE HOME REALTY INC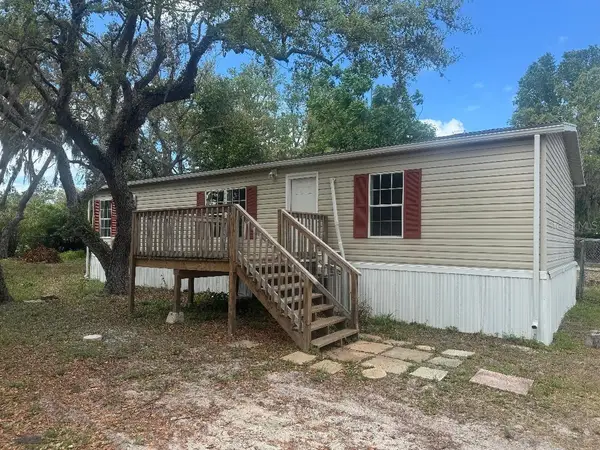 $149,900Pending3 beds 2 baths1,152 sq. ft.
15341 Omaha Street, HUDSON, FL 34667
MLS# W7884677Listed by: TROPIC SHORES REALTY LLC $399,000Active3 beds 2 baths1,712 sq. ft.
13724 Cox Avenue, HUDSON, FL 34667
MLS# TB8494315Listed by: LPT REALTY, LLC $77,400Active0.64 Acres
Lot 111 Winding Oaks Boulevard, HUDSON, FL 34667
MLS# TB8494781Listed by: COLDWELL BANKER REALTY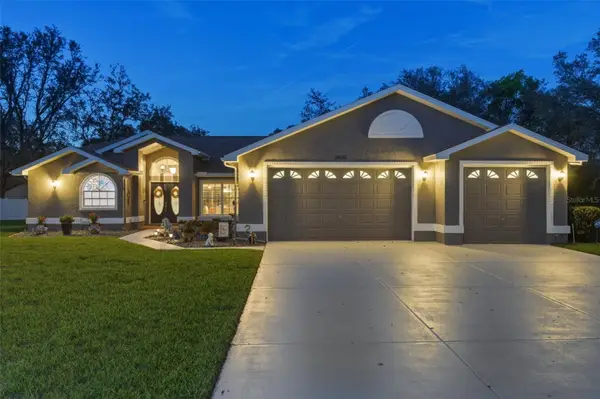 $465,000Pending3 beds 2 baths2,078 sq. ft.
18143 Winding Oaks Boulevard, HUDSON, FL 34667
MLS# TB8492691Listed by: FUTURE HOME REALTY INC $442,000Active3 beds 2 baths2,075 sq. ft.
9101 Luncarty Drive, HUDSON, FL 34667
MLS# TB8493844Listed by: CENTURY 21 CIRCLE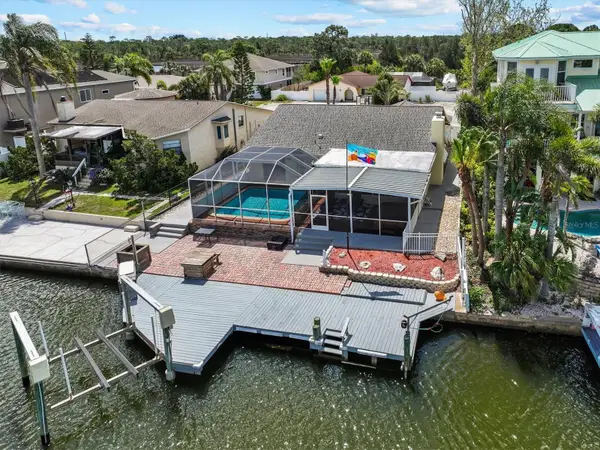 $599,900Active3 beds 2 baths2,002 sq. ft.
7239 Southwind Drive, HUDSON, FL 34667
MLS# W7884580Listed by: GULF COAST FISHING HOMES RLTY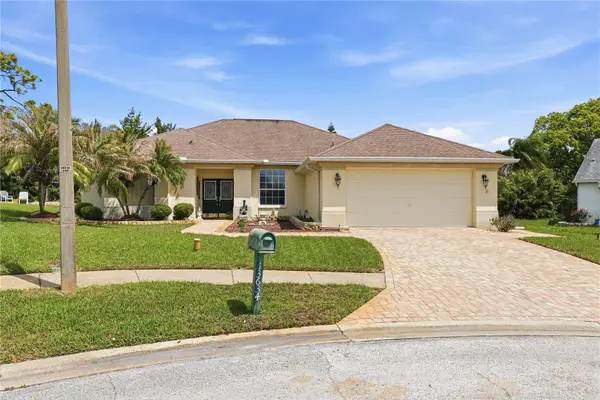 $365,000Pending3 beds 2 baths1,776 sq. ft.
13634 Muffin Court, HUDSON, FL 34667
MLS# TB8494651Listed by: REAL BROKER, LLC $328,884Active3 beds 2 baths1,472 sq. ft.
7994 Chandler Lake Court #Lot 16, HUDSON, FL 34667
MLS# R4910978Listed by: ON POINT REALTY INC. $89,900Active0.09 Acres
14815 Old Dixie Highway, HUDSON, FL 34667
MLS# TB8494562Listed by: RE/MAX CHAMPIONS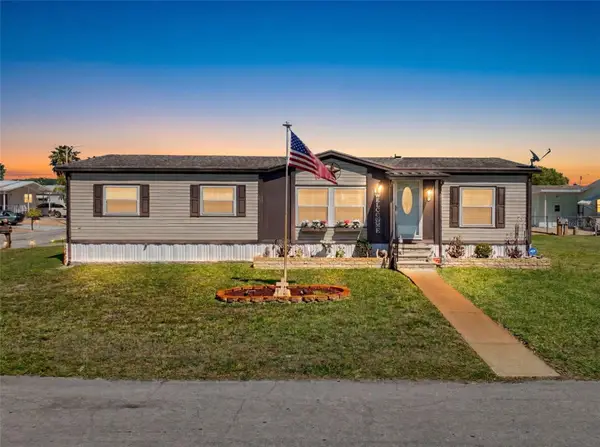 $179,900Active4 beds 2 baths1,456 sq. ft.
7300 Osage Drive, HUDSON, FL 34667
MLS# W7884588Listed by: RE/MAX SUNSET REALTY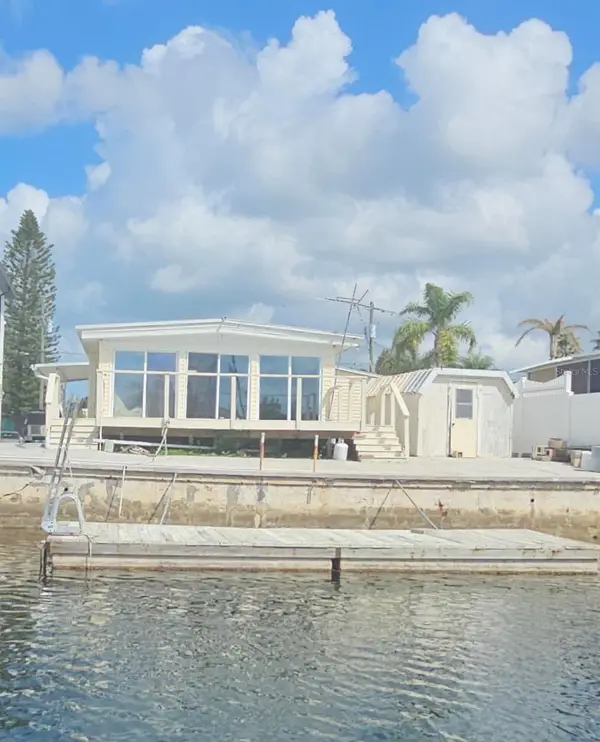 $179,900Pending2 beds 2 baths1,680 sq. ft.
13144 Coxswain Court, HUDSON, FL 34667
MLS# TB8493553Listed by: CHARLES RUTENBERG REALTY INC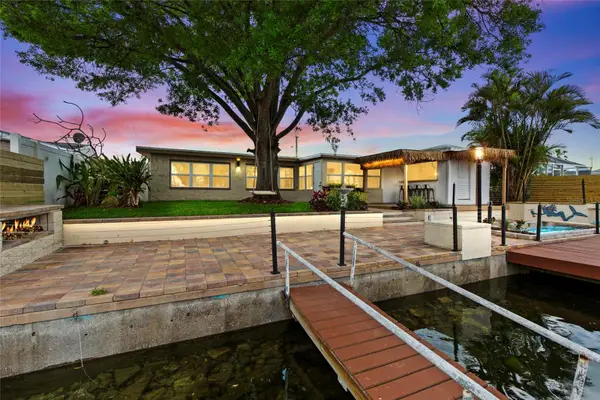 $555,000Active4 beds 2 baths2,048 sq. ft.
13626 Allyn Drive, HUDSON, FL 34667
MLS# TB8492897Listed by: EXP REALTY LLC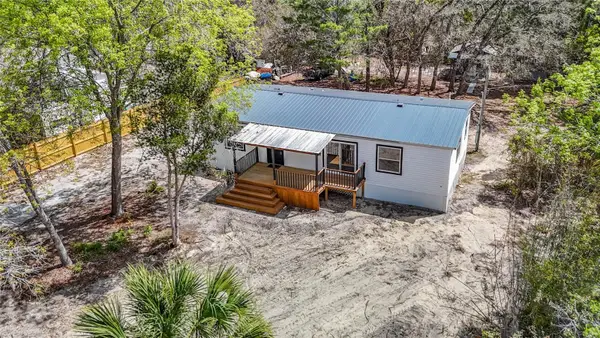 $310,000Pending3 beds 2 baths1,344 sq. ft.
17420 Thomas Boulevard, HUDSON, FL 34667
MLS# W7884200Listed by: RE/MAX SUNSET REALTY $380,000Active2 beds 2 baths1,332 sq. ft.
6645 Harbor Drive, HUDSON, FL 34667
MLS# W7884505Listed by: SAILWINDS REALTY $439,900Active3 beds 2 baths1,472 sq. ft.
7114 Fair Lane, HUDSON, FL 34667
MLS# W7884559Listed by: GULF COAST FISHING HOMES RLTY $349,900Active2 beds 1 baths864 sq. ft.
13603 Britton Drive, HUDSON, FL 34667
MLS# W7884557Listed by: GULF COAST FISHING HOMES RLTY $299,900Active3 beds 2 baths1,967 sq. ft.
11718 Wheatfield Loop, HUDSON, FL 34667
MLS# W7884502Listed by: RE/MAX MARKETING SPECIALISTS $398,500Active4 beds 2 baths2,010 sq. ft.
9273 Highland Hills Drive, HUDSON, FL 34667
MLS# TB8493927Listed by: JACK KELLER INC $445,000Pending3 beds 2 baths2,054 sq. ft.
14640 Balloch Drive, HUDSON, FL 34667
MLS# TB8493407Listed by: RE/MAX REALTEC GROUP INC $349,900Active2 beds 2 baths1,311 sq. ft.
13726 Michelle Avenue, HUDSON, FL 34667
MLS# TB8493763Listed by: REALTY HUB $239,900Pending3 beds 2 baths1,548 sq. ft.
16026 Surrey Drive, HUDSON, FL 34667
MLS# W7884522Listed by: LISTINGSFOR1.COM $135,000Active3 beds 2 baths1,056 sq. ft.
7402 Cascade Drive, HUDSON, FL 34667
MLS# TB8491653Listed by: THE SOMERDAY GROUP PL $130,000Active2 beds 2 baths720 sq. ft.
13120 Ballast Court, HUDSON, FL 34667
MLS# TB8499049Listed by: EXP REALTY LLC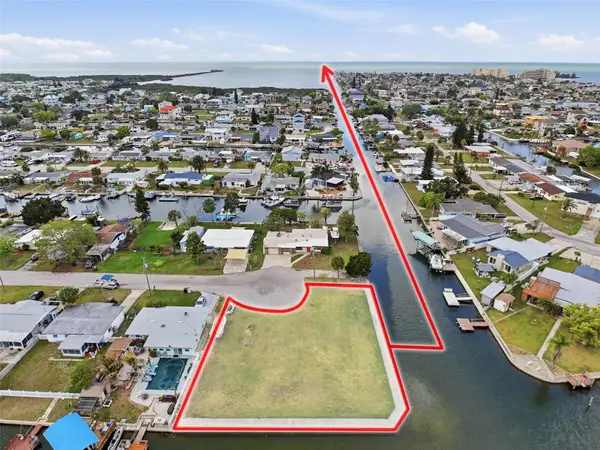 $329,000Active0.25 Acres
LOT 24 Carol Drive, HUDSON, FL 34667
MLS# W7884312Listed by: FLORIDA LUXURY REALTY INC $629,000Pending3 beds 3 baths2,828 sq. ft.
18805 Kelly Road, SPRING HILL, FL 34610
MLS# W7884407Listed by: RE/MAX MARKETING SPECIALISTS $325,000Pending3 beds 2 baths1,722 sq. ft.
18329 Arbor Crest Drive, HUDSON, FL 34667
MLS# TB8492701Listed by: RE/MAX REALTEC GROUP INC $399,900Active2 beds 2 baths1,271 sq. ft.
13538 Leslie Drive, HUDSON, FL 34667
MLS# W7884429Listed by: GULF COAST FISHING HOMES RLTY $589,900Active5 beds 3 baths2,711 sq. ft.
7595 Hatteras Drive, Navarre, FL 32566
MLS# 999360Listed by: HERBST REALTY LLC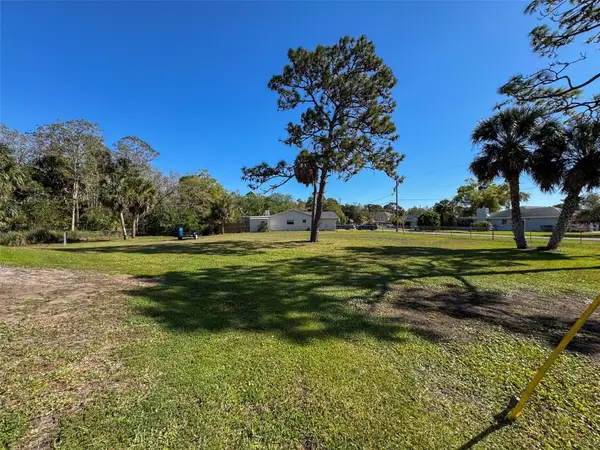 $49,000Active0.34 Acres
Indies Drive, HUDSON, FL 34667
MLS# TB8492321Listed by: REAL ESTATE SOLUTIONS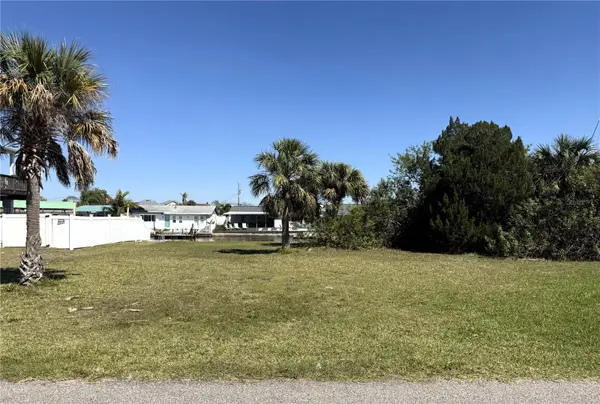 $264,900Active0.13 Acres
13908 King, HUDSON, FL 34667
MLS# W7884047Listed by: FLORIDA LUXURY REALTY INC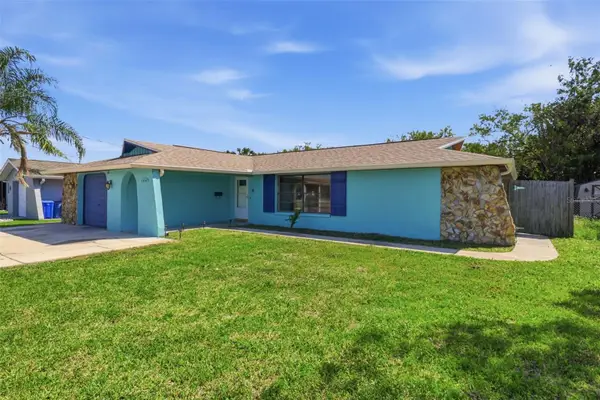 $229,000Active3 beds 2 baths1,400 sq. ft.
12816 1st Isle, HUDSON, FL 34667
MLS# W7884344Listed by: EPIQUE REALTY INC $599,999Pending3 beds 3 baths2,266 sq. ft.
18520 Oak Way Drive, HUDSON, FL 34667
MLS# W7884304Listed by: BHHS FLORIDA PROPERTIES GROUP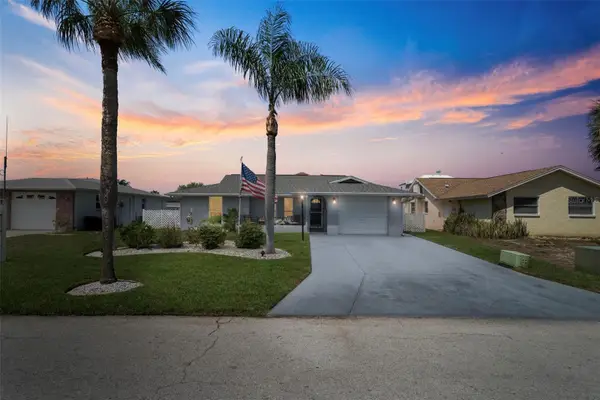 $479,900Active2 beds 2 baths1,218 sq. ft.
15627 Donzi Drive, HUDSON, FL 34667
MLS# W7884295Listed by: RE/MAX SUNSET REALTY $450,000Active2 beds 2 baths1,008 sq. ft.
6403 Lonnie Lee Lane, HUDSON, FL 34667
MLS# TB8488457Listed by: COASTAL PROPERTIES GROUP INTERNATIONAL $120,000Active2 beds 2 baths1,066 sq. ft.
10321 Marinette Avenue, HUDSON, FL 34667
MLS# W7883918Listed by: RE/MAX SUNSET REALTY $424,900Pending3 beds 2 baths2,090 sq. ft.
13944 Talmage Loop, HUDSON, FL 34667
MLS# W7884206Listed by: ISLAND REAL EST&PROP MGMT INC $415,000Active4 beds 2 baths1,656 sq. ft.
12527 1st Isle, HUDSON, FL 34667
MLS# TB8490855Listed by: DALTON WADE INC $77,000Active0.29 Acres
0 Gulf Way, HUDSON, FL 34667
MLS# TB8489140Listed by: DISCOVERY PROPERTIES GROUP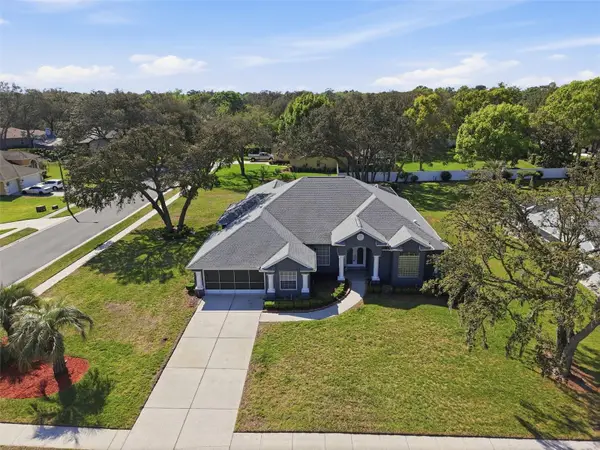 $524,500Pending3 beds 3 baths2,597 sq. ft.
18729 Bascomb Lane, HUDSON, FL 34667
MLS# W7884259Listed by: DALTON WADE INC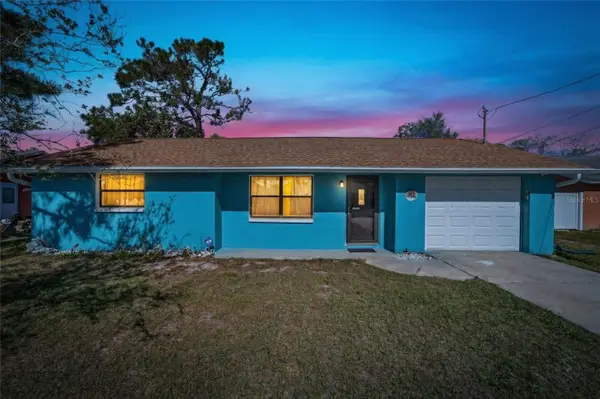 $224,900Active2 beds 2 baths1,018 sq. ft.
15821 Adobe Drive, HUDSON, FL 34667
MLS# TB8489749Listed by: FLORIDA'S 1ST CHOICE RLTY LLC $149,900Active0.14 Acres
13939 Muriel Drive, HUDSON, FL 34667
MLS# W7884262Listed by: GULF COAST FISHING HOMES RLTY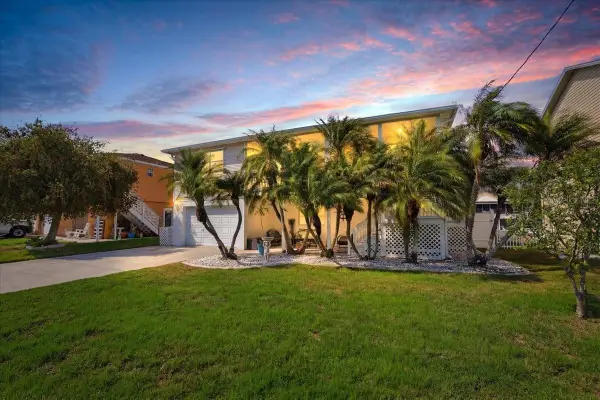 $669,999Active4 beds 3 baths1,472 sq. ft.
7611 Mako Drive, HUDSON, FL 34667
MLS# TB8490972Listed by: SYNERGY GROUP OF FLORIDA LLC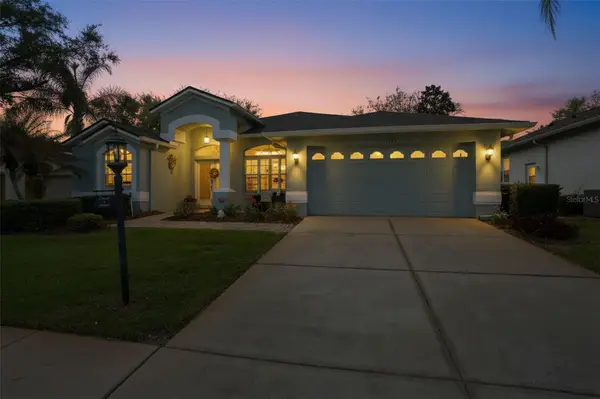 $304,900Active3 beds 2 baths1,963 sq. ft.
11408 Alden Court, HUDSON, FL 34667
MLS# W7884178Listed by: HORIZON PALM REALTY GROUP $215,000Active2 beds 2 baths1,226 sq. ft.
7840 Gulf Way, HUDSON, FL 34667
MLS# TB8489517Listed by: NETWORTH REALTY OF TAMPA, LLC $520,000Active3 beds 2 baths2,100 sq. ft.
14024 Warm Springs Court, HUDSON, FL 34667
MLS# W7884251Listed by: CHARLES RUTENBERG REALTY INC $285,000Active2 beds 2 baths1,805 sq. ft.
11131 Hollander Avenue, HUDSON, FL 34667
MLS# W7883439Listed by: F I GREY & SON RESIDENTIAL $189,900Active2 beds 2 baths1,318 sq. ft.
8511 Long Boat Lane, HUDSON, FL 34667
MLS# TB8486520Listed by: PEOPLE'S TRUST REALTY $259,000Active3 beds 3 baths1,732 sq. ft.
7501 Woodbox Row, HUDSON, FL 34667
MLS# TB8488760Listed by: PINEYWOODS REALTY LLC $529,900Pending4 beds 2 baths2,404 sq. ft.
7589 Hatteras Drive, Navarre, FL 32566
MLS# 998753Listed by: HERBST REALTY LLC $232,000Active3 beds 2 baths1,771 sq. ft.
8702 Village Mill Row, HUDSON, FL 34667
MLS# TB8489145Listed by: EXIT BAYSHORE REALTY $115,000Active2 beds 2 baths1,029 sq. ft.
12500 Dearborn Drive #F, HUDSON, FL 34667
MLS# W7884157Listed by: FLORIDA REAL ESTATE PARTNERS $255,000Active3 beds 2 baths1,924 sq. ft.
16124 Frost Drive, HUDSON, FL 34667
MLS# W7884139Listed by: PARADISE WEST REALTY, INC $380,000Active2 beds 2 baths1,862 sq. ft.
18427 Water Lily Lane, HUDSON, FL 34667
MLS# W7884074Listed by: HORIZON PALM REALTY GROUP $35,000Active0.14 Acres
14101 Plum Lane, HUDSON, FL 34667
MLS# W7884107Listed by: F I GREY & SON RESIDENTIAL $199,000Active2 beds 1 baths1,048 sq. ft.
6820 Sea Ranch Drive, HUDSON, FL 34667
MLS# W7884082Listed by: FLORIDA LUXURY REALTY INC $449,000Active3 beds 2 baths1,732 sq. ft.
12825 5th Isle, HUDSON, FL 34667
MLS# TB8488906Listed by: ALIGN RIGHT REALTY LLC $799,900Active3 beds 4 baths2,246 sq. ft.
6441 Clark Street, HUDSON, FL 34667
MLS# TB8488109Listed by: BLUE SUN REALTY LLC $129,500Active2 beds 2 baths1,144 sq. ft.
12820 Wedgewood Way #D, HUDSON, FL 34667
MLS# TB8488811Listed by: LAWRENCE W SCADUTO LLC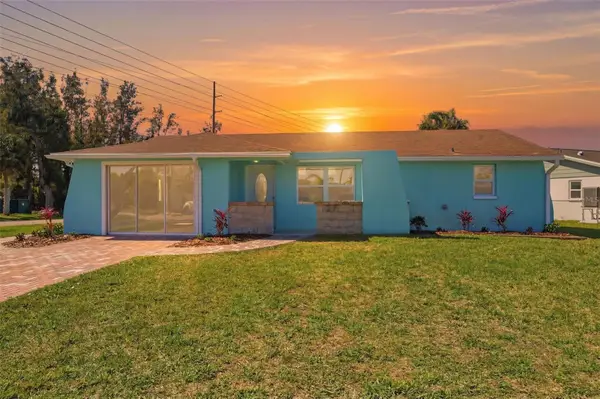 $249,900Active3 beds 3 baths1,576 sq. ft.
7608 Yachtsman Drive, HUDSON, FL 34667
MLS# W7884056Listed by: RE/MAX MARKETING SPECIALISTS $349,900Active3 beds 2 baths2,035 sq. ft.
8210 Valley Stream Lane, HUDSON, FL 34667
MLS# W7883809Listed by: FLORIDA LUXURY REALTY $155,000Active2 beds 2 baths1,049 sq. ft.
7804 Eureka Drive, HUDSON, FL 34667
MLS# TB8487347Listed by: SILVER ROOTS REAL ESTATE GROUP $267,900Active3 beds 2 baths1,711 sq. ft.
8210 Clover Hill Loop, HUDSON, FL 34667
MLS# O6391926Listed by: REALTY HUB $360,000Active3 beds 2 baths1,979 sq. ft.
14753 Potterton Circle, HUDSON, FL 34667
MLS# W7884020Listed by: FUTURE HOME REALTY $831,900Pending3 beds 3 baths2,995 sq. ft.
17545 Lippizan Lane, HUDSON, FL 34667
MLS# TB8487998Listed by: LGI REALTY- FLORIDA, LLC $224,900Active1 beds 1 baths733 sq. ft.
6009 Sea Ranch Drive #303, HUDSON, FL 34667
MLS# TB8484712Listed by: LPT REALTY, LLC $130,000Active0.24 Acres
LOTS 13 & 14 Sheepshead Drive, HUDSON, FL 34667
MLS# TB8487252Listed by: RE/MAX CHAMPIONS $59,000Active0.12 Acres
Lot 34 Indigo Lane, HUDSON, FL 34667
MLS# W7883961Listed by: RE/MAX MARKETING SPECIALISTS $239,999Active2 beds 2 baths900 sq. ft.
8302 Split Rail Lane, HUDSON, FL 34667
MLS# S5145524Listed by: FLORIDA REALTY TEAM OF CENTRAL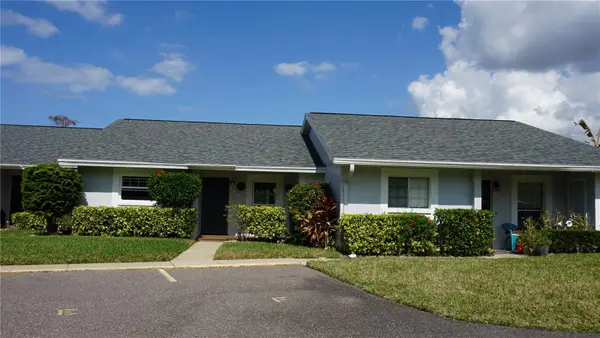 $169,900Active2 beds 2 baths1,125 sq. ft.
7602 Danube Drive, HUDSON, FL 34667
MLS# W7883923Listed by: RE/MAX SUNSET REALTY $399,000Active2 beds 2 baths1,098 sq. ft.
13701 Veronica Drive, HUDSON, FL 34667
MLS# W7882968Listed by: FLORIDA LUXURY REALTY INC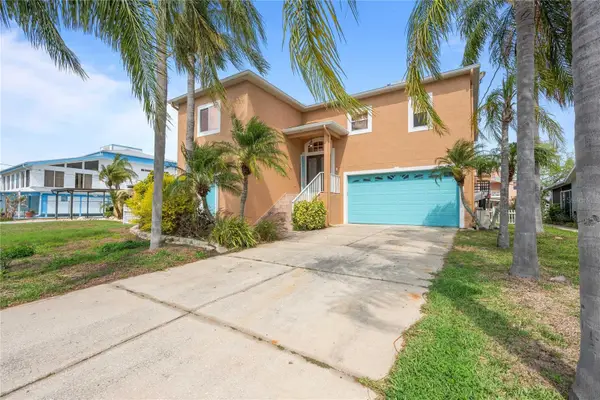 $599,900Active3 beds 3 baths1,630 sq. ft.
7533 Hatteras Drive, HUDSON, FL 34667
MLS# TB8486895Listed by: ELITE BROKERS, LLC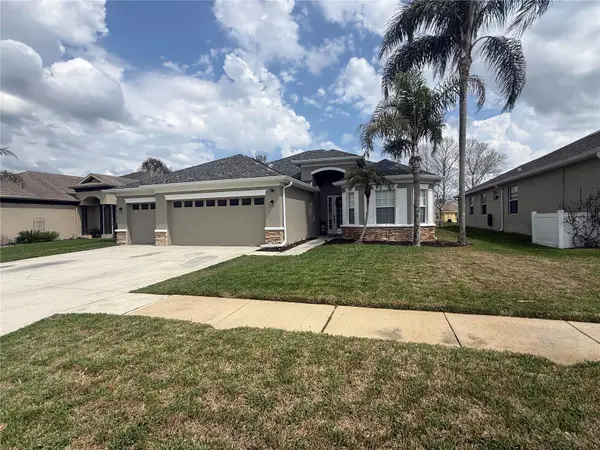 $429,899Active4 beds 3 baths2,432 sq. ft.
14238 Beauly Circle, HUDSON, FL 34667
MLS# O6390905Listed by: BEYCOME OF FLORIDA LLC $339,999Active3 beds 2 baths1,462 sq. ft.
13727 Coco, HUDSON, FL 34667
MLS# TB8486650Listed by: INSPIRED REALTY, LLC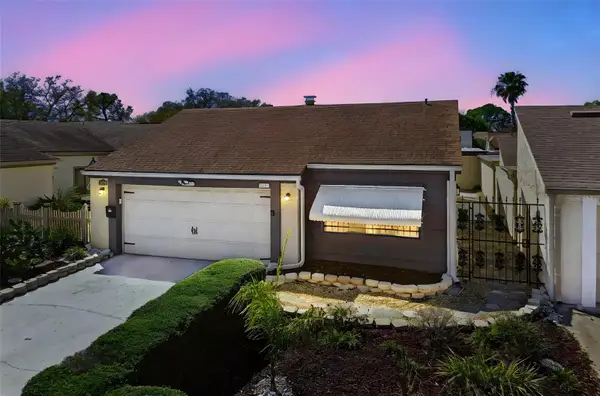 $245,000Active2 beds 2 baths1,464 sq. ft.
12501 Hitching Post Lane, HUDSON, FL 34667
MLS# TB8479200Listed by: FUTURE HOME REALTY INC $125,000Active0.53 Acres
14569 and 0 Coral Drive, HUDSON, FL 34667
MLS# TB8486346Listed by: KELLER WILLIAMS TAMPA PROP. $555,000Active3 beds 3 baths1,726 sq. ft.
6810 Seaview Boulevard, HUDSON, FL 34667
MLS# W7883829Listed by: TROPIC SHORES REALTY LLC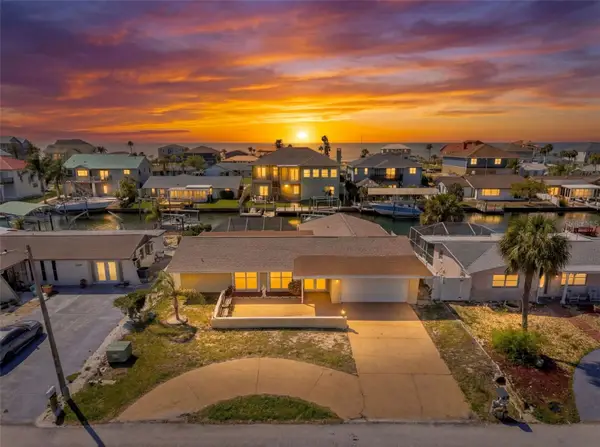 $470,000Pending4 beds 2 baths1,736 sq. ft.
13541 Stacey Drive, HUDSON, FL 34667
MLS# W7883859Listed by: TROPIC SHORES REALTY LLC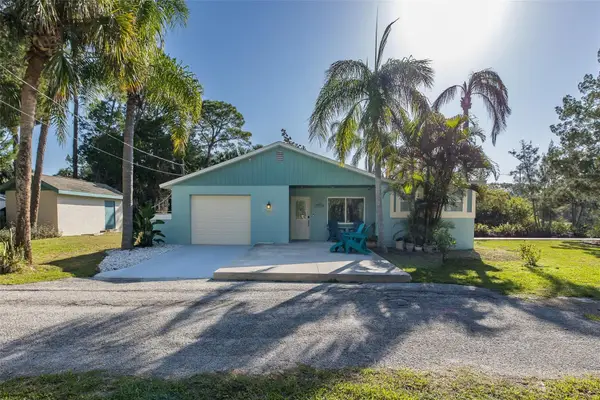 $399,000Active2 beds 2 baths1,300 sq. ft.
14616 Blessing Lane, HUDSON, FL 34667
MLS# W7883818Listed by: RE/MAX ALLIANCE GROUP $6,500,000Active3 beds 3 baths1,936 sq. ft.
13615 Tyrone Street, HUDSON, FL 34667
MLS# O6381472Listed by: SAUNDERS REAL ESTATE, LLC $544,900Active4 beds 3 baths2,483 sq. ft.
7604 Hatteras Drive, Navarre, FL 32566
MLS# 997631Listed by: HERBST REALTY LLC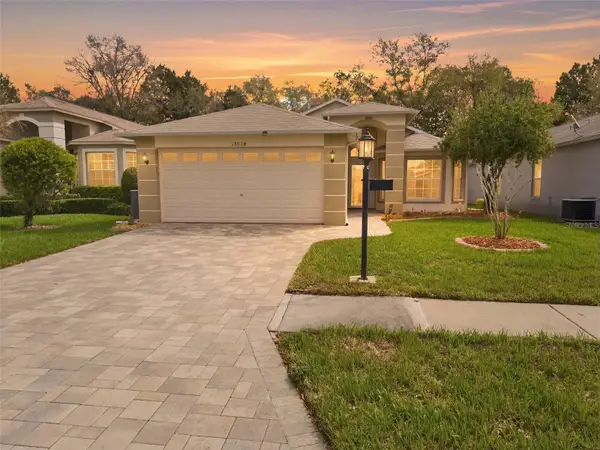 $279,900Pending3 beds 2 baths1,683 sq. ft.
18038 Webster Grove Drive, HUDSON, FL 34667
MLS# W7883774Listed by: F I GREY & SON RESIDENTIAL $375,000Active2 beds 2 baths1,494 sq. ft.
6509 Nautical Isle, HUDSON, FL 34667
MLS# TB8483493Listed by: EZ CHOICE REALTY $59,900Pending0.27 Acres
7410 New York Avenue, HUDSON, FL 34667
MLS# W7883736Listed by: EXP REALTY LLC $279,000Pending3 beds 2 baths1,820 sq. ft.
14136 Whitecap Avenue, HUDSON, FL 34667
MLS# W7883501Listed by: KW REALTY ELITE PARTNERS $310,000Active3 beds 2 baths1,921 sq. ft.
18735 Rolling Hills Loop, HUDSON, FL 34667
MLS# TB8484450Listed by: PREFERRED PROPERTY ASSOC INC $479,900Pending4 beds 2 baths2,169 sq. ft.
7600 Hatteras Drive, Navarre, FL 32566
MLS# 997386Listed by: HERBST REALTY LLC $225,000Active2 beds 2 baths1,020 sq. ft.
7434 Mako Drive, HUDSON, FL 34667
MLS# W7883711Listed by: SIRROM REALTY LLC $275,000Pending3 beds 2 baths2,065 sq. ft.
8320 Pavilion Drive, HUDSON, FL 34667
MLS# TB8476532Listed by: DALTON WADE INC $124,900Active2 beds 2 baths1,344 sq. ft.
7406 Stillwater Drive, Hudson, FL 34667
MLS# 852651Listed by: RE/MAX REALTY ONE
Local realty services provided by:CENTURY 21 Circle, CENTURY 21 North East, CENTURY 21 First Story Real Estate, CENTURY 21 Carioti, CENTURY 21 Affiliates, CENTURY 21 Ryan Realty
The information being provided by Stellar Mls is for the consumer's personal, non-commercial use and may not be used for any purpose other than to identify prospective properties consumer may be interested in purchasing. Any information relating to real estate for sale referenced on this web site comes from the Internet Data Exchange (IDX) program of the Stellar Mls. CENTURY 21 Circle is not a Multiple Listing Service (MLS), nor does it offer MLS access. This website is a service of CENTURY 21 Circle, a broker participant of Stellar Mls. This web site may reference real estate listing(s) held by a brokerage firm other than the broker and/or agent who owns this web site.
The accuracy of all information, regardless of source, including but not limited to open house information, square footages and lot sizes, is deemed reliable but not guaranteed and should be personally verified through personal inspection by and/or with the appropriate professionals. The data contained herein is copyrighted by Stellar Mls and is protected by all applicable copyright laws. Any unauthorized dissemination of this information is in violation of copyright laws and is strictly prohibited.
Properties in listings may have been sold or may no longer be available.
Copyright 2026 Stellar Mls. All rights reserved.
Information deemed reliable but not guaranteed. Information is provided, in part, by Greater Miami MLS. This information being provided is for consumer's personal, non-commercial use and may not be used for any other purpose other than to identify prospective properties consumers may be interested in purchasing. SEFMLS Member Broker: Albert Carioti
Popular searches near 34667
Popular neighborhoods near 34667
- Aripeka, Aripeka homes for sale
- Aripeka Sandhills Preserve, Hudson homes for sale
- Arlington, Hudson homes for sale
- Bayonet Point, Port Richey homes for sale
- Forest Acres, New Port Richey homes for sale
- Golden Acres, New Port Richey homes for sale
- Gulf View, Hudson homes for sale
- Heritage Pines, Hudson homes for sale
- Hudson, Hudson homes for sale
- Hudson Grove, Hudson homes for sale
- Hudson Grove Estates, Shady Hills homes for sale
- Jasmine Estates, Port Richey homes for sale
- Meadow Oaks, Hudson homes for sale
- Moon Lake, New Port Richey homes for sale
- Parkwood Acres, Hudson homes for sale
- Summertree, New Port Richey homes for sale
- Sunnydale, Hudson homes for sale
- Timber Oaks, Port Richey homes for sale
- Timberwood Acres, Hudson homes for sale
- Warner - Boyce Salt Springs, Port Richey homes for sale
Counties near Hudson, 34667
- Alachua County homes for sale
- Citrus County homes for sale
- DeSoto County homes for sale
- Dixie County homes for sale
- Gilchrist County homes for sale
- Hardee County homes for sale
- Hernando County homes for sale
- Hillsborough County homes for sale
- Lake County homes for sale
- Levy County homes for sale
- Manatee County homes for sale
- Marion County homes for sale
- Orange County homes for sale
- Osceola County homes for sale
- Pasco County homes for sale
- Pinellas County homes for sale
- Polk County homes for sale
- Sarasota County homes for sale
- Seminole County homes for sale
- Sumter County homes for sale
Protect your home and budget from life's surprises with an Assurant Home Warranty, backed by a partner that supports you through every step of homeownership. Explore Plans.
©2026 Century 21 Real Estate LLC. All rights reserved. CENTURY 21®, the CENTURY 21 Logo and C21® are service marks owned by Century 21 Real Estate LLC. Century 21 Real Estate LLC fully supports the principles of the Fair Housing Act and the Equal Opportunity Act. Each office is independently owned and operated. Listing information is deemed reliable but not guaranteed accurate.