- Bull Valley homes for sale
- Crystal Lake homes for sale
- Dorr homes for sale
- Grant homes for sale
- Greenwood Township homes for sale
- Island Lake homes for sale
- Johnsburg homes for sale
- Lakemoor homes for sale
- McCullom Lake homes for sale
- McHenry township homes for sale
- McHenry homes for sale
- Nunda homes for sale
- Oakwood Hills homes for sale
- Pistakee Highlands homes for sale
- Prairie Grove homes for sale
- Ridgefield homes for sale
- Ringwood homes for sale
- Volo homes for sale
- Wonder Lake homes for sale
- Woodstock homes for sale
60050, IL - homes for sale
188 of 188 results displayed
- New
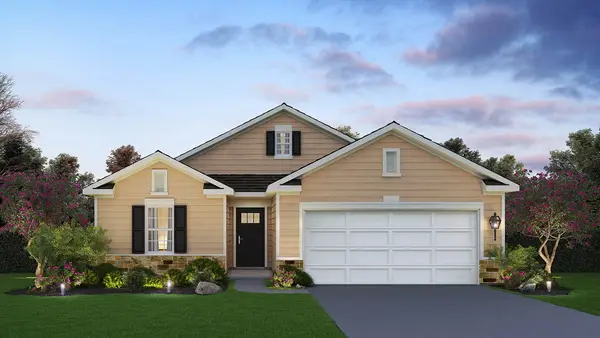
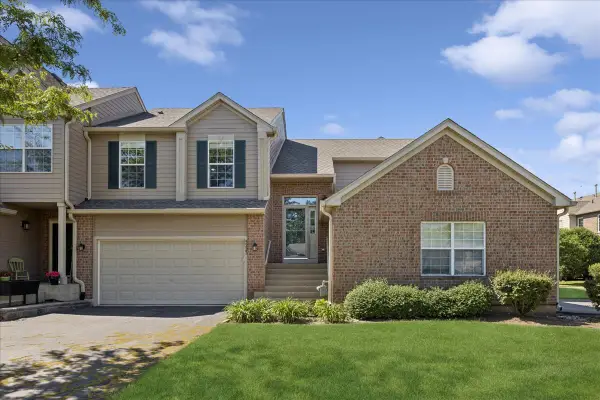
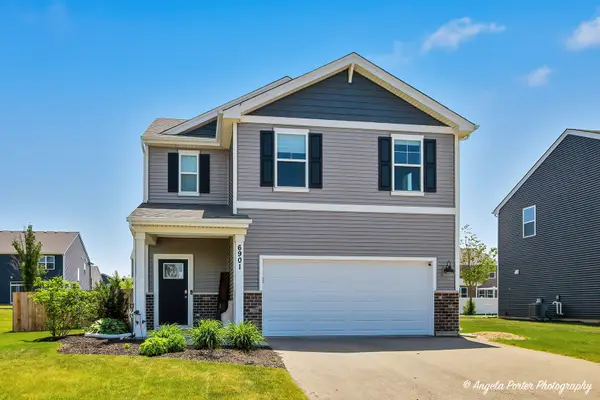 $384,000Active4 beds 3 baths1,847 sq. ft.
6901 Spruce Court, Wonder Lake, IL 60097
MLS# 12663240Listed by: RE/MAX PLAZA
- Open Sat, 12 to 2pmNew
 $209,900Active2 beds 2 baths1,154 sq. ft.
320 N Thornwood Drive #320, McHenry, IL 60050
MLS# 12656785Listed by: REALTY EXECUTIVES CORNERSTONE - New
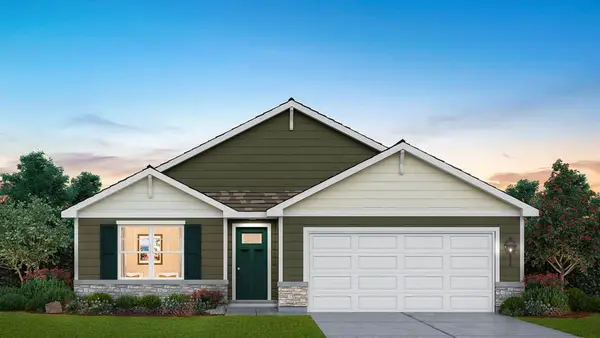 $329,990Active3 beds 2 baths1,498 sq. ft.
2276 Redwood Trail, Wonder Lake, IL 60097
MLS# 12662140Listed by: DAYNAE GAUDIO - New
 $649,900Active3 beds 2 baths1,813 sq. ft.
2901 Gregg Drive, McHenry, IL 60050
MLS# 12661590Listed by: KELLER WILLIAMS SUCCESS REALTY - New
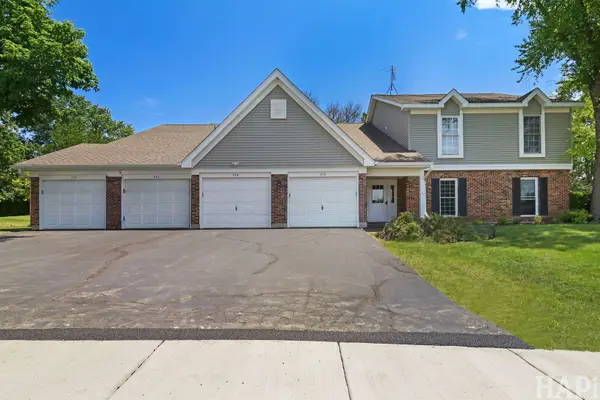
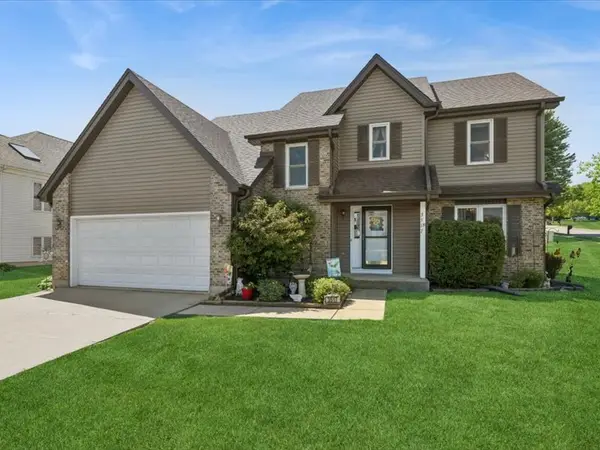
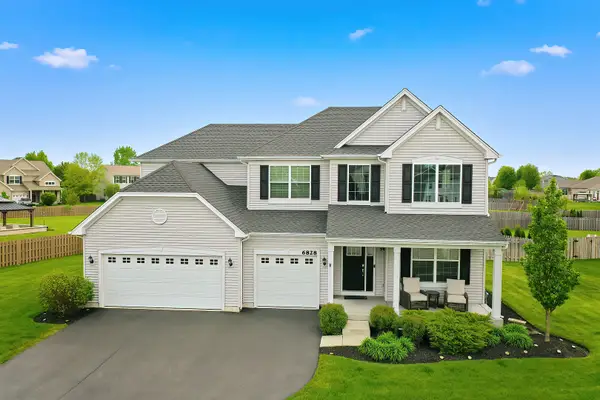 $525,000Active4 beds 3 baths3,146 sq. ft.
6828 Galway Drive, McHenry, IL 60050
MLS# 12662123Listed by: KELLER WILLIAMS NORTH SHORE WEST - New
 $339,990Active2 beds 2 baths1,660 sq. ft.
2274 Redwood Trail, Wonder Lake, IL 60097
MLS# 12662182Listed by: DAYNAE GAUDIO - Open Sat, 12 to 2pmNew
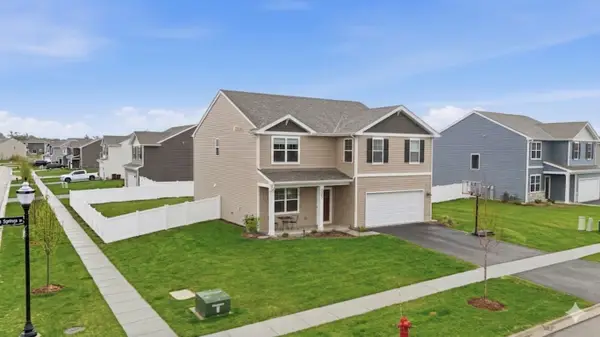
 $405,000Active4 beds 3 baths2,320 sq. ft.
3517 Turnberry Drive, McHenry, IL 60050
MLS# 12655513Listed by: BAIRD & WARNER 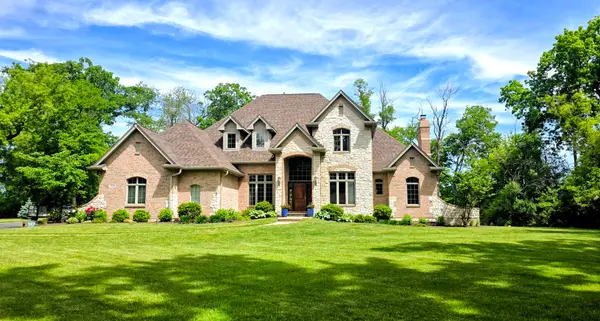 $695,000Pending5 beds 4 baths4,500 sq. ft.
7508 Forest Oak Drive, McHenry, IL 60050
MLS# 12659751Listed by: BERKSHIRE HATHAWAY HOMESERVICES STARCK REAL ESTATE- New
 $435,000Active4 beds 3 baths2,600 sq. ft.
2282 Cobble Springs Drive, Wonder Lake, IL 60097
MLS# 12660403Listed by: BAIRD & WARNER - New
 $274,900Active2 beds 2 baths1,537 sq. ft.
5223 Glenbrook Trail, McHenry, IL 60050
MLS# 12660362Listed by: HOMESMART CONNECT LLC - New
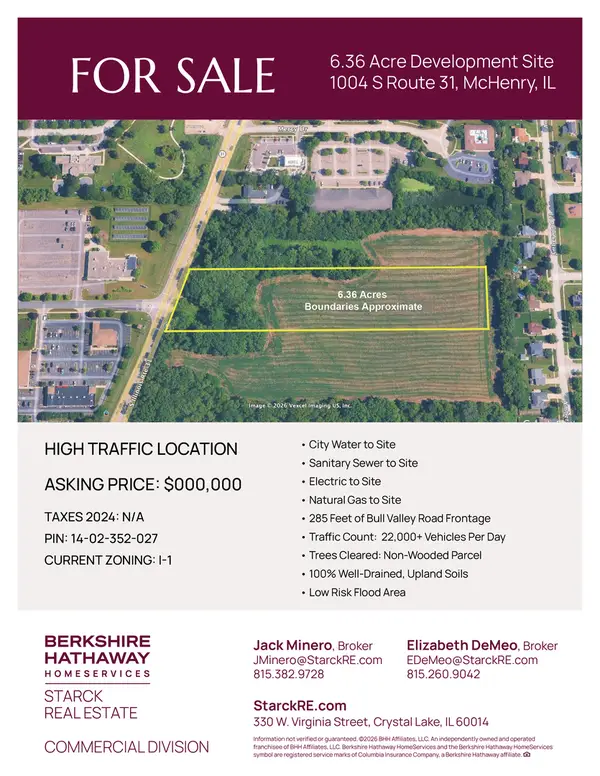 $650,000Active6.36 Acres
1004 S Il Route 31, McHenry, IL 60050
MLS# 12660924Listed by: BERKSHIRE HATHAWAY HOMESERVICES STARCK REAL ESTATE - New
 $475,000Active5 beds 5 baths3,040 sq. ft.
4809 Joyce Lane, McHenry, IL 60050
MLS# 12660339Listed by: CENTURY 21 INTEGRA  $390,000Pending4 beds 3 baths3,690 sq. ft.
5114 W Malibu Court, McHenry, IL 60050
MLS# 12659275Listed by: COLDWELL BANKER REAL ESTATE GROUP $329,000Pending4 beds 2 baths1,622 sq. ft.
4500 Clearview Drive, McHenry, IL 60050
MLS# 12658796Listed by: COMPASS- New
 $269,900Active1.3 Acres
Lot 1 Lakeside Court, Mccullom Lake, IL 60050
MLS# 12624717Listed by: HOMESMART CONNECT LLC - New
 $99,900Active0.18 Acres
609 Monterrey Terrace, McHenry, IL 60050
MLS# 12659318Listed by: ALL WATERFRONT REAL ESTATE PLUS  $475,000Pending3 beds 3 baths2,782 sq. ft.
6802 Ayre Drive, McHenry, IL 60050
MLS# 12649206Listed by: KELLER WILLIAMS NORTH SHORE WEST- New
 $75,000Active1 Acres
Lot 57 Chickaloon Drive, McHenry, IL 60050
MLS# 12657437Listed by: BERKSHIRE HATHAWAY HOMESERVICES STARCK REAL ESTATE  $300,000Pending2 beds 2 baths1,376 sq. ft.
904 Baltimore Street, McHenry, IL 60050
MLS# 12651684Listed by: BERKSHIRE HATHAWAY HOMESERVICES STARCK REAL ESTATE- New
 $344,900Active3 beds 2 baths1,134 sq. ft.
3605 Anne Street, McHenry, IL 60050
MLS# 12651599Listed by: RE/MAX SUBURBAN - New
 $435,000Active2 beds 2 baths2,075 sq. ft.
1004 Monroe Avenue, McHenry, IL 60050
MLS# 12657186Listed by: RE/MAX PLAZA  $498,500Pending5 beds 4 baths4,370 sq. ft.
4608 Joyce Lane, McHenry, IL 60050
MLS# 12629930Listed by: COMPASS- New
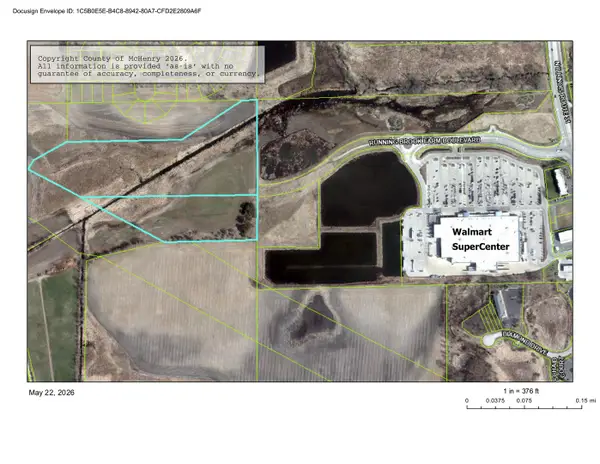 $1,589,950Active-- beds -- baths
0 Running Brook Farm Boulevard, Johnsburg, IL 60050
MLS# 12655787Listed by: CENTURY 21 INTEGRA - New
 $475,000Active4 beds 4 baths2,525 sq. ft.
4003 Boone Creek Circle, McHenry, IL 60050
MLS# 12655998Listed by: CIRCLE ONE REALTY  $409,900Pending2 beds 2 baths2,093 sq. ft.
1001 Madison Avenue, McHenry, IL 60050
MLS# 12648057Listed by: REALTY EXECUTIVES CORNERSTONE $229,900Pending3 beds 2 baths1,345 sq. ft.
1716 Parklane Avenue, McHenry, IL 60050
MLS# 12655646Listed by: GRANDVIEW REALTY, LLC $319,000Pending3 beds 2 baths1,548 sq. ft.
3908 Oak Avenue, McHenry, IL 60050
MLS# 12652606Listed by: RE/MAX ALL PRO - ST CHARLES $175,000Pending2 beds 1 baths1,052 sq. ft.
915 Royal Drive #A3, McHenry, IL 60050
MLS# 12654239Listed by: BERKSHIRE HATHAWAY HOMESERVICES STARCK REAL ESTATE $239,900Pending3 beds 1 baths1,008 sq. ft.
4905 Prairie Avenue, McHenry, IL 60050
MLS# 12653737Listed by: REAL BROKER, LLC- New
 $469,900Active3 beds 2 baths1,343 sq. ft.
707 Kingston Boulevard, McHenry, IL 60050
MLS# 12652385Listed by: LAKES REALTY GROUP - New
 $367,000Active4 beds 2 baths1,510 sq. ft.
2618 Kashmiri Avenue, McHenry, IL 60050
MLS# 12654581Listed by: RE/MAX PLAZA  $667,000Active4 beds 3 baths3,410 sq. ft.
2803 Rose Avenue, McHenry, IL 60050
MLS# 12654454Listed by: BERKSHIRE HATHAWAY HOMESERVICES STARCK REAL ESTATE $660,000Active4 beds 4 baths4,071 sq. ft.
5901 Whiting Drive, McHenry, IL 60050
MLS# 12654545Listed by: KELLER WILLIAMS SUCCESS REALTY $304,990Pending2 beds 2 baths1,375 sq. ft.
6438 Maple Glen Drive, Wonder Lake, IL 60097
MLS# 12652261Listed by: DAYNAE GAUDIO $175,000Pending2 beds 2 baths960 sq. ft.
4404 W Shamrock Lane #3B, McHenry, IL 60050
MLS# 12653160Listed by: BERKSHIRE HATHAWAY HOMESERVICES AMERICAN HERITAGE $624,900Pending2 beds 2 baths1,706 sq. ft.
624 Country Club Drive, McHenry, IL 60050
MLS# 12651537Listed by: DREAM REAL ESTATE, INC. $279,000Active2 beds 2 baths1,177 sq. ft.
5311 Glenbrook Trail, McHenry, IL 60050
MLS# 12646504Listed by: BERKSHIRE HATHAWAY HOMESERVICES STARCK REAL ESTATE $450,000Active4 beds 3 baths2,103 sq. ft.
1311 N Richmond Road, McHenry, IL 60050
MLS# 12648611Listed by: BERKSHIRE HATHAWAY HOMESERVICES STARCK REAL ESTATE $310,000Active2 beds 2 baths1,332 sq. ft.
6313 Maple Glen Drive, Wonder Lake, IL 60097
MLS# 12651762Listed by: KELLER WILLIAMS SUCCESS REALTY $449,990Active4 beds 3 baths2,600 sq. ft.
2277 Cobble Springs Drive, Wonder Lake, IL 60097
MLS# 12651272Listed by: DAYNAE GAUDIO $150,000Active1 beds 1 baths520 sq. ft.
5301 West Lane, Mccullom Lake, IL 60050
MLS# 12643465Listed by: MARATHON REALTY GROUP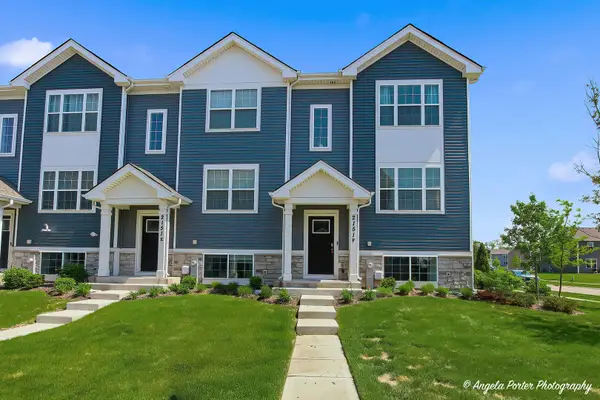 $295,000Active3 beds 3 baths1,758 sq. ft.
2151 Sassafras Way #F, Wonder Lake, IL 60097
MLS# 12650616Listed by: HOMESMART CONNECT LLC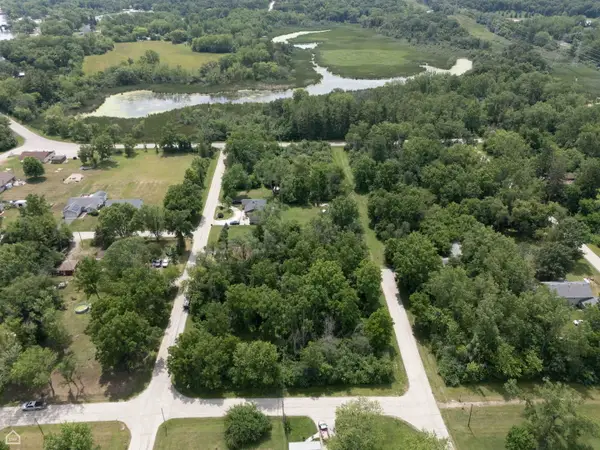 $34,000Active0.5 Acres
000 Carmen Avenue, McHenry, IL 60050
MLS# 12650631Listed by: GLACIER REALTY, INC.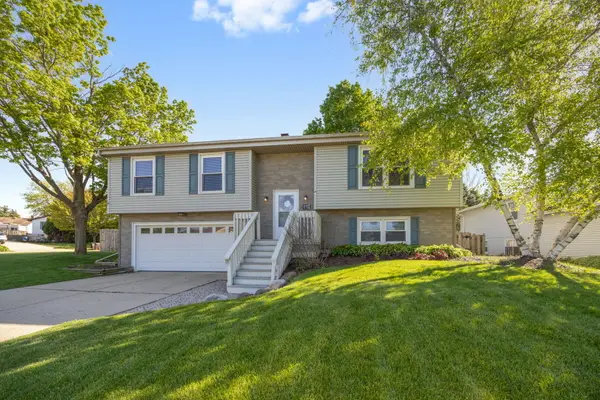 $339,900Pending3 beds 2 baths1,096 sq. ft.
5113 W Dartmoor Drive, McHenry, IL 60050
MLS# 12637871Listed by: BERKSHIRE HATHAWAY HOMESERVICES STARCK REAL ESTATE $250,000Pending2 beds 2 baths1,550 sq. ft.
5303 Cobblers Crossing, McHenry, IL 60050
MLS# 12639030Listed by: KELLER WILLIAMS SUCCESS REALTY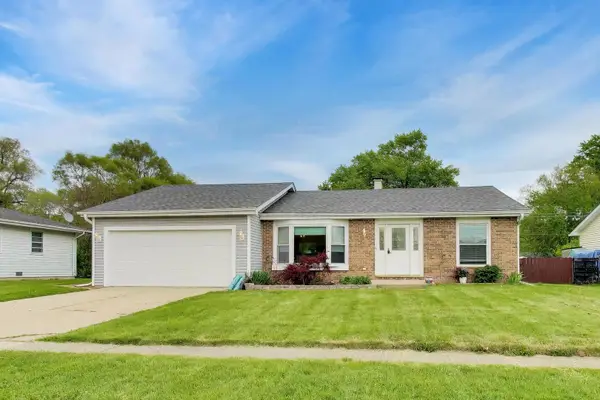 $330,000Pending3 beds 2 baths1,452 sq. ft.
1410 N Scully Drive, McHenry, IL 60050
MLS# 12640416Listed by: BERKSHIRE HATHAWAY HOMESERVICES STARCK REAL ESTATE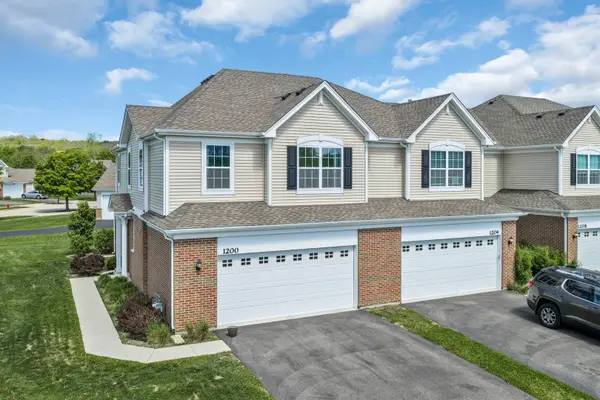 $320,000Pending3 beds 3 baths1,717 sq. ft.
1200 Draper Road, McHenry, IL 60050
MLS# 12648704Listed by: COLDWELL BANKER REALTY $324,990Active2 beds 2 baths1,375 sq. ft.
6367 Maple Glen Drive, Wonder Lake, IL 60097
MLS# 12648609Listed by: DAYNAE GAUDIO $334,990Active2 beds 2 baths1,375 sq. ft.
6447 Maple Glen Drive, Wonder Lake, IL 60097
MLS# 12648623Listed by: DAYNAE GAUDIO $339,990Active2 beds 2 baths1,375 sq. ft.
6445 Maple Glen Drive, Wonder Lake, IL 60097
MLS# 12648635Listed by: DAYNAE GAUDIO $389,990Active2 beds 2 baths1,744 sq. ft.
6276 Maple Glen Drive, Wonder Lake, IL 60097
MLS# 12648639Listed by: DAYNAE GAUDIO $397,990Active3 beds 2 baths1,956 sq. ft.
6274 Maple Glen Drive, Wonder Lake, IL 60097
MLS# 12648646Listed by: DAYNAE GAUDIO $539,000Active4 beds 3 baths3,052 sq. ft.
6814 Homestead Drive, McHenry, IL 60050
MLS# 12642287Listed by: EXP REALTY $339,900Pending3 beds 2 baths1,600 sq. ft.
5832 Landcaster Circle, McHenry, IL 60050
MLS# 12646116Listed by: KELLER WILLIAMS SUCCESS REALTY $289,990Pending2 beds 2 baths1,332 sq. ft.
6379 Juniper Drive, Wonder Lake, IL 60097
MLS# 12647466Listed by: DAYNAE GAUDIO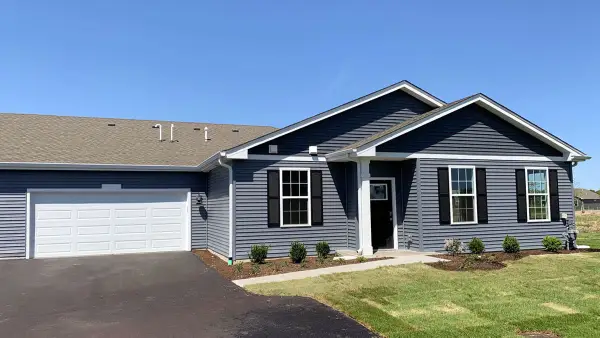 $294,990Active2 beds 2 baths1,332 sq. ft.
6441 Maple Glen Drive, Wonder Lake, IL 60097
MLS# 12647471Listed by: DAYNAE GAUDIO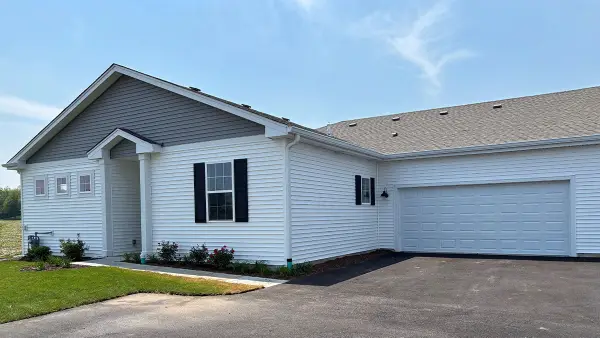 $299,990Pending2 beds 2 baths1,375 sq. ft.
6431 Maple Glen Drive, Wonder Lake, IL 60097
MLS# 12647474Listed by: DAYNAE GAUDIO $305,990Active2 beds 2 baths1,375 sq. ft.
6443 Maple Glen Drive, Wonder Lake, IL 60097
MLS# 12647482Listed by: DAYNAE GAUDIO $319,990Active2 beds 2 baths1,375 sq. ft.
6433 Maple Glen Drive, Wonder Lake, IL 60097
MLS# 12647487Listed by: DAYNAE GAUDIO $321,990Active2 beds 2 baths1,375 sq. ft.
6507 Juniper Drive, Wonder Lake, IL 60097
MLS# 12647494Listed by: DAYNAE GAUDIO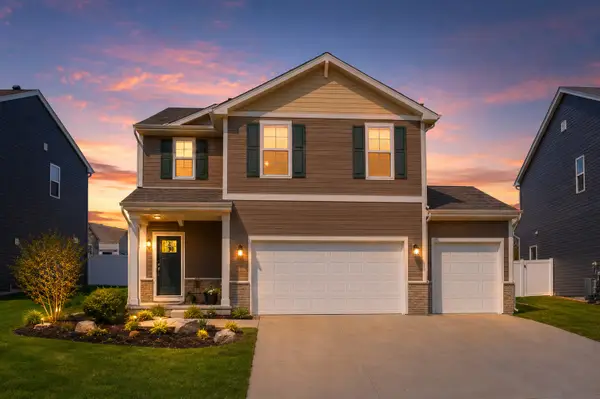 $389,900Active4 beds 3 baths1,847 sq. ft.
6816 Cobble Springs Lane, Wonder Lake, IL 60097
MLS# 12647199Listed by: KELLER WILLIAMS NORTH SHORE WEST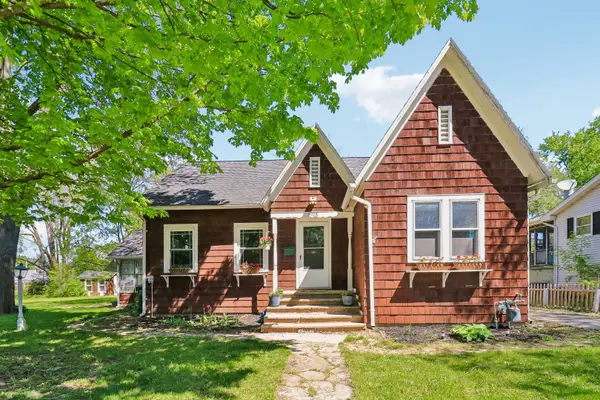 $300,000Active2 beds 2 baths1,076 sq. ft.
3908 W Kane Avenue, McHenry, IL 60050
MLS# 12617433Listed by: BETTER HOMES AND GARDEN REAL ESTATE STAR HOMES $449,900Active3 beds 2 baths1,612 sq. ft.
3415 Venice Avenue, McHenry, IL 60050
MLS# 12639662Listed by: BERKSHIRE HATHAWAY HOMESERVICES STARCK REAL ESTATE $279,900Pending2 beds 3 baths1,640 sq. ft.
1739 Court Street #1739, McHenry, IL 60050
MLS# 12646538Listed by: RE/MAX PLAZA $309,900Active3 beds 2 baths1,248 sq. ft.
1412 Beach Road, McHenry, IL 60050
MLS# 12646386Listed by: REDFIN CORPORATION $600,000Active16.3 Acres
Lot 2-3-4 N Valley Hill Road, Bull Valley, IL 60050
MLS# 12643500Listed by: KELLER WILLIAMS PREMIERE PROPERTIES $283,000Active3 beds 3 baths1,758 sq. ft.
2241 Sassafras Way #E, Wonder Lake, IL 60097
MLS# 12643409Listed by: SOUTHWESTERN REAL ESTATE, INC. $318,900Pending4 beds 2 baths1,980 sq. ft.
5007 Prairie Avenue, McHenry, IL 60050
MLS# 12643436Listed by: RE/MAX PLAZA $200,000Pending2 beds 2 baths1,112 sq. ft.
603 Waters Edge Drive #D, McHenry, IL 60050
MLS# 12593051Listed by: KELLER WILLIAMS SUCCESS REALTY $284,900Pending3 beds 1 baths1,268 sq. ft.
1711 N Orleans Street, McHenry, IL 60050
MLS# 12637274Listed by: KELLER WILLIAMS SUCCESS REALTY $549,900Active4 beds 3 baths3,410 sq. ft.
6508 Waterford Drive, McHenry, IL 60050
MLS# 12635123Listed by: SHALEH HOMES INC. $307,000Active2 beds 2 baths1,375 sq. ft.
6445 Juniper Drive, Wonder Lake, IL 60097
MLS# 12640866Listed by: JASON MITCHELL REAL ESTATE IL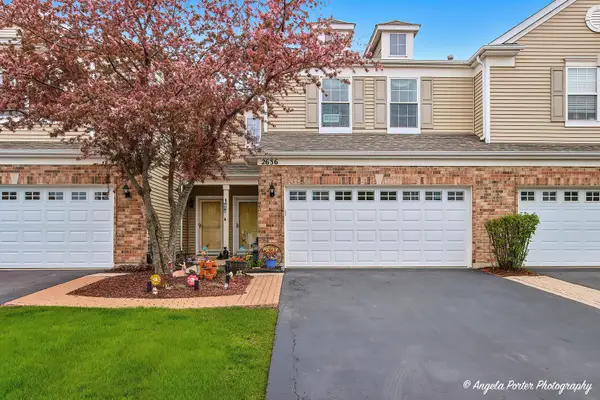 $275,000Pending3 beds 3 baths1,500 sq. ft.
2636 Evergreen Circle, McHenry, IL 60050
MLS# 12639080Listed by: COMPASS $495,000Pending3 beds 2 baths1,586 sq. ft.
3006 Miller Drive, McHenry, IL 60050
MLS# 12637380Listed by: BERKSHIRE HATHAWAY HOMESERVICES STARCK REAL ESTATE $24,500Active0.74 Acres
1023 Hooks Lane, Fox Lake, IL 60050
MLS# 12636862Listed by: REALTY WORLD TIFFANY R.E. $300,000Pending3 beds 2 baths1,846 sq. ft.
5217 N Pleasant View Drive, McHenry, IL 60050
MLS# 12629827Listed by: COMPASS $319,900Active5 beds 2 baths2,802 sq. ft.
1631 Park Street, McHenry, IL 60050
MLS# 12621330Listed by: BAIRD & WARNER $319,000Active2 beds 2 baths1,375 sq. ft.
6328 Maple Glen Drive, Wonder Lake, IL 60097
MLS# 12628062Listed by: BERKSHIRE HATHAWAY HOMESERVICES STARCK REAL ESTATE $285,000Active3 beds 3 baths1,758 sq. ft.
2151 Sassafras Way #B, Wonder Lake, IL 60097
MLS# 12634971Listed by: REALTY OF AMERICA, LLC $370,000Pending3 beds 3 baths1,738 sq. ft.
514 Brookwood Trail, McHenry, IL 60050
MLS# 12635319Listed by: BERKSHIRE HATHAWAY HOMESERVICES STARCK REAL ESTATE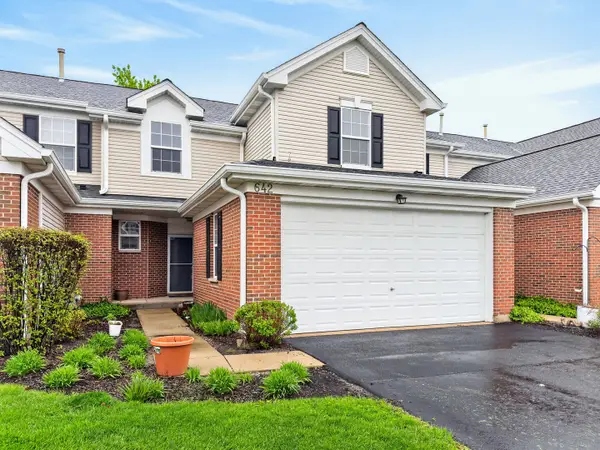 $289,900Pending3 beds 3 baths1,871 sq. ft.
642 Legend Lane #642, McHenry, IL 60050
MLS# 12630614Listed by: REALTY EXECUTIVES CORNERSTONE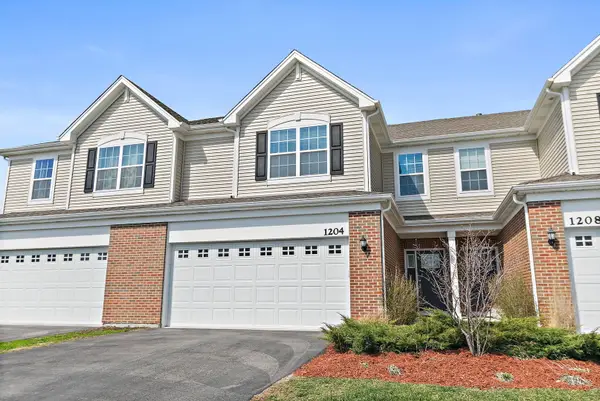 $285,000Pending3 beds 3 baths1,840 sq. ft.
1204 Draper Road, McHenry, IL 60050
MLS# 12634423Listed by: BERKSHIRE HATHAWAY HOMESERVICES STARCK REAL ESTATE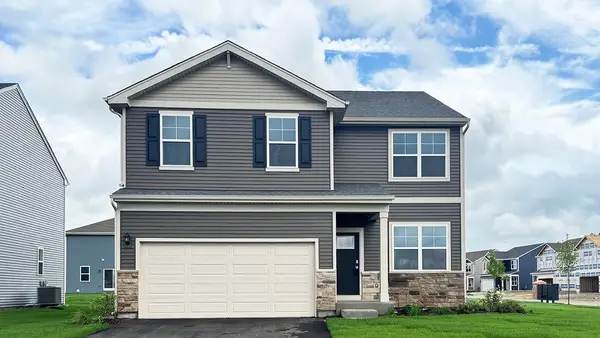 $419,990Active4 beds 3 baths2,051 sq. ft.
2269 Cobble Springs Drive, Wonder Lake, IL 60097
MLS# 12631578Listed by: DAYNAE GAUDIO $419,990Active3 beds 3 baths2,155 sq. ft.
2013 Winterberry Trail, Wonder Lake, IL 60097
MLS# 12631593Listed by: DAYNAE GAUDIO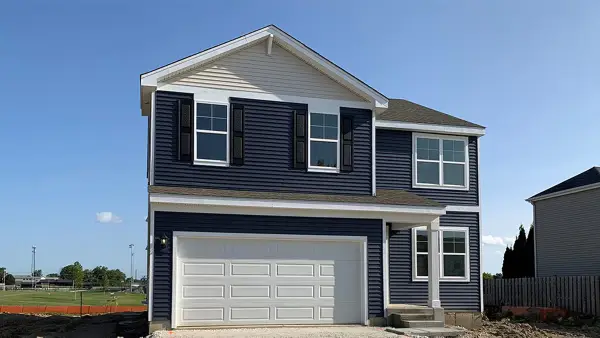 $424,990Active4 beds 3 baths2,051 sq. ft.
2015 Winterberry Trail, Wonder Lake, IL 60097
MLS# 12631605Listed by: DAYNAE GAUDIO $394,990Active3 beds 2 baths1,956 sq. ft.
6267 Maple Glen Drive, Wonder Lake, IL 60097
MLS# 12631819Listed by: DAYNAE GAUDIO $459,900Pending2 beds 2 baths1,904 sq. ft.
706 Silver Glen Road, McHenry, IL 60050
MLS# 12600674Listed by: EXP REALTY $325,000Pending3 beds 3 baths1,552 sq. ft.
1011 Ridgewood Avenue, McHenry, IL 60050
MLS# 12629579Listed by: COMPASS $189,900Pending2 beds 2 baths1,010 sq. ft.
4303 W Shamrock Lane #1C, McHenry, IL 60050
MLS# 12625901Listed by: BERKSHIRE HATHAWAY HOMESERVICES STARCK REAL ESTATE $326,900Pending3 beds 2 baths1,488 sq. ft.
213 Windridge Drive, McHenry, IL 60050
MLS# 12633008Listed by: DREAM REAL ESTATE, INC. $174,900Active2 beds 1 baths895 sq. ft.
4909 Fountain Lane, Mccullom Lake, IL 60050
MLS# 12630801Listed by: EXP REALTY $490,000Pending3 beds 2 baths
535 Kingston Boulevard, McHenry, IL 60050
MLS# 12626233Listed by: CENTURY 21 INTEGRA $300,000Pending3 beds 2 baths1,400 sq. ft.
3206 W Hunter Path, McHenry, IL 60050
MLS# 12631501Listed by: KELLER WILLIAMS NORTH SHORE WEST $319,990Active2 beds 2 baths1,375 sq. ft.
6495 Juniper Drive, Wonder Lake, IL 60097
MLS# 12631894Listed by: DAYNAE GAUDIO $344,990Active3 beds 2 baths1,498 sq. ft.
6269 Maple Glen Drive, Wonder Lake, IL 60097
MLS# 12631061Listed by: DAYNAE GAUDIO $449,990Active2 beds 2 baths1,863 sq. ft.
6304 Redwood Court, Wonder Lake, IL 60097
MLS# 12630418Listed by: DAYNAE GAUDIO $325,000Active3 beds 2 baths1,884 sq. ft.
5214 Parkview Drive, Mccullom Lake, IL 60050
MLS# 12630368Listed by: HOMESMART CONNECT LLC $549,900Active4 beds 3 baths2,907 sq. ft.
6637 Galway Drive, McHenry, IL 60050
MLS# 12626155Listed by: TNT REALTY, INC. $299,000Active2.66 Acres
1716-1728-1740 Oak Drive, McHenry, IL 60050
MLS# 12628642Listed by: RUNWAY REALTY INC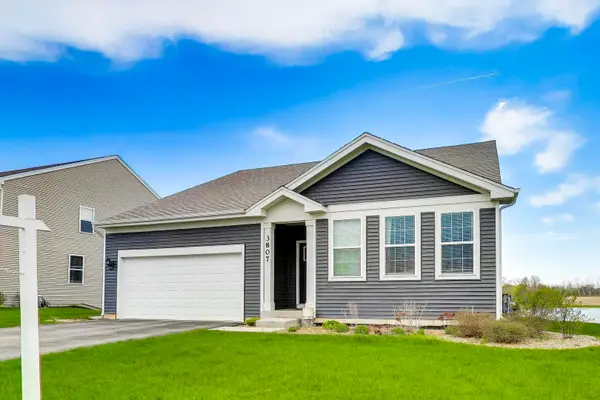 $450,000Pending3 beds 2 baths3,646 sq. ft.
3807 Flynn Street, McHenry, IL 60050
MLS# 12604198Listed by: BERKSHIRE HATHAWAY HOMESERVICES STARCK REAL ESTATE $525,000Pending4 beds 4 baths3,837 sq. ft.
613 Silver Glen Road, McHenry, IL 60050
MLS# 12614327Listed by: COMPASS $325,000Pending3 beds 2 baths1,423 sq. ft.
3804 Grove Avenue, McHenry, IL 60050
MLS# 12626878Listed by: ZERILLO REALTY INC. $405,000Pending4 beds 3 baths2,415 sq. ft.
4816 W Courtland Trail, McHenry, IL 60050
MLS# 12627073Listed by: RE/MAX PLAZA $685,000Pending5 beds 4 baths3,403 sq. ft.
6608 Erin Road, McHenry, IL 60050
MLS# 12622977Listed by: BERKSHIRE HATHAWAY HOMESERVICES STARCK REAL ESTATE $750,000Active4 beds 4 baths3,776 sq. ft.
305 N Dale Avenue, McHenry, IL 60050
MLS# 12537529Listed by: KELLER WILLIAMS SUCCESS REALTY $235,000Pending2 beds 1 baths1,124 sq. ft.
4113 W Crystal Lake Road, McHenry, IL 60050
MLS# 12626115Listed by: SELL SMART REALTY GROUP INC. $450,000Pending3 beds 3 baths2,403 sq. ft.
3730 Doherty Lane, McHenry, IL 60050
MLS# 12624303Listed by: KELLER WILLIAMS PREMIERE PROPERTIES $614,900Pending4 beds 3 baths3,558 sq. ft.
1606 Tecumseh Drive, McHenry, IL 60050
MLS# 12624976Listed by: KELLER WILLIAMS SUCCESS REALTY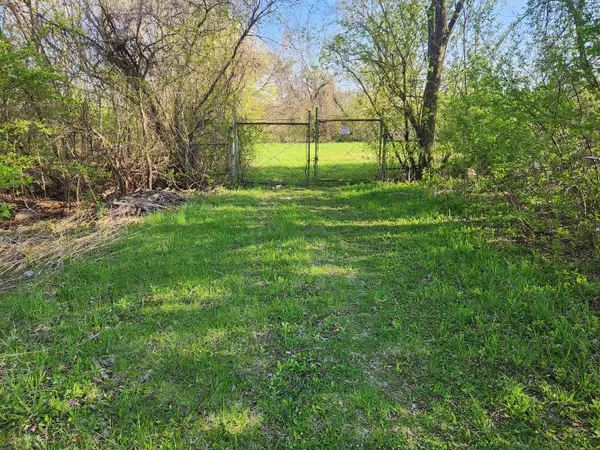 $69,900Active0 Acres
Lot 1 West Elm Street, McHenry, IL 60050
MLS# 12624798Listed by: NORTHWEST SUBURBAN REAL ESTATE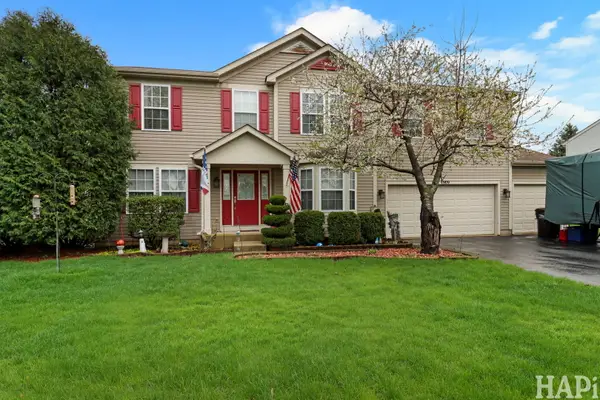 $439,500Pending4 beds 3 baths3,199 sq. ft.
1909 Hemlock Drive, McHenry, IL 60050
MLS# 12623224Listed by: RESULTS REALTY USA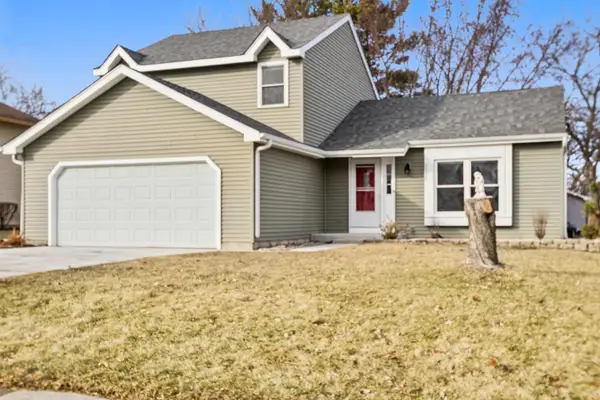 $337,000Pending3 beds 2 baths1,518 sq. ft.
5512 Abbey Drive, McHenry, IL 60050
MLS# 12623250Listed by: BEYCOME BROKERAGE REALTY LLC $349,000Pending4 beds 2 baths2,181 sq. ft.
2704 Myang Avenue, McHenry, IL 60050
MLS# 12590496Listed by: RE/MAX PLAZA $434,900Active4 beds 2 baths1,771 sq. ft.
6813 Cobble Springs Lane, Wonder Lake, IL 60097
MLS# 12620626Listed by: COMPASS $449,900Active4 beds 3 baths2,211 sq. ft.
6517 Donegal Lane, McHenry, IL 60050
MLS# 12622555Listed by: @PROPERTIES CHRISTIE'S INTERNATIONAL REAL ESTATE $359,900Pending3 beds 2 baths1,252 sq. ft.
3717 Ellen Road, McHenry, IL 60050
MLS# 12598406Listed by: NORTHWEST SUBURBAN REAL ESTATE $300,000Pending3 beds 1 baths1,137 sq. ft.
313 N Huntington Drive, McHenry, IL 60050
MLS# 12619208Listed by: LEGACY PROPERTIES, A SARAH LEONARD COMPANY, LLC $369,990Active2 beds 2 baths1,863 sq. ft.
6273 Maple Glen Drive, Wonder Lake, IL 60097
MLS# 12621371Listed by: DAYNAE GAUDIO $79,000Active0.22 Acres
5207 N Lake Street, McHenry, IL 60050
MLS# 12618806Listed by: ALL WATERFRONT REAL ESTATE PLUS $490,000Active6 beds 3 baths
3807 Main Street, McHenry, IL 60050
MLS# 12619514Listed by: RE/MAX CITY $45,000Active0.98 Acres
Lot 152 Whiting Drive, McHenry, IL 60050
MLS# 12618343Listed by: RE/MAX CITY $306,900Pending3 beds 2 baths1,634 sq. ft.
5524 W Shore Drive, McHenry, IL 60050
MLS# 12614768Listed by: NORTHWEST SUBURBAN REAL ESTATE $288,000Active2 beds 2 baths1,332 sq. ft.
6322 Maple Glen Drive, Wonder Lake, IL 60097
MLS# 12468852Listed by: BERKSHIRE HATHAWAY HOMESERVICES STARCK REAL ESTATE $399,900Pending4 beds 3 baths2,560 sq. ft.
5209 Springdale Lane, McHenry, IL 60050
MLS# 12616761Listed by: RESULTS REALTY USA $299,990Pending2 beds 2 baths1,375 sq. ft.
6365 Maple Glen Drive, Wonder Lake, IL 60097
MLS# 12616374Listed by: DAYNAE GAUDIO $433,990Active2 beds 2 baths1,863 sq. ft.
6284 Redwood Trail, Wonder Lake, IL 60097
MLS# 12615509Listed by: DAYNAE GAUDIO $285,000Pending4 beds 2 baths2,279 sq. ft.
5115 Parkview Drive, Mccullom Lake, IL 60050
MLS# 12597545Listed by: COMPASS $695,000Pending6 beds 3 baths4,110 sq. ft.
4321 Lakewood Road, McHenry, IL 60050
MLS# 12611872Listed by: FLATLAND HOMES, LTD $385,000Active3 beds 2 baths1,592 sq. ft.
205 N Dale Avenue, McHenry, IL 60050
MLS# 12605948Listed by: RE/MAX AT HOME $304,990Pending2 beds 2 baths1,375 sq. ft.
6438 Maple Glen Drive, Wonder Lake, IL 60097
MLS# 12608797Listed by: DAYNAE GAUDIO $325,000Pending3 beds 2 baths1,423 sq. ft.
3804 Grove Avenue, McHenry, IL 60050
MLS# 12607963Listed by: ZERILLO REALTY INC. $429,000Pending4 beds 3 baths2,356 sq. ft.
6801 Willow Drive, Wonder Lake, IL 60097
MLS# 12607339Listed by: FAMILY REALTY, INC $310,000Active2 beds 3 baths1,693 sq. ft.
5802 Fieldstone Trail #5802, McHenry, IL 60050
MLS# 12606312Listed by: RE/MAX PLAZA $319,900Pending3 beds 2 baths932 sq. ft.
3708 Pebble Creek, McHenry, IL 60050
MLS# 12596701Listed by: KELLER WILLIAMS PREMIERE PROPERTIES $480,000Active4 beds 3 baths3,136 sq. ft.
2930 Plumrose Lane, McHenry, IL 60050
MLS# 12599675Listed by: BERKSHIRE HATHAWAY HOMESERVICES STARCK REAL ESTATE $359,900Active3 beds 1 baths1,177 sq. ft.
5205 N Lake Street, McHenry, IL 60050
MLS# 12599865Listed by: 103 REALTY $27,000Active0 Acres
LOT 8 W Plum Street S, McHenry, IL 60050
MLS# 12598217Listed by: KONNERTH REALTY GROUP $300,000Pending3 beds 2 baths1,172 sq. ft.
4704 Hartland Trail, McHenry, IL 60050
MLS# 12596580Listed by: RE/MAX PLAZA $185,000Active5.5 Acres
0 Lot#6 Broadway Street, McHenry, IL 60050
MLS# 12591436Listed by: HOMESMART CONNECT LLC $14,500Active0.11 Acres
n/a Lily Lake Road Road, McHenry, IL 60050
MLS# 12585667Listed by: KONNERTH REALTY GROUP $419,000Active3 beds 2 baths1,830 sq. ft.
515 Country Club Drive, McHenry, IL 60050
MLS# 12584858Listed by: CENTURY 21 INTEGRA $331,900Pending3 beds 3 baths1,850 sq. ft.
110 N Ashland Drive, McHenry, IL 60050
MLS# 12577317Listed by: BROKEROCITY INC $346,990Pending2 beds 2 baths1,660 sq. ft.
6271 Maple Glen Trail, Wonder Lake, IL 60097
MLS# 12582386Listed by: DAYNAE GAUDIO $139,900Active1 beds 1 baths625 sq. ft.
4301 W Shamrock Lane #2D, McHenry, IL 60050
MLS# 12580569Listed by: PLUS REAL ESTATE SERVICES, INC. $96,000Active0.5 Acres
Address Withheld By Seller, McHenry, IL 60050
MLS# 12580211Listed by: BAIRD & WARNER $385,000Pending2 beds 2 baths1,865 sq. ft.
6412 Stony Brook Lane, Wonder Lake, IL 60097
MLS# 12580788Listed by: JAMESON SOTHEBY'S INTERNATIONAL REALTY $465,000Active4 beds 2 baths1,941 sq. ft.
6503 Tustamena Trail, McHenry, IL 60050
MLS# 12577732Listed by: DREAM REAL ESTATE, INC. $344,990Pending3 beds 2 baths1,498 sq. ft.
6278 Maple Glen Drive, Wonder Lake, IL 60097
MLS# 12579109Listed by: DAYNAE GAUDIO $329,990Pending3 beds 2 baths1,498 sq. ft.
6275 Maple Glen Drive, Wonder Lake, IL 60097
MLS# 12578567Listed by: DAYNAE GAUDIO $366,990Pending2 beds 2 baths1,863 sq. ft.
2270 Redwood Trail, Wonder Lake, IL 60097
MLS# 12575971Listed by: DAYNAE GAUDIO $450,000Pending4 beds 3 baths2,818 sq. ft.
6710 Killala Drive, McHenry, IL 60050
MLS# 12561094Listed by: KELLER WILLIAMS NORTH SHORE WEST $272,900Pending2 beds 2 baths1,332 sq. ft.
6302 Maple Glen Drive #3081, Wonder Lake, IL 60097
MLS# 12580334Listed by: REAL BROKER, LLC $262,990Pending2 beds 3 baths1,579 sq. ft.
6500 Linden Trail #C, Wonder Lake, IL 60097
MLS# 12583005Listed by: DAYNAE GAUDIO $262,990Pending2 beds 3 baths1,579 sq. ft.
6500 Linden Trail #D, Wonder Lake, IL 60097
MLS# 12583011Listed by: DAYNAE GAUDIO $299,990Pending2 beds 3 baths1,758 sq. ft.
6500 Linden Trail #B, Wonder Lake, IL 60097
MLS# 12538146Listed by: DAYNAE GAUDIO $318,990Pending3 beds 3 baths1,758 sq. ft.
6500 Linden Trail #A, Wonder Lake, IL 60097
MLS# 12583697Listed by: DAYNAE GAUDIO $314,990Pending3 beds 3 baths1,758 sq. ft.
6500 Linden Trail #E, Wonder Lake, IL 60097
MLS# 12538111Listed by: DAYNAE GAUDIO $299,990Pending3 beds 3 baths1,758 sq. ft.
6510 Linden Trail #D, Wonder Lake, IL 60097
MLS# 12583015Listed by: DAYNAE GAUDIO $314,990Pending3 beds 3 baths1,758 sq. ft.
6510 Linden Trail #E, Wonder Lake, IL 60097
MLS# 12583176Listed by: DAYNAE GAUDIO $299,000Active0.66 Acres
4104 W Elm Street, McHenry, IL 60050
MLS# 12520476Listed by: COLDWELL BANKER COMMERCIAL REAL ESTATE GROUP $2,195,000Active-- beds -- baths
7318 W Il W Route 120, McHenry, IL 60050
MLS# 12515923Listed by: BERKSHIRE HATHAWAY HOMESERVICES STARCK REAL ESTATE $2,200,000Active-- beds -- baths
0 Route 31 Highway, McHenry, IL 60051
MLS# 12512976Listed by: COMPASS $350,000Active4.46 Acres
0000 Johnsburg Road, Johnsburg, IL 60050
MLS# 12507023Listed by: HOMESMART CONNECT LLC $434,990Pending2 beds 2 baths1,863 sq. ft.
6288 Redwood Trail, Wonder Lake, IL 60097
MLS# 12564149Listed by: DAYNAE GAUDIO $417,990Pending2 beds 2 baths1,744 sq. ft.
6286 Redwood Trail, Wonder Lake, IL 60097
MLS# 12564141Listed by: DAYNAE GAUDIO $150,000Pending3 beds 1 baths1,483 sq. ft.
5504 Louella Avenue, McHenry, IL 60050
MLS# 12480303Listed by: HOMESMART CONNECT LLC $25,900Active1.03 Acres
7319 Forest Oak Drive, McHenry, IL 60050
MLS# 12476928Listed by: COMPASS $152,460Active-- beds -- baths
6447 W Il Rt 120 Parkway, McHenry, IL 60050
MLS# 12437035Listed by: HOMETOWN REALTY, LTD. $239,900Pending3 beds 1 baths1,008 sq. ft.
4420 Clearview Drive, McHenry, IL 60050
MLS# 12404591Listed by: CENTURY 21 INTEGRA $895,000Active2 Acres
926 Front Street, McHenry, IL 60050
MLS# 12392622Listed by: BERKSHIRE HATHAWAY HOMESERVICES STARCK REAL ESTATE $24,900Active0.87 Acres
7408 Forest Oak Drive, McHenry, IL 60050
MLS# 12385930Listed by: CENTURY 21 INTEGRA $24,900Active1 Acres
7407 Forest Oak Drive, McHenry, IL 60050
MLS# 12388145Listed by: CENTURY 21 INTEGRA $159,900Active0.72 Acres
5101 W Elm Street, McHenry, IL 60050
MLS# 12557109Listed by: PREMIER COMMERCIAL REALTY $270,000Active4.25 Acres
Lot 48-53 Ridgeview Drive, McHenry, IL 60050
MLS# 12384894Listed by: XHOMES REALTY INC $18,900Active0.5 Acres
Lot 12, Block 6 Buchanan Road, Johnsburg, IL 60050
MLS# 12364522Listed by: DREAM REAL ESTATE, INC. $40,000Active1 Acres
6114 Whiteoak Drive, McHenry, IL 60050
MLS# 12345980Listed by: HOMESMART CONNECT LLC $10,500Active0.19 Acres
Lot 5 Tower Drive, McHenry, IL 60050
MLS# 12325872Listed by: BERKSHIRE HATHAWAY HOMESERVICES STARCK REAL ESTATE $12,500Active0 Acres
803 East Boulevard, McHenry, IL 60050
MLS# 12278846Listed by: COMPASS $200,000Active0.99 Acres
7212 Forest Oak Drive, McHenry, IL 60050
MLS# 12279776Listed by: BERKSHIRE HATHAWAY HOMESERVICES STARCK REAL ESTATE $750,000Pending-- beds -- baths
0 Broadway Street, McHenry, IL 60050
MLS# 12214891Listed by: WHITETAIL PROPERTIES REAL ESTATE, LLC $2,300,000Pending20 Acres
1100 S Route 31 Highway, McHenry, IL 60050
MLS# 12115884Listed by: BERKSHIRE HATHAWAY HOMESERVICES STARCK REAL ESTATE $450,000Active4.02 Acres
1510 S Route 31 Road S, McHenry, IL 60050
MLS# 12115987Listed by: BERKSHIRE HATHAWAY HOMESERVICES STARCK REAL ESTATE $1,250,000Active5.83 Acres
702 S Il Route 31, McHenry, IL 60050
MLS# 12021961Listed by: VEZA CONSULTING $10,000Active0 Acres
Lot 19-20-21 Valley Road, McHenry, IL 60051
MLS# 11972354Listed by: DREAM REAL ESTATE, INC. $38,700Active0.84 Acres
7111 Forest Oak Drive, McHenry, IL 60050
MLS# 12144172Listed by: CENTURY 21 INTEGRA $475,000Pending1.41 Acres
3701 W Elm Street, McHenry, IL 60050
MLS# 11132060Listed by: BERKSHIRE HATHAWAY HOMESERVICES STARCK REAL ESTATE $45,000Active0.95 Acres
Lot 7 Dowell Road, McHenry, IL 60050
MLS# 08710740Listed by: RYAN AND COMPANY REALTORS, INC $1,100,000Active10.1 Acres
5198 Bull Valley Road, McHenry, IL 60050
MLS# 10613595Listed by: BERKSHIRE HATHAWAY HOMESERVICES STARCK REAL ESTATE $750,000Active2.13 Acres
914 Front Street, McHenry, IL 60050
MLS# 11471150Listed by: BERKSHIRE HATHAWAY HOMESERVICES STARCK REAL ESTATE
Local realty services provided by:CENTURY 21 All Pro Real Estate
Copyright 2026 Midwest Real Estate Data LLC. All rights reserved. The data relating to real estate for sale on this web site comes in part from the Broker Reciprocity Program of the Midwest Real Estate Data LLC. Listing information is deemed reliable but not guaranteed. MLSNI Member Broker: Lisa McKinney
Popular searches near 60050
Popular neighborhoods near 60050
- Big Sky, Lake In The Hills homes for sale
- Brophy Farm, Fox Lake homes for sale
- Coventry, Crystal Lake homes for sale
- Four Colonies, Crystal Lake homes for sale
- Fox River Valley Gardens, Port Barrington homes for sale
- Greenfields, Cary homes for sale
- High Hill Farms, Algonquin homes for sale
- Ingleside, Ingleside homes for sale
- Lake Barrington Shores, Lake Barrington homes for sale
- Lake in the Hills Estates, Lake In The Hills homes for sale
- Lakeland Park, McHenry homes for sale
- Lakewood Grove, Round Lake homes for sale
- Madrona Village, Round Lake homes for sale
- Meadowbrook, Lake In The Hills homes for sale
- Shamrock Farms, McHenry homes for sale
- Spring Lake Farms, Lake In The Hills homes for sale
- Sunrise Ridge, Wonder Lake homes for sale
- Turnberry, Lakewood homes for sale
- Valley Lakes, Round Lake homes for sale
- Winding Creek, McHenry homes for sale
Counties near McHenry, 60050
- Boone County homes for sale
- Cook County homes for sale
- DeKalb County homes for sale
- DuPage County homes for sale
- Jefferson County homes for sale
- Kane County homes for sale
- Kendall County homes for sale
- Kenosha County homes for sale
- Lake County homes for sale
- Lee County homes for sale
- McHenry County homes for sale
- Milwaukee County homes for sale
- Ogle County homes for sale
- Racine County homes for sale
- Rock County homes for sale
- Stephenson County homes for sale
- Walworth County homes for sale
- Waukesha County homes for sale
- Will County homes for sale
- Winnebago County homes for sale
Protect your home and budget from life's surprises with an Assurant Home Warranty, backed by a partner that supports you through every step of homeownership. Explore Plans.
©2026 Century 21 Real Estate LLC. All rights reserved. CENTURY 21®, the CENTURY 21 Logo and C21® are service marks owned by Century 21 Real Estate LLC. Century 21 Real Estate LLC fully supports the principles of the Fair Housing Act and the Equal Opportunity Act. Each office is independently owned and operated. Listing information is deemed reliable but not guaranteed accurate.