- Belvidere homes for sale
- Bonus homes for sale
- Boone homes for sale
- Coral Township homes for sale
- Dorr homes for sale
- Dunham homes for sale
- Garden Prairie homes for sale
- Genoa homes for sale
- Genoa township homes for sale
- Hampshire homes for sale
- Hampshire Township homes for sale
- Hartland Township homes for sale
- Kingston homes for sale
- Kingston Township homes for sale
- Marengo homes for sale
- Marengo Township homes for sale
- Riley Township homes for sale
- Seneca homes for sale
- Union homes for sale
- Woodstock homes for sale
60152, IL - homes for sale
93 of 93 results displayed
- New
 $295,000Active4.7 Acres
4.72 AC W Grant Highway, Marengo, IL 60152
MLS# 12635930Listed by: REALTY WORLD TIFFANY R.E.
- New
 $254,000Active4 beds 2 baths1,900 sq. ft.
436 W Washington Street, Marengo, IL 60152
MLS# 12634027Listed by: CENTURY 21 NEW HERITAGE  $239,900Pending3 beds 1 baths1,230 sq. ft.
821 Diane Court, Marengo, IL 60152
MLS# 12625249Listed by: BAIRD & WARNER REAL ESTATE - ALGONQUIN $390,400Pending4 beds 2 baths1,740 sq. ft.
813 Whitetail Drive, Marengo, IL 60152
MLS# 12626694Listed by: SUBURBAN LIFE REALTY, LTD $229,000Pending2 beds 2 baths1,150 sq. ft.
500 1/2 Johnson Street, Marengo, IL 60152
MLS# 12621453Listed by: RE/MAX CONNECTIONS II $475,000Pending3 beds 3 baths2,046 sq. ft.
17214 Fieldstone Drive, Marengo, IL 60152
MLS# 12622027Listed by: CENTURY 21 NEW HERITAGE $850,000Pending4 beds 4 baths2,600 sq. ft.
1513 Deerpass Road, Marengo, IL 60152
MLS# 12620548Listed by: RE/MAX CONNECTIONS II $775,000Active4 beds 5 baths4,000 sq. ft.
2108 Pringle Drive, Marengo, IL 60152
MLS# 12624573Listed by: @PROPERTIES CHRISTIE'S INTERNATIONAL REAL ESTATE $219,000Pending3 beds 3 baths1,560 sq. ft.
740 Village Circle, Marengo, IL 60152
MLS# 12604712Listed by: KELLER WILLIAMS REALTY SIGNATURE $400,000Pending4 beds 3 baths2,410 sq. ft.
640 Cloverleaf Drive, Marengo, IL 60152
MLS# 12618319Listed by: COMPASS $340,000Active4 beds 2 baths1,400 sq. ft.
214 S Prospect Street, Marengo, IL 60152
MLS# 12618693Listed by: REALTY OF AMERICA, LLC $65,500Active0.77 Acres
Vacant Helen Street, Garden Prairie, IL 61038
MLS# 12617573Listed by: USREALTY.COM, LLP $380,000Pending3 beds 2 baths2,825 sq. ft.
895 Stanford Drive, Marengo, IL 60152
MLS# 12614376Listed by: CENTURY 21 NEW HERITAGE $290,000Pending3 beds 2 baths1,500 sq. ft.
616 2nd Avenue, Marengo, IL 60152
MLS# 12608164Listed by: RE/MAX CONNECTIONS II $525,000Pending4 beds 4 baths2,779 sq. ft.
10514 Ridge Lane, Marengo, IL 60152
MLS# 12602674Listed by: KELLER WILLIAMS SUCCESS REALTY $349,000Pending4 beds 3 baths1,900 sq. ft.
831 Chestnut Court, Marengo, IL 60152
MLS# 12611147Listed by: CATON RESIDENTIAL REALTY LLC $399,900Pending3 beds 4 baths1,540 sq. ft.
211 1/2 E Forest Street, Marengo, IL 60152
MLS# 12612727Listed by: BERKSHIRE HATHAWAY HOMESERVICES STARCK REAL ESTATE $450,000Pending3 beds 2 baths1,850 sq. ft.
19203 Collins Road, Marengo, IL 60152
MLS# 12610859Listed by: BERKSHIRE HATHAWAY HOMESERVICES STARCK REAL ESTATE $299,900Pending4 beds 2 baths2,400 sq. ft.
351 Elm Street, Marengo, IL 60152
MLS# 12611738Listed by: RE/MAX CONNECTIONS II $274,900Pending2 beds 1 baths1,000 sq. ft.
11530 S Il Route 23, Marengo, IL 60152
MLS# 12610258Listed by: WILK REAL ESTATE $375,000Active3 beds 3 baths1,900 sq. ft.
701 Woodland Lane, Marengo, IL 60152
MLS# 12608339Listed by: RE/MAX CONNECTIONS II $795,000Pending3 beds 2 baths1,741 sq. ft.
9119 Riley Road, Marengo, IL 60152
MLS# 12608325Listed by: COLDWELL BANKER REALTY $315,000Pending3 beds 2 baths1,408 sq. ft.
425 Kishwaukee Street, Marengo, IL 60152
MLS# 12607041Listed by: PREMIER LIVING PROPERTIES $65,000Active1.01 Acres
10216 Ellery Lane, Huntley, IL 60142
MLS# 12607797Listed by: BROKEROCITY $449,000Pending4 beds 4 baths2,590 sq. ft.
6225 Lakewood Drive, Marengo, IL 60152
MLS# 12607490Listed by: EXP REALTY $775,000Pending3 beds 3 baths2,500 sq. ft.
22011 Pringle Drive, Marengo, IL 60152
MLS# 12606413Listed by: BERKSHIRE HATHAWAY HOMESERVICES STARCK REAL ESTATE $25,000Pending3 beds 2 baths
313 E Grant Highway, Marengo, IL 60152
MLS# 12600743Listed by: FOUR SEASONS REALTY, INC. $350,000Pending3 beds 3 baths1,650 sq. ft.
510 Eisenhower Street, Marengo, IL 60152
MLS# 12602631Listed by: CENTURY 21 INTEGRA $120,000Active-- beds -- baths
18303 Loretta Drive, Marengo, IL 60152
MLS# 12601747Listed by: BERKSHIRE HATHAWAY HOMESERVICES CHICAGO $242,500Pending2 beds 2 baths1,300 sq. ft.
425 Artell Street, Marengo, IL 60152
MLS# 12598836Listed by: KELLER WILLIAMS REALTY SIGNATURE $750,000Pending5 beds 5 baths3,916 sq. ft.
17423 Cobblestone Bend, Marengo, IL 60152
MLS# 12589425Listed by: COMPASS $76,900Active0.5 Acres
Lot 38 Saint Andrews Drive, Marengo, IL 60152
MLS# 12592401Listed by: RE/MAX CONNECTIONS II $72,900Active0.49 Acres
9417 Saint Andrews Drive, Marengo, IL 60152
MLS# 12592404Listed by: RE/MAX CONNECTIONS II $379,900Active4 beds 2 baths1,740 sq. ft.
815 Whitetail Drive, Marengo, IL 60152
MLS# 12589904Listed by: SUBURBAN LIFE REALTY, LTD $329,900Active4 beds 3 baths2,804 sq. ft.
836 Oak Manor Drive, Marengo, IL 60152
MLS# 12577431Listed by: COMPASS $389,000Pending3 beds 3 baths1,767 sq. ft.
10193 Mcmahon Way, Huntley, IL 60142
MLS# 12580471Listed by: HOMESMART CONNECT $435,000Active4 beds 3 baths2,157 sq. ft.
870 Mildred Drive, Marengo, IL 60152
MLS# 12580446Listed by: BAIRD & WARNER REAL ESTATE - ALGONQUIN $348,900Pending-- beds -- baths
0000 Busse Road, Marengo, IL 60152
MLS# 12578511Listed by: RE/MAX CONNECTIONS II $250,000Active-- beds -- baths
lot 4 Morris Drive, Marengo, IL 60152
MLS# 12577833Listed by: COLDWELL BANKER REALTY $27,500Active0.27 Acres
579 Johnson Street, Marengo, IL 60152
MLS# 12538919Listed by: BERKSHIRE HATHAWAY HOMESERVICES STARCK REAL ESTATE $409,990Pending4 beds 3 baths2,453 sq. ft.
915 Courtney Lane, Marengo, IL 60152
MLS# 12573689Listed by: LITTLE REALTY $705,870Active3 beds 3 baths2,381 sq. ft.
16309 Stacy Lane, Huntley, IL 60142
MLS# 12563338Listed by: KELLER WILLIAMS THRIVE $809,200Active3 beds 3 baths2,422 sq. ft.
10309 Ellery Lane, Huntley, IL 60142
MLS# 12563300Listed by: KELLER WILLIAMS THRIVE $518,900Pending3 beds 3 baths2,625 sq. ft.
1406 Busse Road, Marengo, IL 60152
MLS# 12558368Listed by: RE/MAX CONNECTIONS II $90,000Active1 Acres
10310 Ellery Lane, Huntley, IL 60142
MLS# 12530260Listed by: RE/MAX CONNECTIONS II $409,000Active4 beds 4 baths2,718 sq. ft.
3203 Elizabeth Street, Marengo, IL 60152
MLS# 12529038Listed by: RE/MAX CONNECTIONS II $721,200Active3 beds 2 baths2,400 sq. ft.
10701 Clearwater Way, Huntley, IL 60142
MLS# 12407418Listed by: KELLER WILLIAMS THRIVE $750,000Pending4 beds 2 baths2,000 sq. ft.
22105 Anthony Road, Marengo, IL 60152
MLS# 12518860Listed by: CENTURY 21 NEW HERITAGE $380,000Active4 beds 1 baths2,200 sq. ft.
737 E Grant Highway, Marengo, IL 60152
MLS# 12518877Listed by: CENTURY 21 NEW HERITAGE $379,900Active4 beds 2 baths1,740 sq. ft.
790 Cascade Drive, Marengo, IL 60152
MLS# 12516650Listed by: SUBURBAN LIFE REALTY, LTD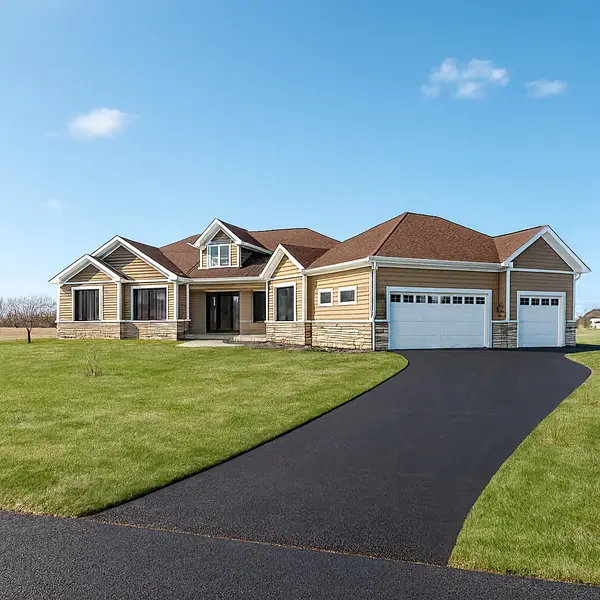 $755,000Pending3 beds 2 baths2,490 sq. ft.
10705 Clearwater Way, Huntley, IL 60142
MLS# 12527875Listed by: KELLER WILLIAMS THRIVE $466,000Active-- beds -- baths
10 ac 20 Highway, Marengo, IL 60152
MLS# 12491067Listed by: HOMETOWN REALTY, LTD. $625,000Active-- beds -- baths
3703 Millstream Road, Marengo, IL 60152
MLS# 12495449Listed by: BEYCOME BROKERAGE REALTY LLC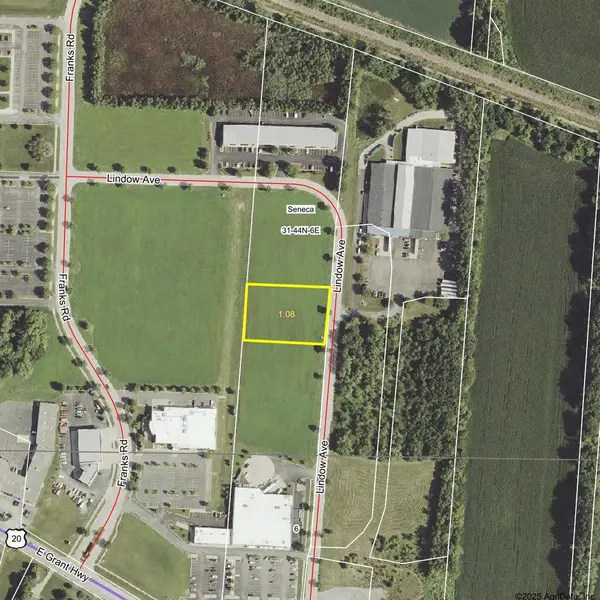 $212,076Active1.08 Acres
5 Lindow Lane, Marengo, IL 60152
MLS# 12494813Listed by: HOMETOWN REALTY, LTD. $212,706Active1.47 Acres
6 Lindow Lane, Marengo, IL 60152
MLS# 12494783Listed by: HOMETOWN REALTY, LTD.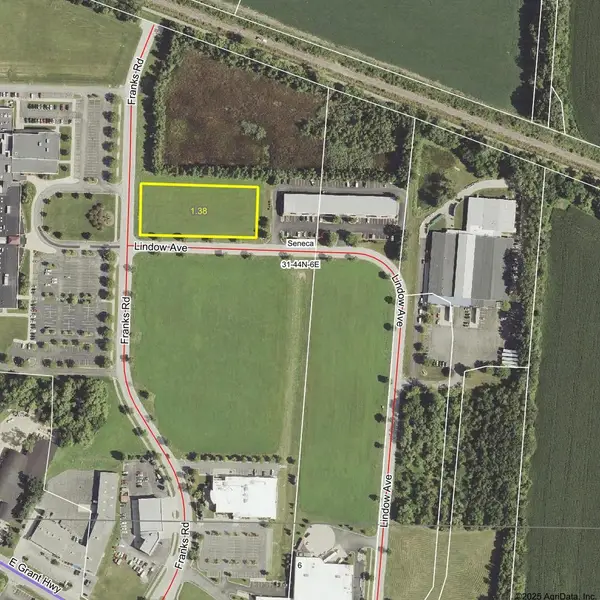 $285,315Active5.66 Acres
8 Lindow Lane, Marengo, IL 60152
MLS# 12494364Listed by: HOMETOWN REALTY, LTD. $34,500Active0.3 Acres
459 Kennedy Street, Marengo, IL 60152
MLS# 12486087Listed by: BERKSHIRE HATHAWAY HOMESERVICES STARCK REAL ESTATE $1,025,000Active10 Acres
813 Menge Road, Marengo, IL 60152
MLS# 12470820Listed by: BAIRD & WARNER $64,900Active0.5 Acres
10006 Saint Andrews Drive, Marengo, IL 60152
MLS# 12556325Listed by: NORTHERN ILLINOIS REALTY LLC $359,900Active3 beds 2 baths1,435 sq. ft.
819 Whitetail Trail, Marengo, IL 60152
MLS# 12423222Listed by: SUBURBAN LIFE REALTY, LTD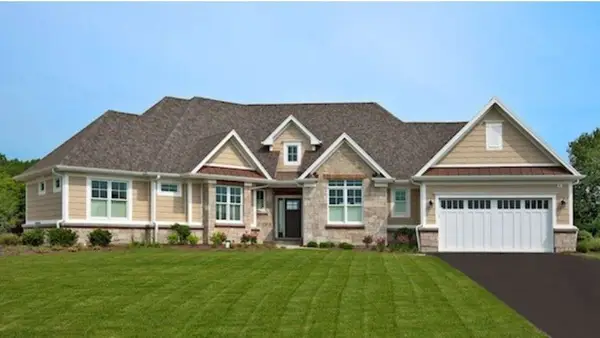 $757,840Pending3 beds 2 baths2,715 sq. ft.
10410 Oakdale Drive, Huntley, IL 60142
MLS# 12419437Listed by: KELLER WILLIAMS THRIVE $968,780Pending3 beds 3 baths2,626 sq. ft.
10304 Oakdale Drive, Huntley, IL 60142
MLS# 12419253Listed by: KELLER WILLIAMS THRIVE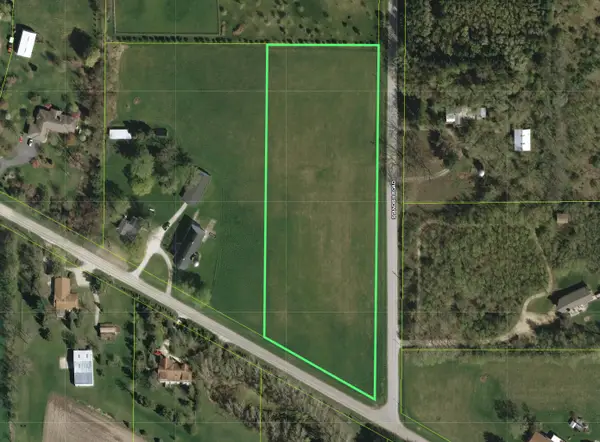 $172,500Active-- beds -- baths
19209 River Road, Marengo, IL 60152
MLS# 12562397Listed by: RE/MAX CONNECTIONS II $727,000Active3 beds 2 baths2,436 sq. ft.
10502 Henning Drive, Huntley, IL 60142
MLS# 12405871Listed by: KELLER WILLIAMS THRIVE $675,000Pending3 beds 2 baths2,400 sq. ft.
10509 Henning Drive, Huntley, IL 60142
MLS# 12405747Listed by: KELLER WILLIAMS THRIVE $802,467Pending3 beds 2 baths2,400 sq. ft.
10019 Henning Drive, Huntley, IL 60142
MLS# 12388595Listed by: KELLER WILLIAMS THRIVE $788,243Pending3 beds 2 baths2,400 sq. ft.
10415 Henning Drive, Huntley, IL 60142
MLS# 12372972Listed by: KELLER WILLIAMS THRIVE $730,000Pending3 beds 2 baths2,422 sq. ft.
9915 Henning Drive, Huntley, IL 60142
MLS# 12366467Listed by: KELLER WILLIAMS THRIVE $794,554Pending3 beds 3 baths2,547 sq. ft.
10702 Clearwater Way, Huntley, IL 60142
MLS# 12366389Listed by: KELLER WILLIAMS THRIVE $846,750Active3 beds 3 baths2,525 sq. ft.
10208 Henning Drive, Huntley, IL 60142
MLS# 12346274Listed by: KELLER WILLIAMS THRIVE $374,900Active3 beds 2 baths1,522 sq. ft.
817 Whitetail Drive, Marengo, IL 60152
MLS# 12332031Listed by: SUBURBAN LIFE REALTY, LTD $727,570Pending3 beds 2 baths2,400 sq. ft.
9907 Henning Drive, Huntley, IL 60142
MLS# 12302830Listed by: KELLER WILLIAMS THRIVE $849,080Active3 beds 2 baths2,700 sq. ft.
10108 Henning Drive, Huntley, IL 60142
MLS# 12302902Listed by: KELLER WILLIAMS THRIVE $800,000Pending-- beds -- baths
0 Grange Road, Marengo, IL 60152
MLS# 12301575Listed by: BERKSHIRE HATHAWAY HOMESERVICES STARCK REAL ESTATE $475,000Active76 Acres
0 Deerpass Road, Marengo, IL 60152
MLS# 12276550Listed by: WHITETAIL PROPERTIES REAL ESTATE, LLC $555,000Pending3 beds 2 baths1,940 sq. ft.
16218 Stacy Lane, Huntley, IL 60142
MLS# 12281284Listed by: KELLER WILLIAMS THRIVE $744,000Active3 beds 2 baths2,500 sq. ft.
10208 Oakdale Drive, Huntley, IL 60142
MLS# 12262126Listed by: KELLER WILLIAMS THRIVE $778,060Active3 beds 3 baths2,600 sq. ft.
10201 Henning Drive, Huntley, IL 60142
MLS# 12256238Listed by: KELLER WILLIAMS THRIVE $539,000Active2 beds 2 baths1,803 sq. ft.
16214 Stacy Lane, Huntley, IL 60142
MLS# 12257301Listed by: KELLER WILLIAMS THRIVE $75,900Active1.07 Acres
10817 Hill Crest Lane, Marengo, IL 60152
MLS# 12147531Listed by: RE/MAX AT HOME $2,250,000Active90 Acres
0 Church Road, Marengo, IL 60152
MLS# 12107441Listed by: PREMIER COMMERCIAL REALTY $1,286,000Active25.2 Acres
0 S Grant Highway, Marengo, IL 60152
MLS# 12107273Listed by: PREMIER COMMERCIAL REALTY $727,000Active3 beds 2 baths2,500 sq. ft.
10408 Henning Drive, Huntley, IL 60142
MLS# 12256313Listed by: KELLER WILLIAMS THRIVE $83,900Active2.25 Acres
704 Echo (lot 21) Trail, Marengo, IL 60152
MLS# 12386105Listed by: RE/MAX CONNECTIONS II $68,900Active1.31 Acres
802 Echo (lot 23) Trail, Marengo, IL 60152
MLS# 12386110Listed by: RE/MAX CONNECTIONS II $83,900Active2.46 Acres
806 Echo (lot 22) Trail, Marengo, IL 60152
MLS# 12386111Listed by: RE/MAX CONNECTIONS II $53,900Active1.63 Acres
911 Echo (lot 5) Trail, Marengo, IL 60152
MLS# 12386107Listed by: RE/MAX CONNECTIONS II $57,900Active1.78 Acres
910 Echo (lot 6) Trail, Marengo, IL 60152
MLS# 12386112Listed by: RE/MAX CONNECTIONS II $1,249,000Active3 beds 2 baths1,000 sq. ft.
18708 Beck Road, Marengo, IL 60152
MLS# 12068014Listed by: RE/MAX PROPERTIES NORTHWEST $1,860,000Active-- beds -- baths
0 Maple Street, Marengo, IL 60152
MLS# 12574412Listed by: RE/MAX PLAZA $29,900Active0.82 Acres
4 Mary Street, Marengo, IL 60152
MLS# 11784473Listed by: HOMETOWN REALTY, LTD. $40,000Active1 Acres
0 Lot 2 Ratfield Road, Marengo, IL 60152
MLS# 12301585Listed by: BERKSHIRE HATHAWAY HOMESERVICES STARCK REAL ESTATE $1,200,000Active38 Acres
00 Maple Street, Marengo, IL 60152
MLS# 11683819Listed by: BLUE CHIP COMMERCIAL REAL ESTATE
Local realty services provided by:CENTURY 21 New Beginnings
Copyright 2026 Midwest Real Estate Data LLC. All rights reserved. The data relating to real estate for sale on this web site comes in part from the Broker Reciprocity Program of the Midwest Real Estate Data LLC. Listing information is deemed reliable but not guaranteed.
Popular searches near 60152
Popular neighborhoods near 60152
- Big Sky, Lake In The Hills homes for sale
- Boone Valley, McHenry homes for sale
- Cambridge Lakes, Pingree Grove homes for sale
- Coventry, Crystal Lake homes for sale
- Covington Lakes, Huntley homes for sale
- Deerpass, Marengo homes for sale
- Del Webb's Sun City, Huntley homes for sale
- Dundee, Carpentersville homes for sale
- Four Colonies, Crystal Lake homes for sale
- High Hill Farms, Algonquin homes for sale
- Lake in the Hills Estates, Lake In The Hills homes for sale
- Meadowbrook, Lake In The Hills homes for sale
- Shamrock Farms, McHenry homes for sale
- Shore Hills, Wonder Lake homes for sale
- Spring Lake Farms, Lake In The Hills homes for sale
- Sunrise Ridge, Wonder Lake homes for sale
- Talamore, Huntley homes for sale
- The Villages, Crystal Lake homes for sale
- Turnberry, Lakewood homes for sale
- Winding Creek, McHenry homes for sale
Counties near Marengo, 60152
- Boone County homes for sale
- Cook County homes for sale
- DeKalb County homes for sale
- DuPage County homes for sale
- Green County homes for sale
- Jefferson County homes for sale
- Kane County homes for sale
- Kendall County homes for sale
- Kenosha County homes for sale
- Lake County homes for sale
- Lee County homes for sale
- McHenry County homes for sale
- Ogle County homes for sale
- Racine County homes for sale
- Rock County homes for sale
- Stephenson County homes for sale
- Walworth County homes for sale
- Waukesha County homes for sale
- Will County homes for sale
- Winnebago County homes for sale
Protect your home and budget from life's surprises with an Assurant Home Warranty, backed by a partner that supports you through every step of homeownership. Explore Plans.
©2026 Century 21 Real Estate LLC. All rights reserved. CENTURY 21®, the CENTURY 21 Logo and C21® are service marks owned by Century 21 Real Estate LLC. Century 21 Real Estate LLC fully supports the principles of the Fair Housing Act and the Equal Opportunity Act. Each office is independently owned and operated. Listing information is deemed reliable but not guaranteed accurate.