- Aurora homes for sale
- Aurora Township homes for sale
- Big Rock homes for sale
- Boulder Hill homes for sale
- Bristol homes for sale
- Kendall homes for sale
- Montgomery homes for sale
- Na-Au-Say homes for sale
- Naperville homes for sale
- North Aurora homes for sale
- Oswego homes for sale
- Oswego Township homes for sale
- Plainfield homes for sale
- Plano homes for sale
- Prestbury homes for sale
- Seward homes for sale
- Sugar Grove Township homes for sale
- Sunnyland homes for sale
- Wheatland homes for sale
- Yorkville homes for sale
60543, IL - homes for sale
300 of 303 results displayed
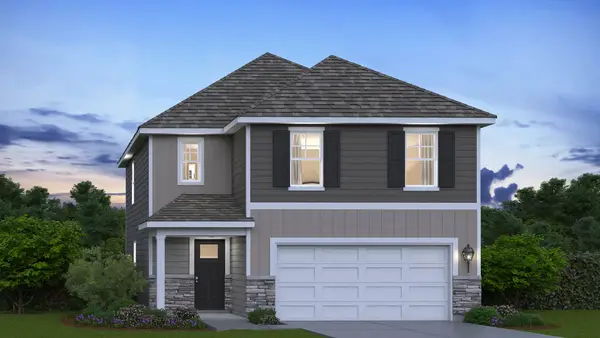
- Open Sat, 11am to 1pmNew
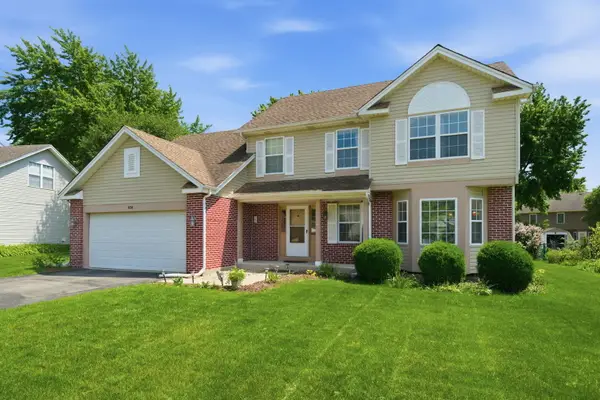
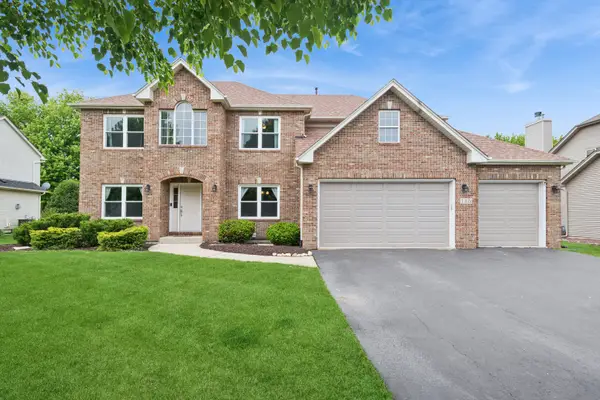
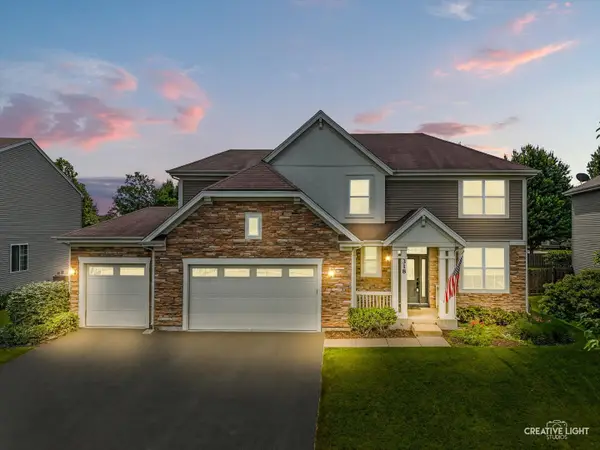 $575,000Active5 beds 4 baths2,998 sq. ft.
318 Winthrop Drive, Oswego, IL 60543
MLS# 12642864Listed by: JOHN GREENE, REALTOR
- New
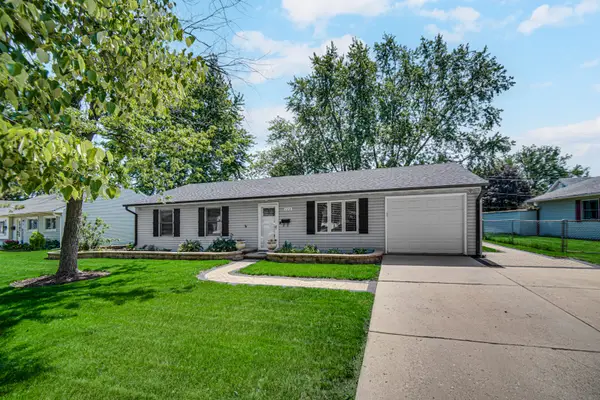
 $319,900Active3 beds 2 baths1,260 sq. ft.
324 Boulder Hill Pass, Oswego, IL 60543
MLS# 12659426Listed by: EXIT REALTY REDEFINED - New
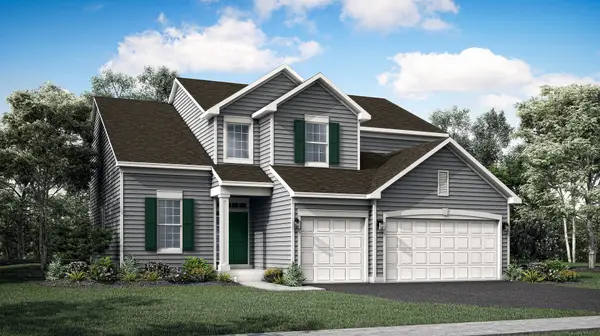
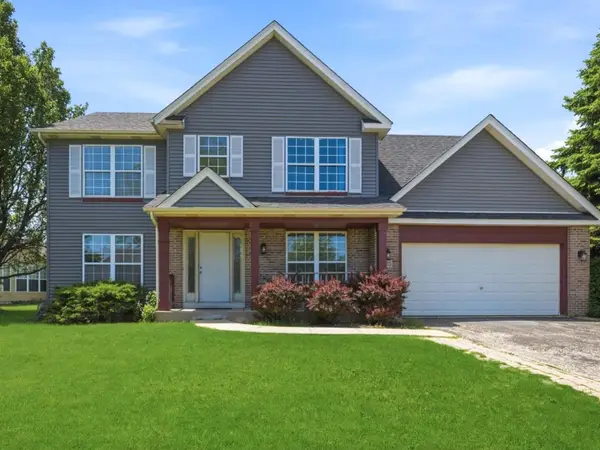
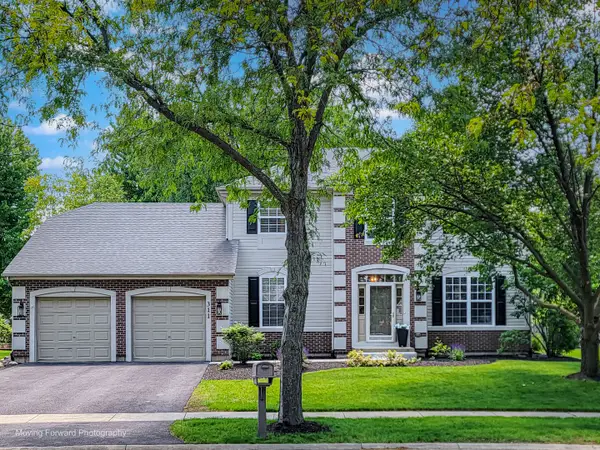
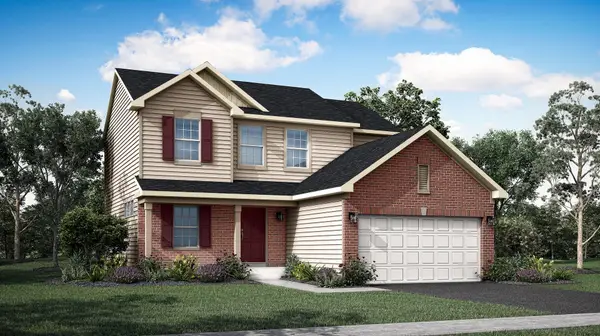
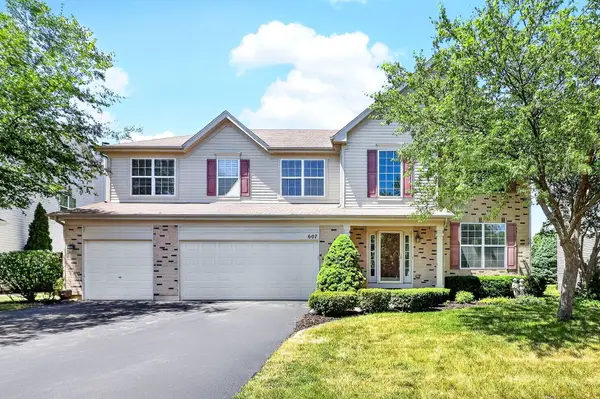 $608,000Active5 beds 4 baths3,454 sq. ft.
607 Mansfield Way, Oswego, IL 60543
MLS# 12667759Listed by: RE/MAX OF NAPERVILLE - New
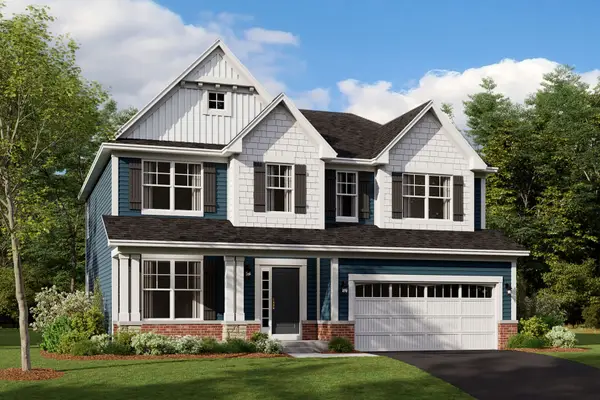
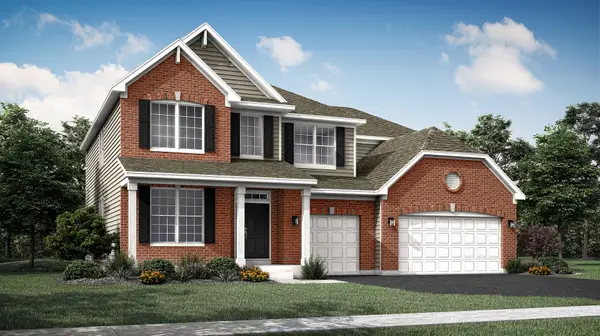
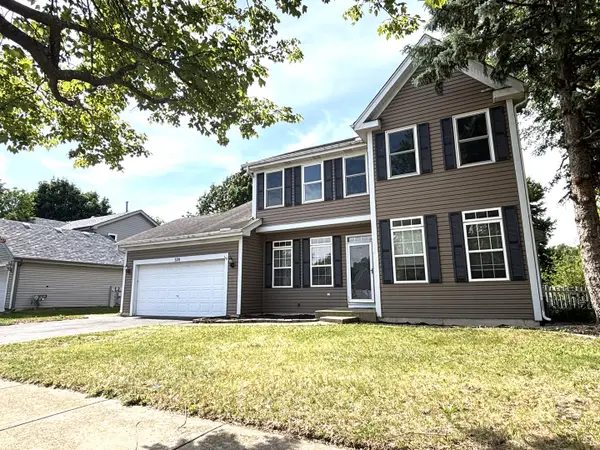
 $599,300Active4 beds 3 baths2,360 sq. ft.
743 Fairfield Drive, Oswego, IL 60543
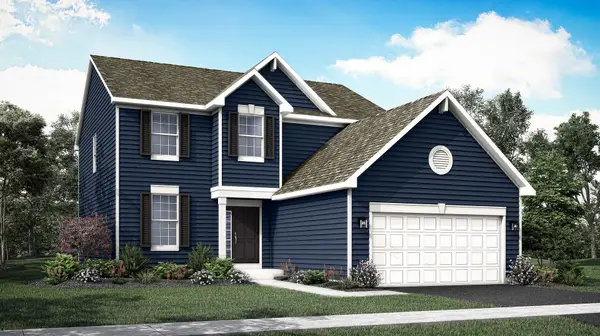
MLS# 12640564Listed by: LITTLE REALTY - Open Sat, 12 to 5pmNew
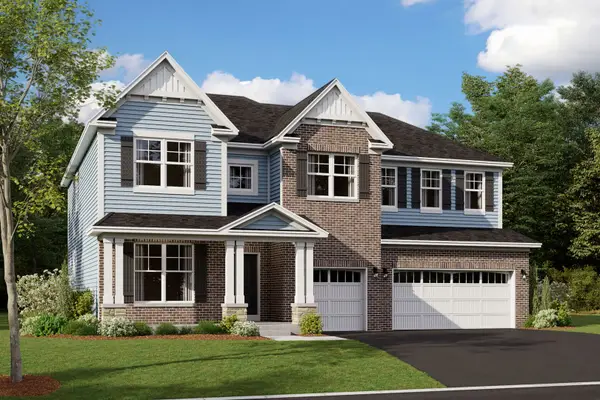
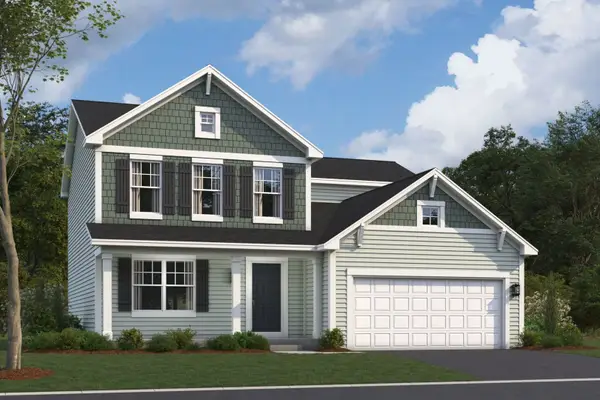
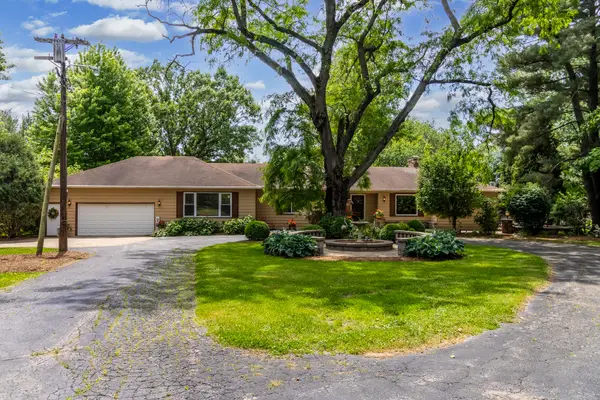
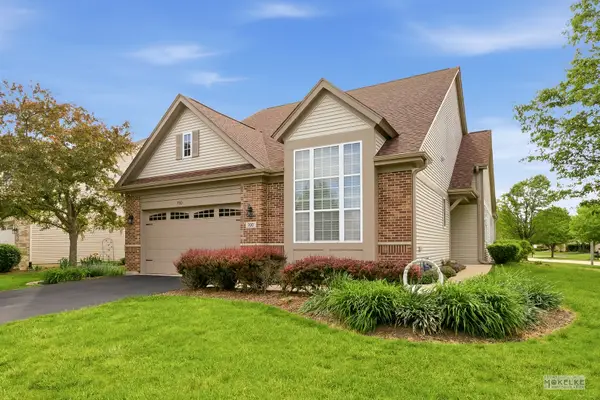
 $589,990Active4 beds 3 baths2,872 sq. ft.
402 Tanya Lane, Oswego, IL 60543
MLS# 12650738Listed by: LITTLE REALTY - New
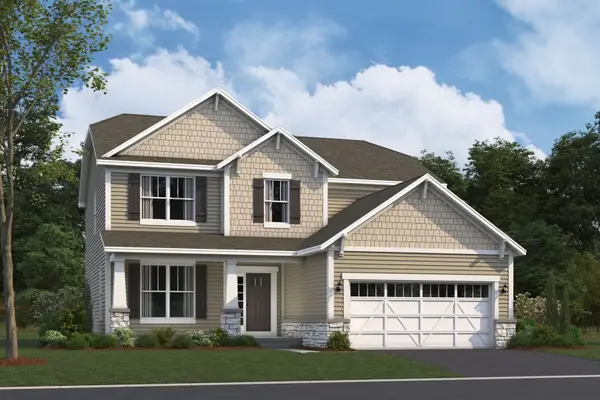
 $549,990Active4 beds 3 baths2,470 sq. ft.
407 Tanya Lane, Oswego, IL 60543
MLS# 12650746Listed by: LITTLE REALTY - New
 $560,390Active3 beds 3 baths2,360 sq. ft.
716 Fairfield Drive, Oswego, IL 60543
MLS# 12651255Listed by: LITTLE REALTY - New
 $592,620Active4 beds 3 baths2,360 sq. ft.
411 Tanya Lane, Oswego, IL 60543
MLS# 12651754Listed by: LITTLE REALTY - Open Sat, 12 to 5pmNew
 $639,990Active4 beds 3 baths3,145 sq. ft.
721 Fairfield Drive, Oswego, IL 60543
MLS# 12652956Listed by: LITTLE REALTY - New
 $537,630Active4 beds 3 baths2,289 sq. ft.
323 Monica Lane, Oswego, IL 60543
MLS# 12658109Listed by: LITTLE REALTY - New
 $530,840Active4 beds 3 baths2,437 sq. ft.
220 Piper Glen Avenue, Oswego, IL 60543
MLS# 12658154Listed by: LITTLE REALTY - New
 $588,280Active3 beds 3 baths2,360 sq. ft.
415 Tanya Lane, Oswego, IL 60543
MLS# 12659673Listed by: LITTLE REALTY - Open Sat, 12 to 5pmNew
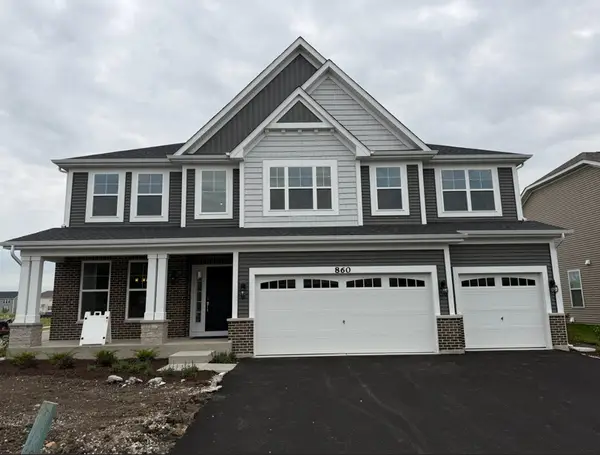 $599,990Active4 beds 3 baths3,342 sq. ft.
860 Preston Court, Oswego, IL 60543
MLS# 12662362Listed by: LITTLE REALTY - New
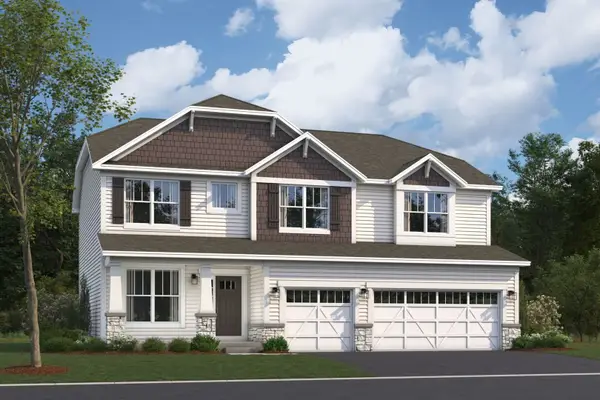 $680,085Active4 beds 3 baths2,872 sq. ft.
719 Fairfield Drive, Oswego, IL 60543
MLS# 12665317Listed by: LITTLE REALTY - New
 $717,040Active4 beds 3 baths3,145 sq. ft.
717 Fairfield Drive, Oswego, IL 60543
MLS# 12665421Listed by: LITTLE REALTY - New
 $724,280Active4 beds 3 baths2,872 sq. ft.
705 Pomfret Court, Oswego, IL 60543
MLS# 12665437Listed by: LITTLE REALTY - New
 $752,915Active4 beds 3 baths3,145 sq. ft.
703 Pomfret Court, Oswego, IL 60543
MLS# 12665467Listed by: LITTLE REALTY - Open Sun, 2 to 4pmNew
 $580,000Active5 beds 4 baths3,672 sq. ft.
221 Willington Way, Oswego, IL 60543
MLS# 12667318Listed by: JOHN GREENE, REALTOR - Open Sat, 11am to 2pmNew
 $444,900Active4 beds 3 baths2,152 sq. ft.
329 Millstream Lane, Oswego, IL 60543
MLS# 12657411Listed by: REALTY EXECUTIVES SUCCESS - Open Sat, 10am to 1pmNew
 $335,000Active4 beds 1 baths1,176 sq. ft.
128 Saugatuck Road, Montgomery, IL 60538
MLS# 12666212Listed by: SMART HOME REALTY - New
 $540,990Active4 beds 3 baths2,386 sq. ft.
436 Hathaway Lane, Oswego, IL 60543
MLS# 12666896Listed by: HOMESMART CONNECT LLC - New
 $586,266Active4 beds 3 baths2,612 sq. ft.
705 Erwin Street, Oswego, IL 60543
MLS# 12666925Listed by: HOMESMART CONNECT LLC - New
 $634,691Active4 beds 3 baths3,146 sq. ft.
710 Erwin Street, Oswego, IL 60543
MLS# 12666958Listed by: HOMESMART CONNECT LLC - New
 $639,000Active3 beds 3 baths2,400 sq. ft.
6274 Us Highway 34 Highway, Oswego, IL 60543
MLS# 12659175Listed by: LEGACY REAL ESTATE - Open Sat, 12 to 2pmNew
 $585,000Active4 beds 3 baths3,755 sq. ft.
627 Mansfield Way, Oswego, IL 60543
MLS# 12641109Listed by: BERKSHIRE HATHAWAY HOMESERVICES STARCK REAL ESTATE - New
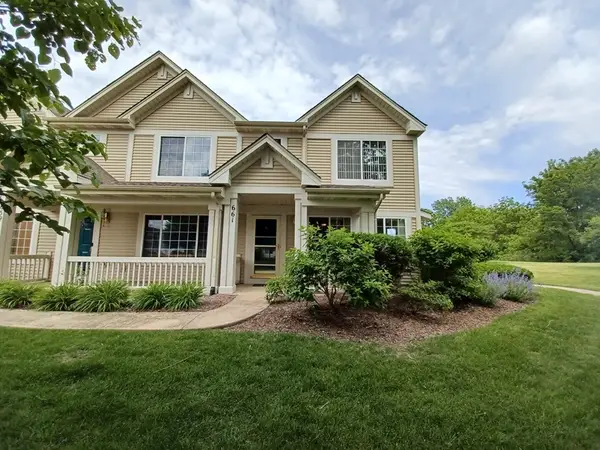 $300,000Active2 beds 3 baths1,334 sq. ft.
661 Lincoln Station Drive, Oswego, IL 60543
MLS# 12664886Listed by: CHARLES RUTENBERG REALTY OF IL - New
 $499,000Active4 beds 3 baths3,273 sq. ft.
653 Otter Way, Oswego, IL 60543
MLS# 12641557Listed by: KELLER WILLIAMS INNOVATE - New
 $600,000Active3 beds 4 baths2,524 sq. ft.
9 Tomahawk Trail, Oswego, IL 60543
MLS# 12662253Listed by: HEALY REAL ESTATE - New
 $459,990Active4 beds 3 baths1,953 sq. ft.
2432 Semillon Street, Oswego, IL 60543
MLS# 12663875Listed by: DAYNAE GAUDIO - New
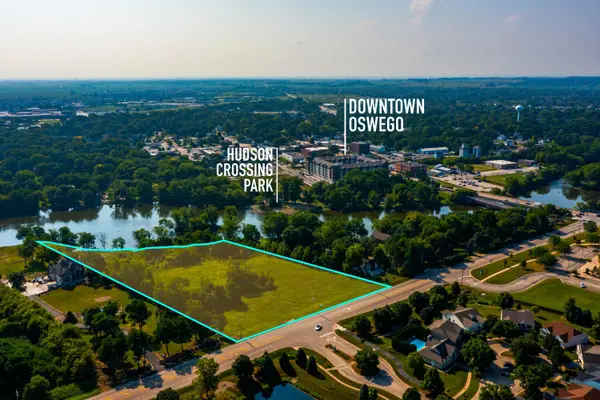 $1,595,000Active5.43 Acres
5.43 B-3 Commercial Acres State Route 31, Oswego, IL 60543
MLS# 12663512Listed by: JOHN GREENE, REALTOR - New
 $449,900Active4 beds 3 baths2,429 sq. ft.
225 Parkside Lane, Oswego, IL 60543
MLS# 12662746Listed by: ANGELA WALKER HOMES REAL ESTATE GROUP - New
 $419,900Active4 beds 3 baths2,200 sq. ft.
328 Barnaby Drive, Oswego, IL 60543
MLS# 12661280Listed by: SIGNATURE REALTY GROUP LLC 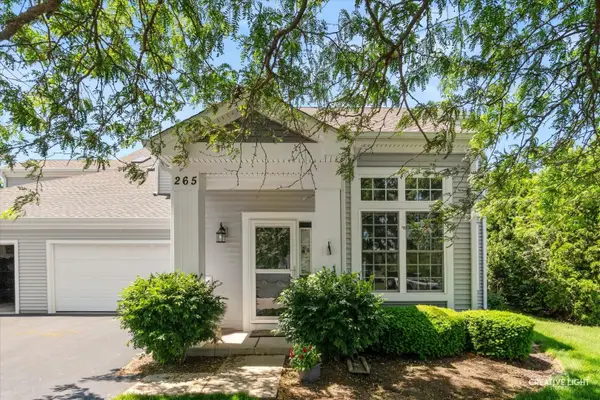 $284,990Pending2 beds 2 baths1,273 sq. ft.
265 Grays Drive #265, Oswego, IL 60543
MLS# 12657703Listed by: JOHN GREENE, REALTOR $360,000Pending4 beds 3 baths2,522 sq. ft.
546 Tewksbury Circle, Oswego, IL 60543
MLS# 12662104Listed by: RE/MAX ULTIMATE PROFESSIONALS $360,000Pending3 beds 2 baths
427 Barnaby Drive, Oswego, IL 60543
MLS# 12662117Listed by: KELLER WILLIAMS INNOVATE- New
 $479,900Active5 beds 3 baths2,315 sq. ft.
452 Windsor Drive, Oswego, IL 60543
MLS# 12640182Listed by: JOHN GREENE, REALTOR - New
 $295,000Active3 beds 2 baths1,046 sq. ft.
6 Marlin Drive, Oswego, IL 60543
MLS# 12662178Listed by: HOMESMART REALTY GROUP - New
 $525,000Active3 beds 2 baths2,032 sq. ft.
135 S Devoe Drive, Oswego, IL 60543
MLS# 12652100Listed by: KELLER WILLIAMS INFINITY - New
 $539,900Active4 beds 4 baths2,700 sq. ft.
230 Liszka Lane, Oswego, IL 60543
MLS# 12660326Listed by: RE/MAX MI CASA  $339,900Pending3 beds 3 baths1,705 sq. ft.
302 Devoe Drive, Oswego, IL 60543
MLS# 12661075Listed by: COLDWELL BANKER REALTY $485,000Pending3 beds 2 baths1,729 sq. ft.
692 Canton Court, Oswego, IL 60543
MLS# 12661376Listed by: CIRCLE ONE REALTY $999,000Pending4 beds 4 baths2,855 sq. ft.
1651 Johnson Road, Oswego, IL 60543
MLS# 12660759Listed by: JOHN GREENE, REALTOR- New
 $675,000Active5 beds 5 baths3,663 sq. ft.
390 Bloomfield Circle E, Oswego, IL 60543
MLS# 12651593Listed by: JOHN GREENE, REALTOR - New
 $324,990Active3 beds 3 baths1,543 sq. ft.
3305 Farren Street, Yorkville, IL 60560
MLS# 12659108Listed by: DAYNAE GAUDIO - New
 $334,990Active3 beds 3 baths1,543 sq. ft.
3301 Farren Street, Yorkville, IL 60560
MLS# 12659146Listed by: DAYNAE GAUDIO  $319,900Pending2 beds 3 baths1,471 sq. ft.
398 Chesapeake Lane #2, Oswego, IL 60543
MLS# 12660973Listed by: KELLER WILLIAMS NORTH SHORE WEST- Open Sun, 12 to 3pmNew
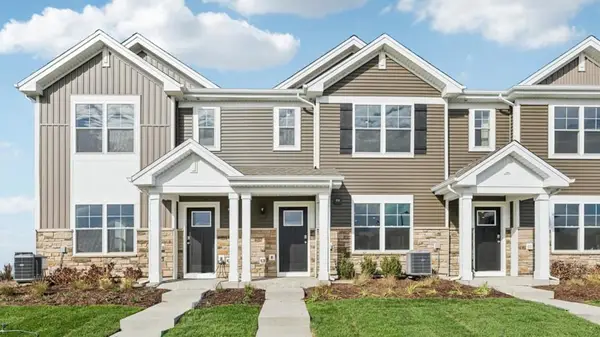
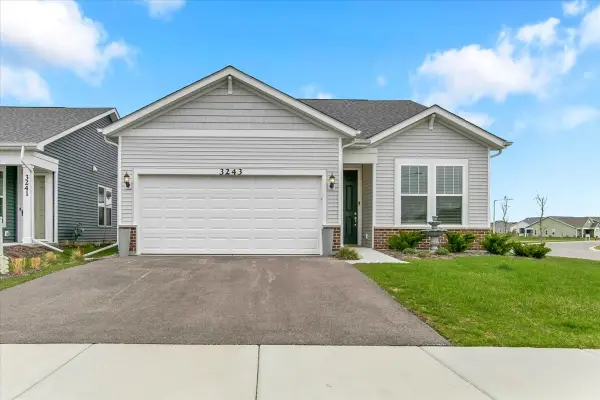 $449,900Active2 beds 2 baths1,907 sq. ft.
3243 Sweetgrass Circle, Aurora, IL 60503
MLS# 12661287Listed by: CIRCLE ONE REALTY - New
 $525,000Active4 beds 3 baths2,370 sq. ft.
497 Treasure Drive, Oswego, IL 60543
MLS# 12658637Listed by: DPG REAL ESTATE AGENCY  $395,000Pending3 beds 3 baths1,840 sq. ft.
227 Cooney Way, Oswego, IL 60543
MLS# 12659757Listed by: HOMESMART CONNECT LLC- New
 $382,990Active3 beds 3 baths1,543 sq. ft.
2269 Barbera Drive, Oswego, IL 60543
MLS# 12654658Listed by: DAYNAE GAUDIO - New
 $337,990Active3 beds 3 baths1,543 sq. ft.
2273 Barbera Drive, Oswego, IL 60543
MLS# 12654693Listed by: DAYNAE GAUDIO - New
 $337,990Active3 beds 3 baths1,543 sq. ft.
2275 Barbera Drive, Oswego, IL 60543
MLS# 12654699Listed by: DAYNAE GAUDIO - New
 $439,900Active4 beds 3 baths2,299 sq. ft.
636 Briarwood Lane, Oswego, IL 60543
MLS# 12658826Listed by: REMAX LEGENDS - New
 $500,000Active4 beds 3 baths2,600 sq. ft.
311 Greenwood Place, Oswego, IL 60543
MLS# 12659368Listed by: KELLER WILLIAMS INNOVATE 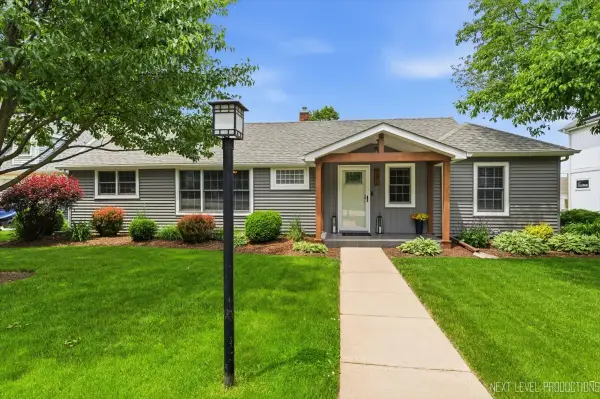 $399,900Pending3 beds 2 baths1,324 sq. ft.
261 Main Street S, Oswego, IL 60543
MLS# 12658974Listed by: CHARLES RUTENBERG REALTY OF IL- New
 $568,996Active4 beds 3 baths2,448 sq. ft.
707 Erwin Street, Oswego, IL 60543
MLS# 12659159Listed by: HOMESMART CONNECT LLC 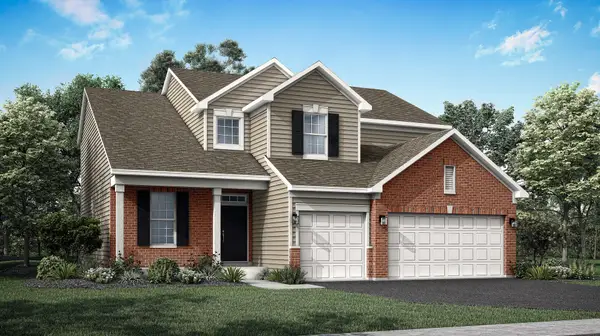 $617,711Pending4 beds 3 baths2,612 sq. ft.
706 Erwin Street, Oswego, IL 60543
MLS# 12659172Listed by: HOMESMART CONNECT LLC- New
 $557,996Active3 beds 3 baths2,163 sq. ft.
712 Erwin Street, Oswego, IL 60543
MLS# 12659198Listed by: HOMESMART CONNECT LLC - New
 $379,990Active3 beds 3 baths1,767 sq. ft.
219 Cooney Way, Oswego, IL 60543
MLS# 12659210Listed by: HOMESMART CONNECT LLC 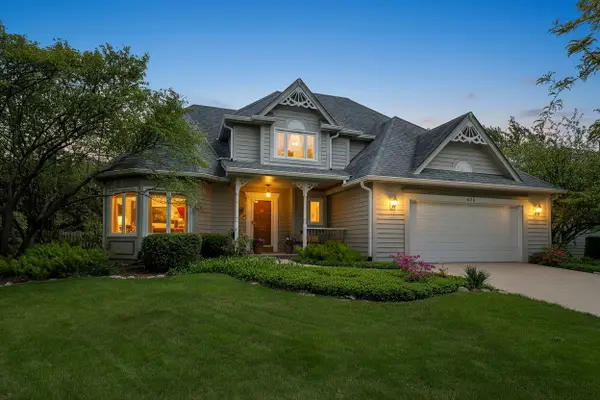 $435,000Pending4 beds 3 baths2,271 sq. ft.
496 Waubonsee Circle, Oswego, IL 60543
MLS# 12658702Listed by: COLDWELL BANKER REAL ESTATE GROUP- New
 $479,900Active2 beds 3 baths2,000 sq. ft.
700 Cheshire Court, Oswego, IL 60543
MLS# 12609411Listed by: COLDWELL BANKER REAL ESTATE GROUP - New
 $450,000Active4 beds 3 baths2,670 sq. ft.
4429 Bickford Avenue, Oswego, IL 60543
MLS# 12629601Listed by: JOHN GREENE, REALTOR - New
 $579,990Active4 beds 3 baths2,836 sq. ft.
2322 Hirsch Road, Oswego, IL 60543
MLS# 12656141Listed by: DAYNAE GAUDIO - New
 $544,990Active4 beds 3 baths2,600 sq. ft.
2318 Hirsch Drive, Oswego, IL 60543
MLS# 12656148Listed by: DAYNAE GAUDIO - New
 $479,990Active4 beds 3 baths1,953 sq. ft.
2404 Semillon Street, Oswego, IL 60543
MLS# 12656128Listed by: DAYNAE GAUDIO - New
 $454,990Active4 beds 3 baths1,953 sq. ft.
2401 Semillon Street, Oswego, IL 60543
MLS# 12656115Listed by: DAYNAE GAUDIO - New
 $434,990Active3 beds 3 baths1,663 sq. ft.
2408 Semillon Street, Oswego, IL 60543
MLS# 12657699Listed by: DAYNAE GAUDIO - New
 $399,999Active3 beds 3 baths2,221 sq. ft.
195 Lakeshore Drive, Oswego, IL 60543
MLS# 12641539Listed by: JOHN HU  $450,000Pending4 beds 3 baths2,618 sq. ft.
116 Northampton Drive, Oswego, IL 60543
MLS# 12656699Listed by: BAIRD & WARNER $325,000Active3 beds 3 baths1,520 sq. ft.
608 Hawley Drive, Oswego, IL 60543
MLS# 12656644Listed by: CHARLES RUTENBERG REALTY OF IL $499,900Pending4 beds 3 baths
205 Willowwood Drive, Oswego, IL 60543
MLS# 12649464Listed by: O'NEIL PROPERTY GROUP, LLC $575,000Active4 beds 3 baths3,422 sq. ft.
815 Preston Lane, Oswego, IL 60543
MLS# 12649840Listed by: KEYSTONE REALTY SERVICES INC $410,000Active4 beds 3 baths2,791 sq. ft.
424 Camden Circle, Oswego, IL 60543
MLS# 12651082Listed by: KELLER WILLIAMS INSPIRE - GENEVA $375,000Active3 beds 3 baths1,543 sq. ft.
2261 Riesling Road, Oswego, IL 60543
MLS# 12654409Listed by: KELLER WILLIAMS INFINITY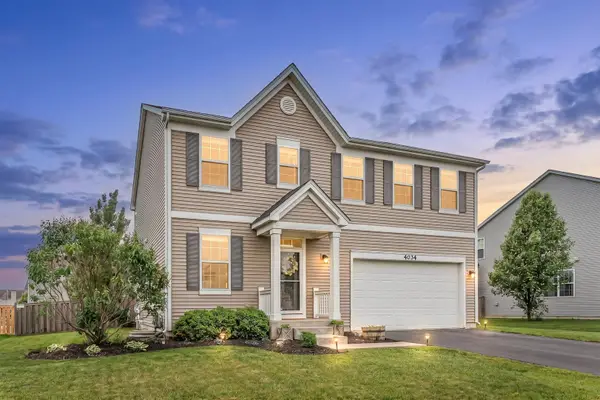 $425,000Pending3 beds 3 baths2,278 sq. ft.
4034 Hunt Club Drive, Oswego, IL 60543
MLS# 12635500Listed by: KELLER WILLIAMS INFINITY $1,200,000Active4 beds 3 baths3,147 sq. ft.
3614 Wolf Road, Oswego, IL 60543
MLS# 12634500Listed by: RE/MAX PROFESSIONALS SELECT $761,000Active4 beds 4 baths3,000 sq. ft.
483 Deerfield Drive, Oswego, IL 60543
MLS# 12655786Listed by: LPT REALTY $315,000Active2 beds 3 baths1,829 sq. ft.
613 Lincoln Station Drive #613, Oswego, IL 60543
MLS# 12638508Listed by: EXP REALTY $499,000Active4 beds 3 baths3,129 sq. ft.
730 Charismatic Drive, Oswego, IL 60543
MLS# 12654616Listed by: CARNELIAN REALTY GROUP $434,900Active3 beds 3 baths2,448 sq. ft.
420 Windsor Drive, Oswego, IL 60543
MLS# 12650952Listed by: EVERBRIGHT REALTY $482,000Pending5 beds 4 baths3,413 sq. ft.
241 Ashcroft Lane, Oswego, IL 60543
MLS# 12654906Listed by: BAIRD & WARNER $300,000Pending3 beds 2 baths1,451 sq. ft.
176 Presidential Boulevard, Oswego, IL 60543
MLS# 12626322Listed by: KELLER WILLIAMS INSPIRE - GENEVA- New
 $595,000Active5 beds 4 baths2,807 sq. ft.
115 Pineridge Drive S, Oswego, IL 60543
MLS# 12660879Listed by: BAIRD & WARNER 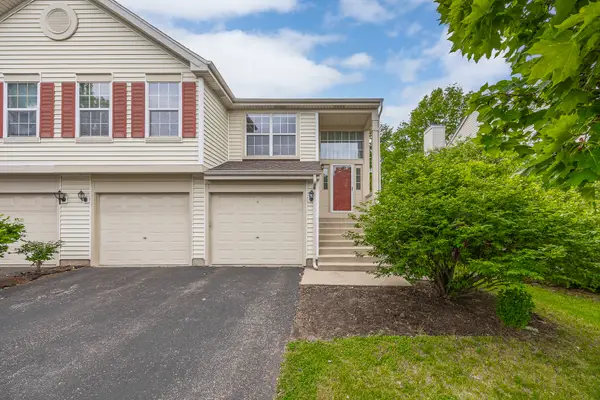 $380,000Active3 beds 3 baths1,720 sq. ft.
74 Seton Creek Drive, Oswego, IL 60543
MLS# 12654541Listed by: REMAX LEGENDS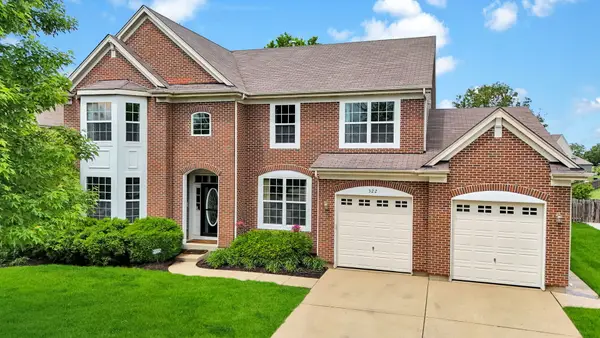 $719,000Active7 beds 6 baths6,094 sq. ft.
322 Hemlock Lane, Oswego, IL 60543
MLS# 12609660Listed by: KELLER WILLIAMS INFINITY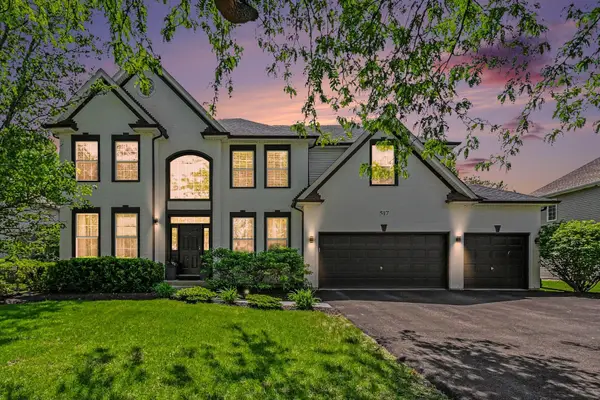 $600,000Active5 beds 4 baths2,873 sq. ft.
517 Meadowwood Lane, Oswego, IL 60543
MLS# 12650066Listed by: COLDWELL BANKER REAL ESTATE GROUP $334,896Pending3 beds 3 baths1,521 sq. ft.
656 Hawley Drive, Oswego, IL 60543
MLS# 12653663Listed by: CHARLES RUTENBERG REALTY OF IL $420,000Active2 beds 1 baths1,200 sq. ft.
34 N Adams Street, Oswego, IL 60543
MLS# 12653576Listed by: BERKSHIRE HATHAWAY HOMESERVICES CHICAGO $1,150,000Active5 beds 5 baths6,050 sq. ft.
1542 Plainfield Road, Oswego, IL 60543
MLS# 12644617Listed by: JAMESON SOTHEBY'S INTL REALTY $475,000Pending5 beds 4 baths2,752 sq. ft.
147 Linden Drive, Oswego, IL 60543
MLS# 12647906Listed by: JOHN GREENE, REALTOR $419,990Active3 beds 3 baths1,663 sq. ft.
2407 Semillon Street, Oswego, IL 60543
MLS# 12653495Listed by: DAYNAE GAUDIO $464,990Active4 beds 3 baths1,953 sq. ft.
2424 Semillon Street, Oswego, IL 60543
MLS# 12653497Listed by: DAYNAE GAUDIO
 $525,000Active4 beds 4 baths2,549 sq. ft.
739 Bonaventure Drive, Oswego, IL 60543
MLS# 12642895Listed by: CENTURY 21 CIRCLE $670,000Active4 beds 4 baths2,211 sq. ft.
352 Andover Drive, Oswego, IL 60543
MLS# 12630788Listed by: COLDWELL BANKER REALTY $369,990Pending3 beds 3 baths1,767 sq. ft.
233 Cooney Way, Oswego, IL 60543
MLS# 12651157Listed by: HOMESMART CONNECT LLC $495,000Active4 beds 3 baths2,216 sq. ft.
534 Chestnut Drive, Oswego, IL 60543
MLS# 12576866Listed by: KELLER WILLIAMS INSPIRE $89,900Pending1.16 Acres
Lot 11 Red Hawk Drive, Oswego, IL 60543
MLS# 12650361Listed by: BAIRD & WARNER $146,000Active1 beds 1 baths727 sq. ft.
1900 Light Road #210, Oswego, IL 60543
MLS# 12640778Listed by: CENTURY 21 INTEGRA- Open Sat, 11am to 1pm
 $639,900Active4 beds 3 baths3,342 sq. ft.
115 Piper Glen Avenue, Oswego, IL 60543
MLS# 12648974Listed by: JOHN GREENE, REALTOR  $359,900Pending5 beds 3 baths1,437 sq. ft.
2 Faro Court, Oswego, IL 60543
MLS# 12623055Listed by: EXP REALTY - YORKVILLE $349,900Pending3 beds 3 baths1,456 sq. ft.
604 Roosevelt Drive, Oswego, IL 60543
MLS# 12648517Listed by: CHARLES RUTENBERG REALTY OF IL $270,000Pending2 beds 3 baths1,288 sq. ft.
453 Newport Circle, Oswego, IL 60543
MLS# 12631864Listed by: KELLER WILLIAMS INFINITY $375,000Pending3 beds 2 baths1,430 sq. ft.
219 Wolverine Drive, Oswego, IL 60543
MLS# 12644090Listed by: KELLER WILLIAMS INNOVATE $599,711Pending4 beds 3 baths2,612 sq. ft.
711 Erwin Street, Oswego, IL 60543
MLS# 12645893Listed by: HOMESMART CONNECT LLC $379,990Pending3 beds 3 baths1,767 sq. ft.
229 Cooney Way, Oswego, IL 60543
MLS# 12645928Listed by: HOMESMART CONNECT LLC $429,900Active4 beds 3 baths2,000 sq. ft.
609 Plymouth Court, Oswego, IL 60543
MLS# 12643542Listed by: IHOME REAL ESTATE $390,991Pending3 beds 3 baths1,840 sq. ft.
231 Cooney Way, Oswego, IL 60543
MLS# 12644948Listed by: HOMESMART CONNECT LLC $499,990Pending4 beds 3 baths2,218 sq. ft.
345 Danforth Drive, Oswego, IL 60543
MLS# 12644575Listed by: HOMESMART CONNECT LLC $530,990Pending4 beds 3 baths2,362 sq. ft.
351 Danforth Drive, Oswego, IL 60543
MLS# 12644598Listed by: HOMESMART CONNECT LLC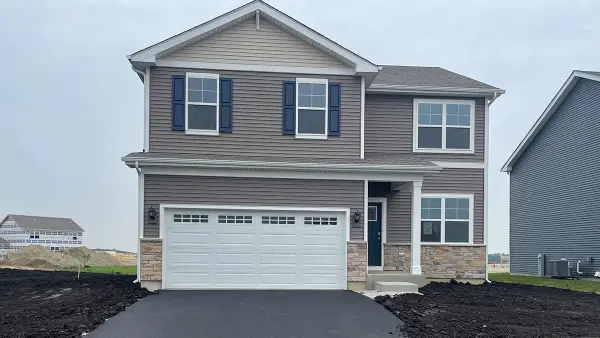 $484,990Pending4 beds 3 baths2,051 sq. ft.
1445 Vintage Drive, Oswego, IL 60543
MLS# 12644093Listed by: DAYNAE GAUDIO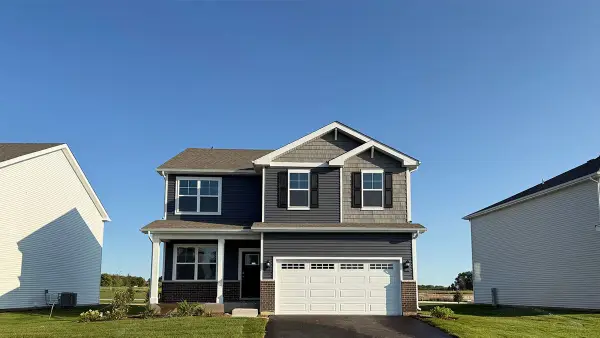 $514,990Active4 beds 3 baths2,051 sq. ft.
1490 Vintage Drive, Oswego, IL 60543
MLS# 12644100Listed by: DAYNAE GAUDIO $484,990Active4 beds 3 baths2,051 sq. ft.
2306 Hirsch Road, Oswego, IL 60543
MLS# 12644109Listed by: DAYNAE GAUDIO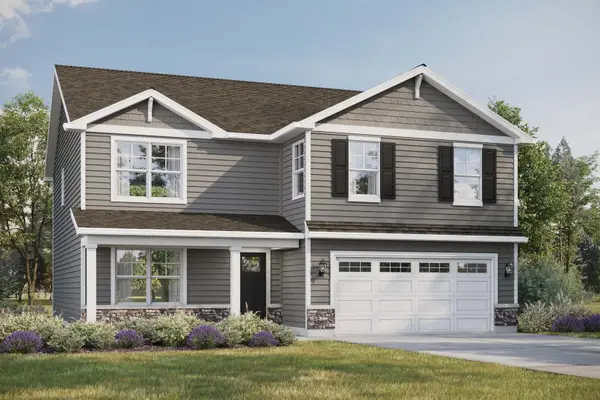 $539,990Active4 beds 3 baths2,600 sq. ft.
1449 Vintage Drive, Oswego, IL 60543
MLS# 12644184Listed by: DAYNAE GAUDIO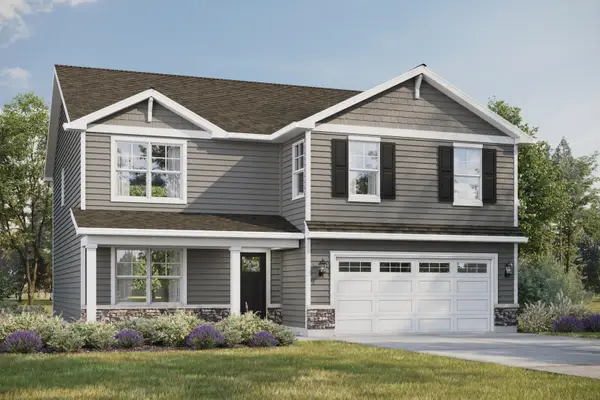 $549,990Active4 beds 3 baths2,600 sq. ft.
1482 Vintage Drive, Oswego, IL 60543
MLS# 12644233Listed by: DAYNAE GAUDIO- Open Fri, 10am to 5pm
 $579,990Active4 beds 3 baths2,836 sq. ft.
1444 Vintage Drive, Oswego, IL 60543
MLS# 12644245Listed by: DAYNAE GAUDIO 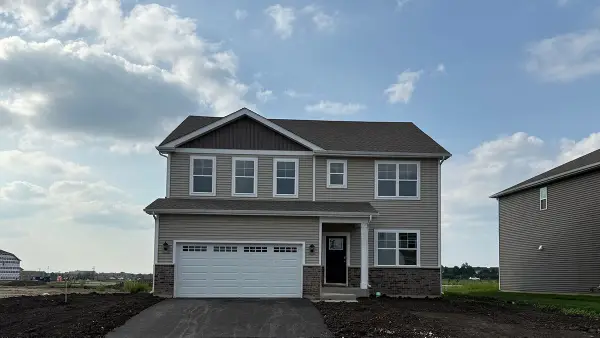 $589,990Active4 beds 3 baths2,836 sq. ft.
2302 Hirsch Road, Oswego, IL 60543
MLS# 12644277Listed by: DAYNAE GAUDIO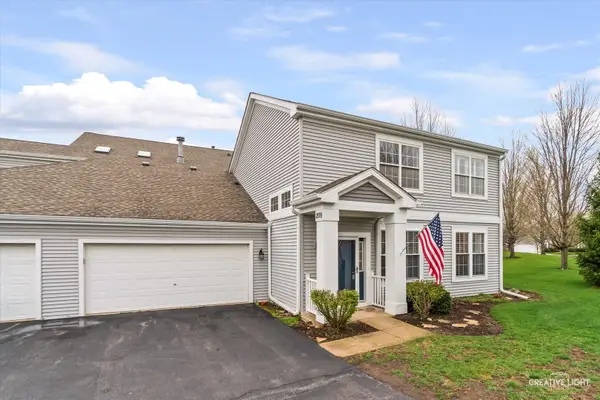 $280,000Active2 beds 3 baths1,576 sq. ft.
209 Grays Drive #209, Oswego, IL 60543
MLS# 12643532Listed by: CHARLES RUTENBERG REALTY OF IL $544,990Active4 beds 3 baths2,600 sq. ft.
2310 Hirsch Road, Oswego, IL 60543
MLS# 12641526Listed by: DAYNAE GAUDIO $649,990Pending5 beds 3 baths3,044 sq. ft.
1498 Vintage Drive, Oswego, IL 60543
MLS# 12641549Listed by: DAYNAE GAUDIO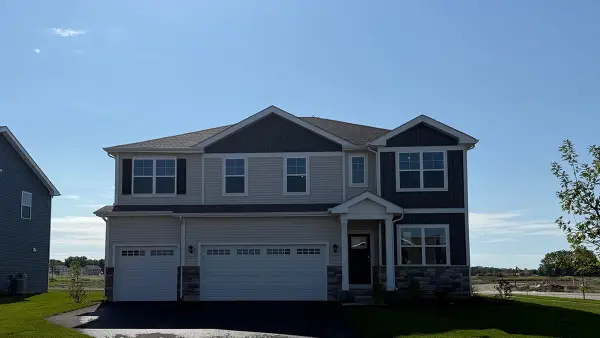 $649,990Pending5 beds 3 baths3,044 sq. ft.
2314 Hirsch Road, Oswego, IL 60543
MLS# 12641560Listed by: DAYNAE GAUDIO $452,990Active4 beds 3 baths1,953 sq. ft.
2411 Semillon Street, Oswego, IL 60543
MLS# 12641762Listed by: DAYNAE GAUDIO $479,990Active4 beds 3 baths1,953 sq. ft.
2416 Semillon Street, Oswego, IL 60543
MLS# 12641786Listed by: DAYNAE GAUDIO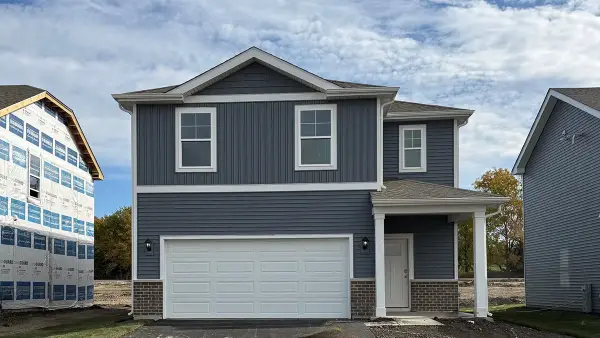 $474,990Active4 beds 3 baths1,953 sq. ft.
2412 Semillon Street, Oswego, IL 60543
MLS# 12641792Listed by: DAYNAE GAUDIO $410,000Active2 beds 2 baths1,837 sq. ft.
772 Bohannon Circle, Oswego, IL 60543
MLS# 12629257Listed by: BAIRD & WARNER $549,900Active4 beds 3 baths3,127 sq. ft.
301 Stoneleigh Lane, Oswego, IL 60543
MLS# 12622952Listed by: FATHOM REALTY IL LLC $465,000Active3 beds 2 baths2,037 sq. ft.
303 Owen Court, Oswego, IL 60543
MLS# 12638191Listed by: ALEXANDER & ASSOCIATES REALTY GROUP $700,000Active1.88 Acres
25501 W Wolfs Crossing Road, Plainfield, IL 60585
MLS# 12638444Listed by: BAIRD & WARNER $275,000Pending3 beds 1 baths1,120 sq. ft.
64 E Benton Street, Oswego, IL 60543
MLS# 12631361Listed by: YOUR PLACE REALTY GROUP $339,900Pending3 beds 3 baths1,543 sq. ft.
2255 Riesling Road, Oswego, IL 60543
MLS# 12642178Listed by: MICHELLE SATHER REALTOR $570,000Active4 beds 4 baths2,803 sq. ft.
328 Ash Grove Lane, Oswego, IL 60543
MLS# 12635589Listed by: REDFIN CORPORATION $440,000Pending3 beds 4 baths1,817 sq. ft.
721 Churchill Lane, Oswego, IL 60543
MLS# 12628153Listed by: JOHN GREENE, REALTOR $500,000Active3 beds 2 baths1,950 sq. ft.
8 Hawthorne Drive, Oswego, IL 60543
MLS# 12608060Listed by: MCCOLLY ROSENBOOM $440,000Pending4 beds 3 baths2,223 sq. ft.
240 Paradise Parkway, Oswego, IL 60543
MLS# 12631544Listed by: BAIRD & WARNER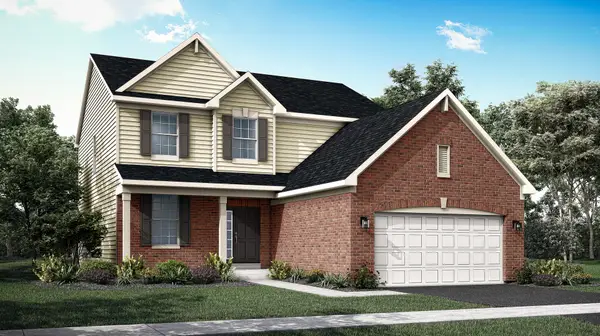 $559,526Active4 beds 3 baths2,448 sq. ft.
713 Erwin Street, Oswego, IL 60543
MLS# 12640362Listed by: HOMESMART CONNECT LLC $374,990Active3 beds 3 baths1,543 sq. ft.
2234 Bodega Road, Oswego, IL 60543
MLS# 12640588Listed by: DAYNAE GAUDIO $379,990Active3 beds 3 baths1,543 sq. ft.
2242 Bodega Road, Oswego, IL 60543
MLS# 12640594Listed by: DAYNAE GAUDIO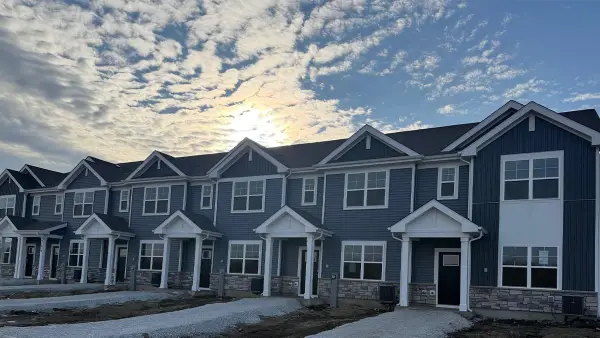 $379,990Active3 beds 3 baths1,543 sq. ft.
2249 Barbera Drive, Oswego, IL 60543
MLS# 12640602Listed by: DAYNAE GAUDIO $424,990Pending3 beds 3 baths1,663 sq. ft.
2437 Semillon Street, Oswego, IL 60543
MLS# 12640609Listed by: DAYNAE GAUDIO- Open Sat, 11am to 1pm
 $449,900Active3 beds 3 baths2,360 sq. ft.
615 Paris Avenue, Oswego, IL 60543
MLS# 12634663Listed by: @PROPERTIES CHRISTIE'S INTERNATIONAL REAL ESTATE  $454,990Pending4 beds 3 baths1,953 sq. ft.
2433 Semillon Street, Oswego, IL 60543
MLS# 12639829Listed by: DAYNAE GAUDIO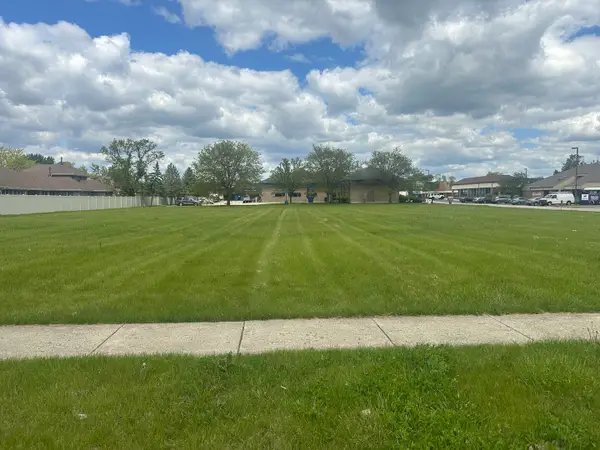 $400,000Active1 Acres
99 W Merchants Drive, Oswego, IL 60543
MLS# 12636761Listed by: BAIRD & WARNER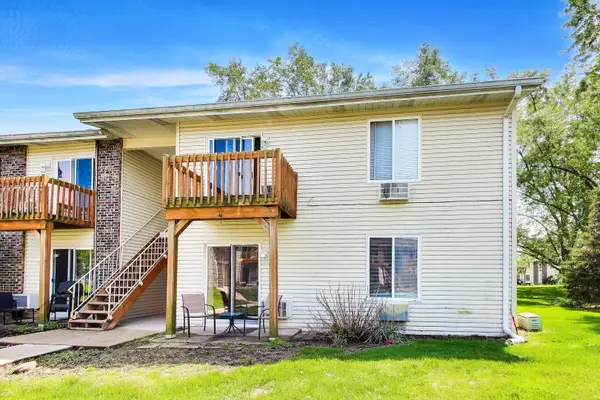 $179,900Pending2 beds 1 baths825 sq. ft.
2400 Light Road #112, Oswego, IL 60543
MLS# 12631480Listed by: COMPASS $99,000Active0.75 Acres
17 E Lyncliff Drive, Oswego, IL 60543
MLS# 12636996Listed by: BERKSHIRE HATHAWAY HOMESERVICES AMERICAN HERITAGE- Open Sun, 2 to 4pm
 $400,000Active2 beds 2 baths1,570 sq. ft.
574 Sudbury Circle, Oswego, IL 60543
MLS# 12637659Listed by: JOHN GREENE, REALTOR  $625,000Pending4 beds 3 baths3,287 sq. ft.
426 Heatherwood Drive Se, Oswego, IL 60543
MLS# 12637317Listed by: OPENDOOR BROKERAGE, LLC $489,400Active4 beds 3 baths2,862 sq. ft.
370 Hemlock Lane, Oswego, IL 60543
MLS# 12637593Listed by: JOHN GREENE REALTOR $450,000Pending4 beds 4 baths
115 Harbor Drive, Oswego, IL 60543
MLS# 12635659Listed by: @PROPERTIES CHRISTIE'S INTERNATIONAL REAL ESTATE $509,900Pending4 beds 3 baths2,837 sq. ft.
703 Fairfield Drive, Oswego, IL 60543
MLS# 12632659Listed by: GENERATION HOME PRO $265,000Pending2 beds 2 baths1,472 sq. ft.
281 Springbrook Trail S, Oswego, IL 60543
MLS# 12631218Listed by: JOHN GREENE, REALTOR $374,990Active3 beds 3 baths1,543 sq. ft.
2241 Barbera Drive, Oswego, IL 60543
MLS# 12635588Listed by: DAYNAE GAUDIO $615,000Pending5 beds 3 baths2,955 sq. ft.
516 Fridley Avenue, Oswego, IL 60543
MLS# 12635458Listed by: HOMESMART CONNECT LLC $749,999Active4 beds 4 baths3,300 sq. ft.
5525 Bluestem Court, Oswego, IL 60543
MLS# 12627024Listed by: BAIRD & WARNER $630,000Active3 beds 3 baths3,561 sq. ft.
2110 A-B State Route 31 Route, Oswego, IL 60543
MLS# 12634234Listed by: SWANSON REAL ESTATE $440,000Pending5 beds 3 baths2,560 sq. ft.
628 Manhattan Circle, Oswego, IL 60543
MLS# 12627874Listed by: COLDWELL BANKER REALTY $475,000Pending2 beds 2 baths1,624 sq. ft.
3235 Sweetgrass Circle, Aurora, IL 60503
MLS# 12630428Listed by: REDFIN CORPORATION $409,000Pending4 beds 3 baths2,200 sq. ft.
112 Seton Creek Drive, Oswego, IL 60543
MLS# 12632804Listed by: CENTURY 21 INTEGRA $300,000Pending3 beds 2 baths1,493 sq. ft.
586 Chestnut Drive, Oswego, IL 60543
MLS# 12632530Listed by: KELLER WILLIAMS INFINITY $285,000Pending3 beds 2 baths1,501 sq. ft.
241 W Washington Street, Oswego, IL 60543
MLS# 12628534Listed by: EXP REALTY $489,990Pending4 beds 3 baths2,387 sq. ft.
377 Danforth Drive, Oswego, IL 60543
MLS# 12630328Listed by: HOMESMART CONNECT LLC $350,000Pending4 beds 3 baths2,023 sq. ft.
99 Seton Creek Drive, Oswego, IL 60543
MLS# 12618776Listed by: REAL PEOPLE REALTY $399,990Pending3 beds 3 baths1,717 sq. ft.
225 Cooney Way, Oswego, IL 60543
MLS# 12631166Listed by: HOMESMART CONNECT LLC $1,499,000Active5 beds 4 baths4,800 sq. ft.
1502 Cherry Road, Oswego, IL 60543
MLS# 12526887Listed by: GENERATION HOME PRO $335,000Pending3 beds 3 baths1,400 sq. ft.
36 Bridgeview Drive, Oswego, IL 60543
MLS# 12628789Listed by: REAL BROKER LLC $381,990Active3 beds 3 baths1,543 sq. ft.
2256 Bodega Drive, Oswego, IL 60543
MLS# 12628856Listed by: DAYNAE GAUDIO $334,990Pending3 beds 3 baths1,543 sq. ft.
2254 Bodega Drive, Oswego, IL 60543
MLS# 12628875Listed by: DAYNAE GAUDIO $342,990Pending3 beds 3 baths1,543 sq. ft.
2252 Bodega Road, Oswego, IL 60543
MLS# 12628892Listed by: DAYNAE GAUDIO $381,990Active3 beds 3 baths1,543 sq. ft.
2250 Bodega Drive, Oswego, IL 60543
MLS# 12628900Listed by: DAYNAE GAUDIO $325,000Pending3 beds 3 baths1,545 sq. ft.
558 Lincoln Station Drive #558, Oswego, IL 60543
MLS# 12628572Listed by: COLDWELL BANKER REALTY $450,000Pending4 beds 3 baths2,285 sq. ft.
208 Long Meadow Court, Oswego, IL 60543
MLS# 12625787Listed by: BAIRD & WARNER $605,000Pending5 beds 3 baths2,955 sq. ft.
702 Erwin Street, Oswego, IL 60543
MLS# 12627383Listed by: HOMESMART CONNECT LLC $575,000Pending5 beds 4 baths3,078 sq. ft.
545 Arbor Lane, Oswego, IL 60543
MLS# 12620470Listed by: COLDWELL BANKER REAL ESTATE GROUP $569,990Active4 beds 3 baths2,600 sq. ft.
1436 Vintage Drive, Oswego, IL 60543
MLS# 12626809Listed by: DAYNAE GAUDIO $450,000Active4 beds 3 baths2,687 sq. ft.
542 Waterford Drive, Oswego, IL 60543
MLS# 12625634Listed by: ONE SOURCE REALTY $509,541Active3 beds 3 baths2,163 sq. ft.
603 Murdock Place, Oswego, IL 60543
MLS# 12626601Listed by: HOMESMART CONNECT LLC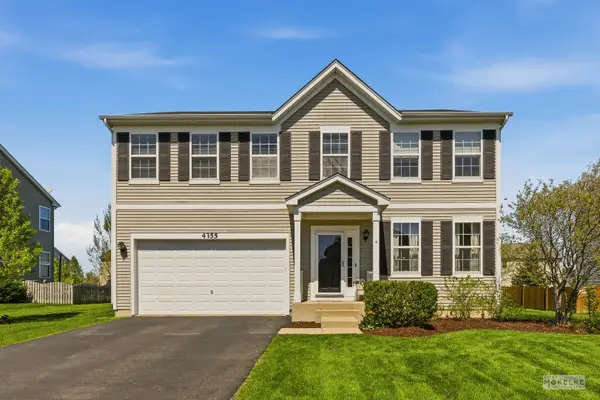 $454,900Active4 beds 3 baths2,688 sq. ft.
4355 Schofield Drive, Oswego, IL 60543
MLS# 12620410Listed by: COLDWELL BANKER REAL ESTATE GROUP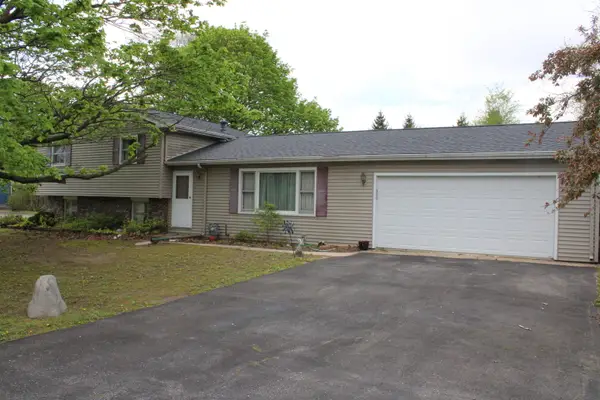 $335,000Pending3 beds 2 baths1,780 sq. ft.
15 W Rickard Drive, Oswego, IL 60543
MLS# 12625775Listed by: KETTLEY & CO. INC. - SANDWICH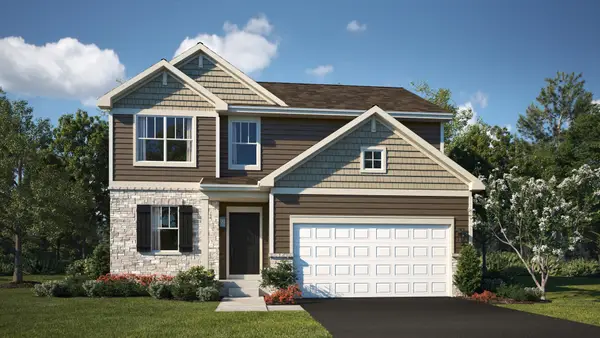 $489,990Active3 beds 3 baths2,074 sq. ft.
391 Danforth Drive, Oswego, IL 60543
MLS# 12624903Listed by: HOMESMART CONNECT LLC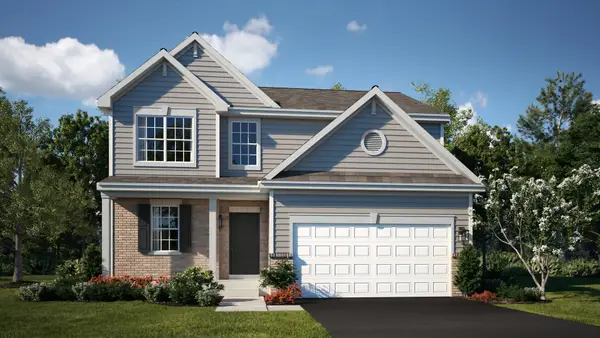 $513,990Active3 beds 3 baths2,063 sq. ft.
397 Danforth Drive, Oswego, IL 60543
MLS# 12624917Listed by: HOMESMART CONNECT LLC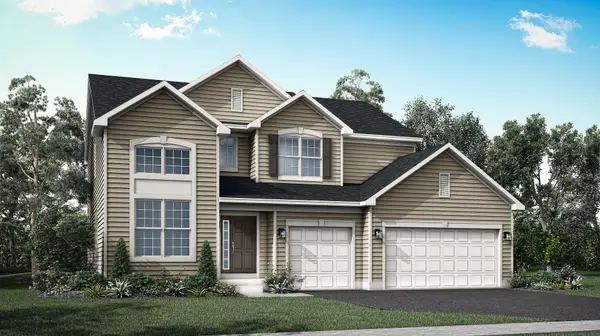 $609,486Pending4 beds 3 baths2,907 sq. ft.
709 Erwin Street, Oswego, IL 60543
MLS# 12624087Listed by: HOMESMART CONNECT LLC $345,000Pending3 beds 3 baths2,112 sq. ft.
407 Bluegrass Parkway, Oswego, IL 60543
MLS# 12622245Listed by: AYERS REALTY GROUP $619,900Pending4 beds 3 baths3,959 sq. ft.
Address Withheld By Seller, Oswego, IL 60543
MLS# 12616221Listed by: MICHELLE SATHER REALTOR $379,900Active3 beds 3 baths2,376 sq. ft.
231 Lakeshore Drive, Oswego, IL 60543
MLS# 12622512Listed by: MICHELLE SATHER REALTOR $393,999Active3 beds 4 baths1,994 sq. ft.
186 River Mist Drive, Oswego, IL 60543
MLS# 12599739Listed by: KELLER WILLIAMS INFINITY $438,000Active5 beds 3 baths2,378 sq. ft.
123 Eisenhower Drive, Oswego, IL 60543
MLS# 12621935Listed by: CIRCLE ONE REALTY $445,000Pending3 beds 3 baths2,133 sq. ft.
122 Cinderford Court, Oswego, IL 60543
MLS# 12599844Listed by: VILLAGE REALTY, INC. $1,480,000Active5 beds 5 baths5,072 sq. ft.
4720 Waa Kee Sha Drive, Oswego, IL 60543
MLS# 12595560Listed by: COLDWELL BANKER REAL ESTATE GROUP $379,900Pending2 beds 2 baths2,153 sq. ft.
739 Bohannon Circle, Oswego, IL 60543
MLS# 12621471Listed by: J.W. REEDY REALTY $579,000Pending4 beds 3 baths3,313 sq. ft.
232 Loradale Road, Oswego, IL 60543
MLS# 12621011Listed by: AYERS REALTY GROUP $639,900Active4 beds 3 baths3,500 sq. ft.
143 Pineridge Drive S, Oswego, IL 60543
MLS# 12621034Listed by: REDFIN CORPORATION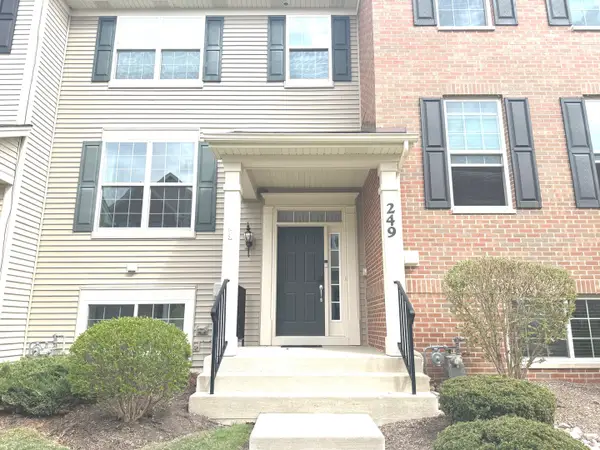 $304,990Active2 beds 3 baths1,495 sq. ft.
249 Lakeshore Drive, Oswego, IL 60543
MLS# 12619561Listed by: GUIDANCE REALTY $536,860Pending4 beds 3 baths2,567 sq. ft.
137 Daltrey Drive, Oswego, IL 60543
MLS# 12619352Listed by: TWIN VINES REAL ESTATE SVCS $549,990Pending4 beds 3 baths2,470 sq. ft.
741 Fairfield Drive, Oswego, IL 60543
MLS# 12619203Listed by: LITTLE REALTY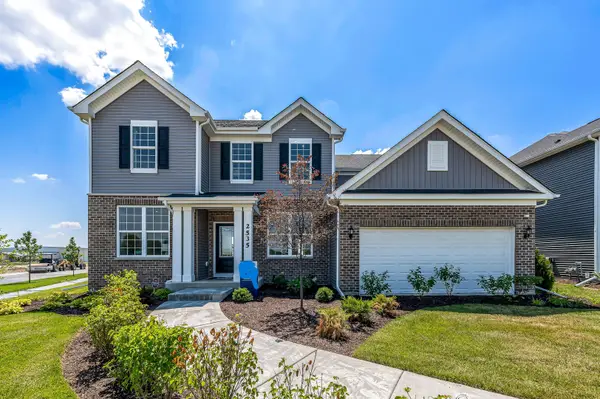 $676,000Active4 beds 3 baths3,031 sq. ft.
3237 Peyton Circle, Aurora, IL 60503
MLS# 12618906Listed by: TWIN VINES REAL ESTATE SVCS $554,790Pending4 beds 3 baths2,387 sq. ft.
347 Danforth Drive, Oswego, IL 60543
MLS# 12618536Listed by: HOMESMART CONNECT LLC $456,990Pending4 beds 3 baths1,953 sq. ft.
2449 Semillon Street, Oswego, IL 60543
MLS# 12618446Listed by: DAYNAE GAUDIO $449,990Pending4 beds 3 baths1,953 sq. ft.
2461 W Semillon Street, Oswego, IL 60543
MLS# 12616771Listed by: DAYNAE GAUDIO $220,000Active2 beds 1 baths
356 Ogden Falls Boulevard #356, Oswego, IL 60543
MLS# 12585168Listed by: BAIRD & WARNER $389,900Pending2 beds 3 baths1,828 sq. ft.
106 River Run Court, Oswego, IL 60543
MLS# 12615418Listed by: COLDWELL BANKER REAL ESTATE GROUP $1,250,000Pending4 beds 5 baths4,490 sq. ft.
Address Withheld By Seller, Oswego, IL 60543
MLS# 12573040Listed by: RE/MAX OF NAPERVILLE $559,900Pending4 beds 3 baths3,098 sq. ft.
300 Winthrop Drive, Oswego, IL 60543
MLS# 12611371Listed by: XHOMES REALTY INC $429,900Active5 beds 3 baths3,716 sq. ft.
206 Washington Street, Oswego, IL 60543
MLS# 12613328Listed by: M K LANE REALTY, LLC $570,000Pending4 beds 3 baths2,612 sq. ft.
714 Erwin Street, Oswego, IL 60543
MLS# 12606953Listed by: HOMESMART CONNECT LLC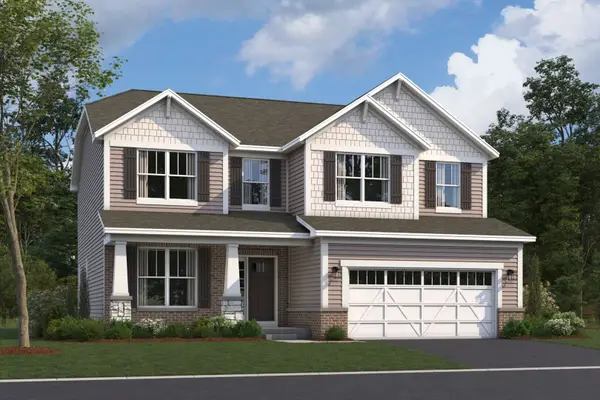 $617,160Pending4 beds 3 baths2,732 sq. ft.
405 Tanya Lane, Oswego, IL 60543
MLS# 12605539Listed by: LITTLE REALTY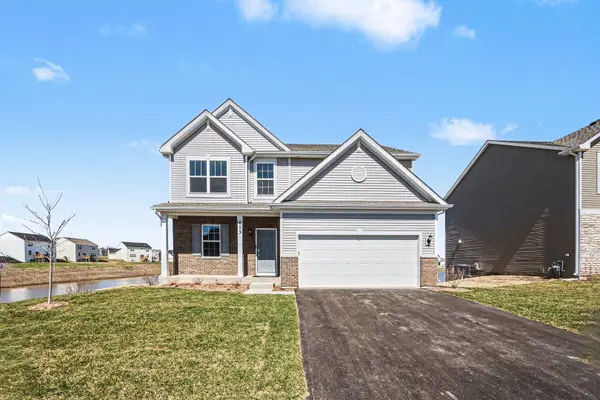 $450,000Pending3 beds 3 baths2,063 sq. ft.
413 Hathaway Lane, Oswego, IL 60543
MLS# 12598683Listed by: CENTURY 21 INTEGRA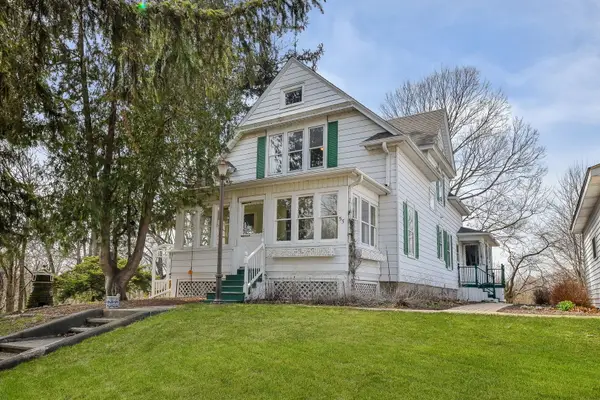 $514,999Pending4 beds 3 baths2,268 sq. ft.
55 N Madison Street, Oswego, IL 60543
MLS# 12601720Listed by: KELLER WILLIAMS INFINITY $465,000Pending4 beds 3 baths2,533 sq. ft.
223 Ashcroft Lane, Oswego, IL 60543
MLS# 12594121Listed by: BAIRD & WARNER $479,990Pending3 beds 3 baths2,063 sq. ft.
385 Danforth Drive, Oswego, IL 60543
MLS# 12602878Listed by: HOMESMART CONNECT LLC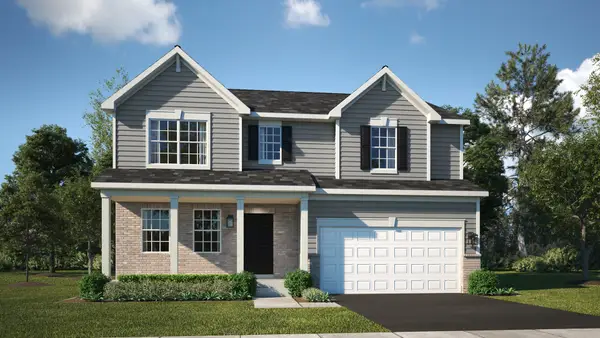 $533,990Pending4 beds 3 baths2,387 sq. ft.
339 Danforth Drive, Oswego, IL 60543
MLS# 12602896Listed by: HOMESMART CONNECT LLC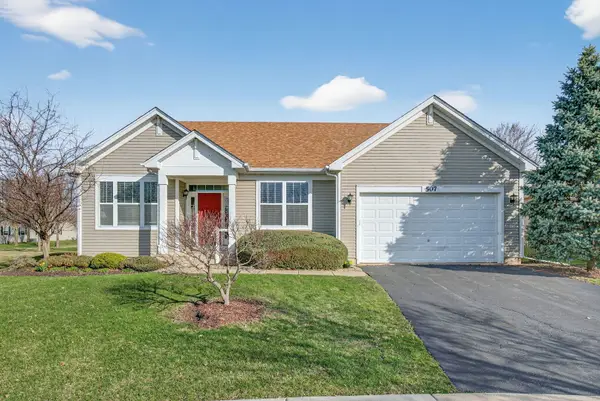 $399,900Active2 beds 2 baths2,203 sq. ft.
507 Homeview Drive, Oswego, IL 60543
MLS# 12601127Listed by: HOMESMART REALTY GROUP $75,000Pending0.9 Acres
7256 Roberts Drive, Oswego, IL 60543
MLS# 12600209Listed by: RE/MAX OF NAPERVILLE $75,000Pending0.73 Acres
7370 Roberts Drive, Oswego, IL 60543
MLS# 12600141Listed by: RE/MAX OF NAPERVILLE $490,000Pending4 beds 3 baths2,386 sq. ft.
353 Danforth Drive, Oswego, IL 60543
MLS# 12599154Listed by: HOMESMART CONNECT LLC $334,990Pending3 beds 3 baths1,543 sq. ft.
2253 Barbera Road, Oswego, IL 60543
MLS# 12594705Listed by: DAYNAE GAUDIO $379,990Active3 beds 3 baths1,543 sq. ft.
2255 Barbera Drive, Oswego, IL 60543
MLS# 12594736Listed by: DAYNAE GAUDIO $324,990Pending3 beds 3 baths1,543 sq. ft.
2251 Barbera Drive, Oswego, IL 60543
MLS# 12596680Listed by: DAYNAE GAUDIO $498,825Pending4 beds 4 baths2,092 sq. ft.
138 Daltrey Drive, Oswego, IL 60543
MLS# 12596554Listed by: TWIN VINES REAL ESTATE SVCS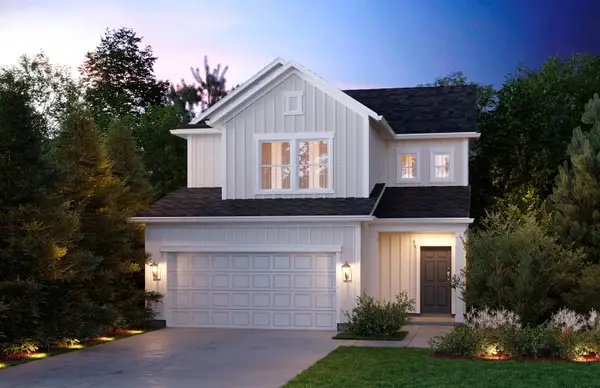 $456,748Pending3 beds 3 baths1,700 sq. ft.
141 Daltrey Drive, Oswego, IL 60543
MLS# 12596611Listed by: TWIN VINES REAL ESTATE SVCS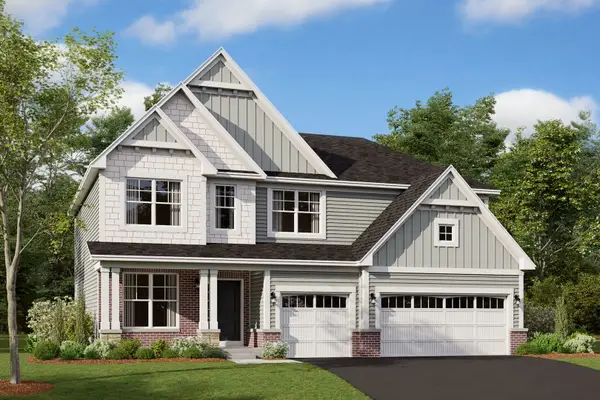 $619,990Pending4 beds 3 baths2,872 sq. ft.
205 Piper Glen Avenue, Oswego, IL 60543
MLS# 12594782Listed by: LITTLE REALTY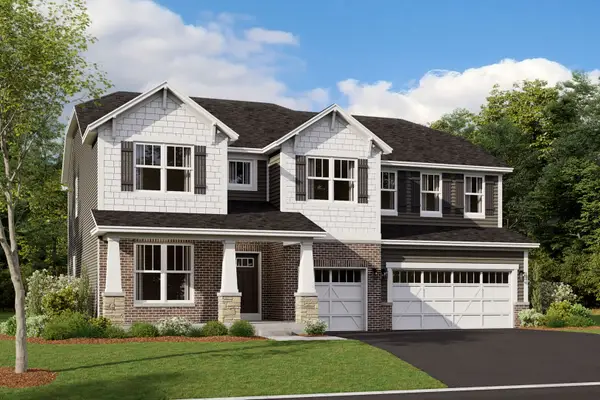 $641,400Pending4 beds 3 baths3,145 sq. ft.
438 Tanya Lane, Oswego, IL 60543
MLS# 12593657Listed by: LITTLE REALTY $70,000Active0.73 Acres
4541 Waa-kee-sha Drive, Oswego, IL 60543
MLS# 12591852Listed by: CIRCLE ONE REALTY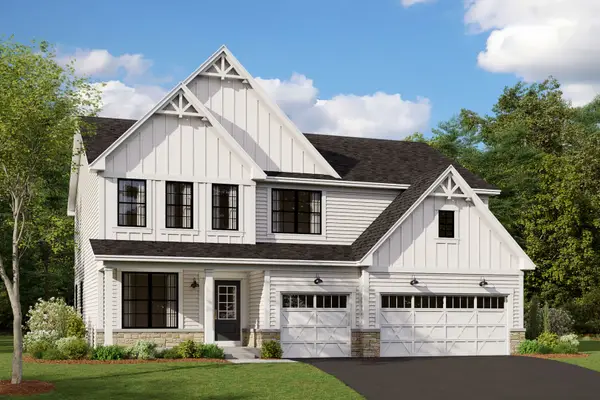 $619,990Pending4 beds 3 baths2,872 sq. ft.
203 Piper Glen Avenue, Oswego, IL 60543
MLS# 12588674Listed by: LITTLE REALTY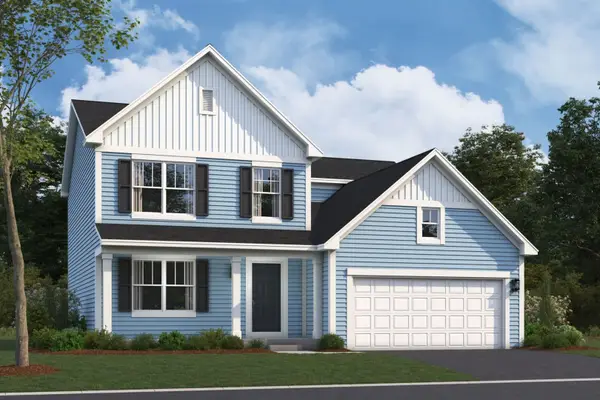 $499,990Pending4 beds 3 baths2,437 sq. ft.
317 Monica Lane, Oswego, IL 60543
MLS# 12588570Listed by: LITTLE REALTY $479,990Pending4 beds 3 baths2,157 sq. ft.
138 Piper Glen Avenue, Oswego, IL 60543
MLS# 12588606Listed by: LITTLE REALTY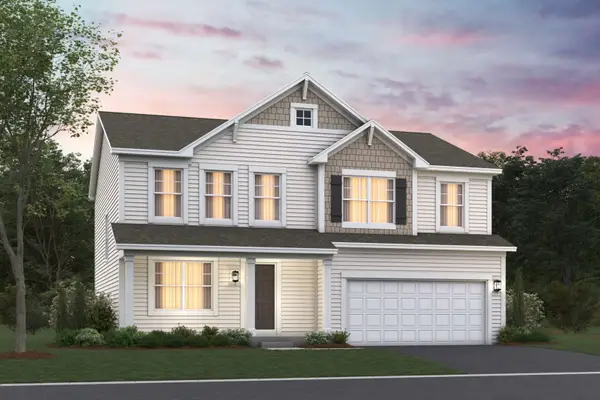 $489,990Pending4 beds 3 baths2,289 sq. ft.
136 Piper Glen Avenue, Oswego, IL 60543
MLS# 12588641Listed by: LITTLE REALTY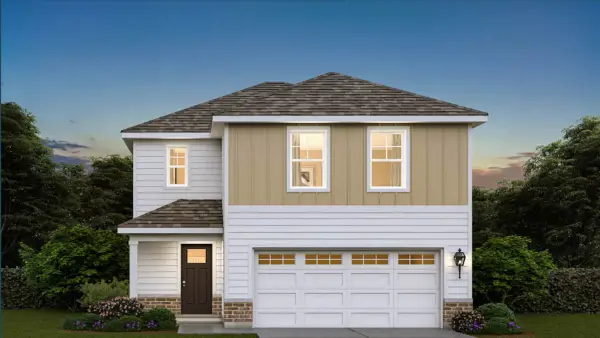 $420,990Pending3 beds 3 baths1,561 sq. ft.
2420 Semillon Street, Oswego, IL 60543
MLS# 12585435Listed by: DAYNAE GAUDIO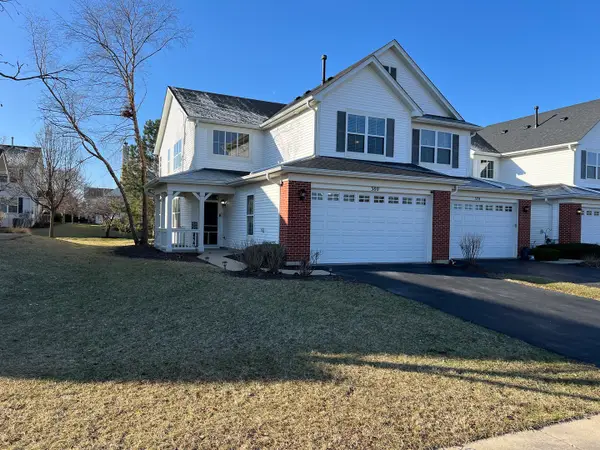 $319,900Active2 beds 3 baths1,925 sq. ft.
380 Risen Star Lane #380, Oswego, IL 60543
MLS# 12587531Listed by: CENTURY 21 CIRCLE - AURORA $395,990Pending3 beds 3 baths1,561 sq. ft.
2413 Semillon Street, Oswego, IL 60543
MLS# 12585351Listed by: DAYNAE GAUDIO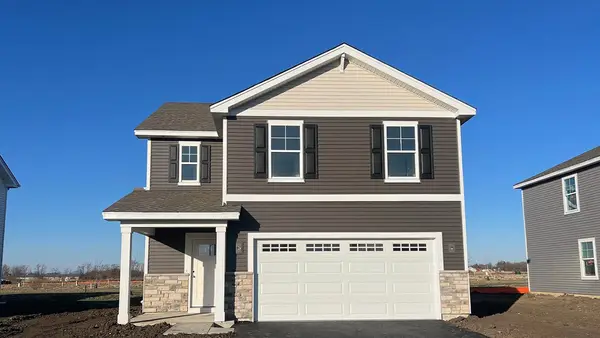 $449,990Pending4 beds 3 baths1,953 sq. ft.
2482 Semillon Street, Oswego, IL 60543
MLS# 12586825Listed by: DAYNAE GAUDIO $875,000Pending4 beds 3 baths3,300 sq. ft.
1813 Winchester Court, Oswego, IL 60543
MLS# 12558829Listed by: JOHN GREENE, REALTOR $575,000Pending4 beds 3 baths2,222 sq. ft.
204 Amherst Circle, Oswego, IL 60543
MLS# 12577346Listed by: JOHN GREENE, REALTOR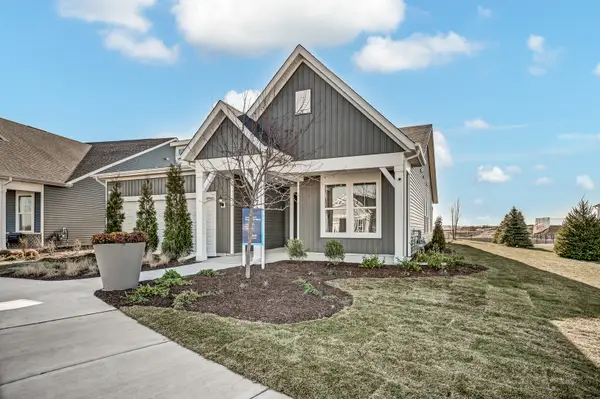 $657,221Pending3 beds 3 baths2,783 sq. ft.
3243 Kimblewick Circle, Aurora, IL 60503
MLS# 12584310Listed by: TWIN VINES REAL ESTATE SVCS $475,000Pending2 beds 2 baths1,933 sq. ft.
836 Colchester Drive, Oswego, IL 60543
MLS# 12565792Listed by: COLDWELL BANKER REAL ESTATE GROUP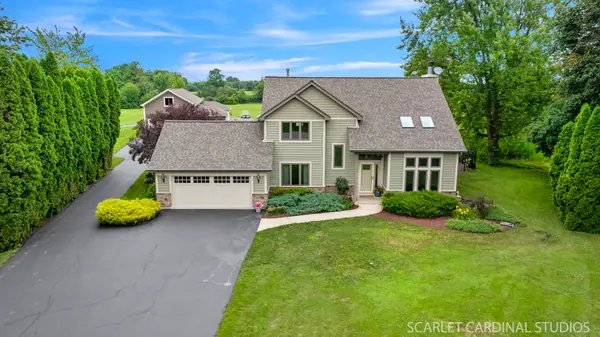 $1,200,000Pending3 beds 4 baths2,286 sq. ft.
59 Burkhart Drive, Oswego, IL 60543
MLS# 12580756Listed by: JOHN GREENE, REALTOR $475,000Pending5 beds 3 baths2,840 sq. ft.
711 Blossom Court, Oswego, IL 60543
MLS# 12571396Listed by: YOUR PLACE REALTY GROUP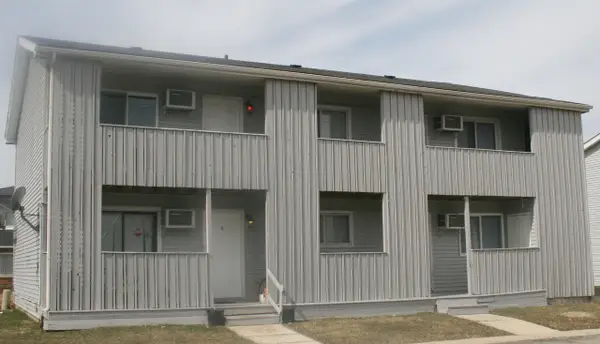 $425,000Pending4 beds 4 baths
115 Harbor Drive, Oswego, IL 60543
MLS# 12576681Listed by: @PROPERTIES CHRISTIE'S INTERNATIONAL REAL ESTATE $332,990Pending3 beds 3 baths1,543 sq. ft.
2238 Bodega Road, Oswego, IL 60543
MLS# 12577934Listed by: DAYNAE GAUDIO $78,000Active0 Acres
201 E Angela Circle, Lexington, IL 61753
MLS# 12568803Listed by: KELLER WILLIAMS REVOLUTION $88,000Active0 Acres
202 E Angela Circle, Lexington, IL 61753
MLS# 12569306Listed by: KELLER WILLIAMS REVOLUTION $88,000Active0 Acres
201 W Angela Circle, Lexington, IL 61753
MLS# 12569310Listed by: KELLER WILLIAMS REVOLUTION $78,000Active0 Acres
202 W Angela Circle, Lexington, IL 61753
MLS# 12569319Listed by: KELLER WILLIAMS REVOLUTION $343,990Pending3 beds 3 baths1,543 sq. ft.
2240 Bodega Road, Oswego, IL 60543
MLS# 12577908Listed by: DAYNAE GAUDIO $620,990Active4 beds 3 baths2,836 sq. ft.
1494 Vintage Drive, Oswego, IL 60543
MLS# 12577897Listed by: DAYNAE GAUDIO $520,814Pending4 beds 3 baths2,421 sq. ft.
134 Daltrey Drive, Oswego, IL 60543
MLS# 12579070Listed by: TWIN VINES REAL ESTATE SVCS $597,459Pending3 beds 3 baths2,567 sq. ft.
130 West Harvest Court, Oswego, IL 60543
MLS# 12579093Listed by: TWIN VINES REAL ESTATE SVCS $1,250,000Active-- beds -- baths
1300 Orchard Road, Oswego, IL 60543
MLS# 12538979Listed by: WXR & ASSOCIATES, LTD $330,000Pending3 beds 2 baths1,597 sq. ft.
552 Lincoln Station Drive, Oswego, IL 60543
MLS# 12563535Listed by: DAMON D PERRY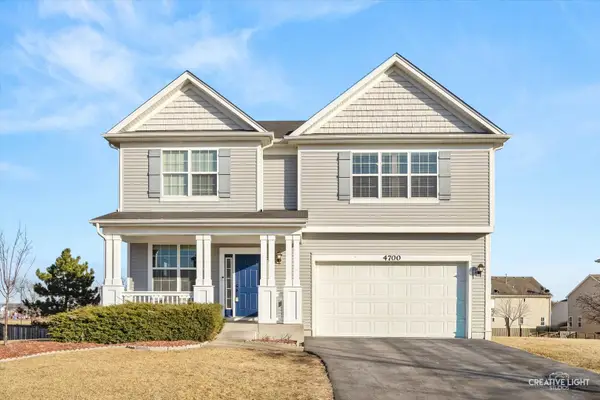 $405,000Pending4 beds 3 baths2,310 sq. ft.
4700 Laughton Avenue, Oswego, IL 60543
MLS# 12563149Listed by: EXP REALTY $520,000Pending4 beds 3 baths2,386 sq. ft.
343 Danforth Lane, Oswego, IL 60543
MLS# 12572079Listed by: HOMESMART CONNECT LLC $649,990Pending5 beds 3 baths3,044 sq. ft.
1440 Vintage Drive, Oswego, IL 60543
MLS# 12564530Listed by: DAYNAE GAUDIO $649,990Active5 beds 3 baths3,044 sq. ft.
1486 Vintage Drive, Oswego, IL 60543
MLS# 12564551Listed by: DAYNAE GAUDIO $894,900Pending4 beds 4 baths4,130 sq. ft.
51 Crestview Drive, Oswego, IL 60543
MLS# 12551303Listed by: UNITED REAL ESTATE-CHICAGO $449,990Active4 beds 3 baths1,953 sq. ft.
2417 Semillon Street, Oswego, IL 60543
MLS# 12564331Listed by: DAYNAE GAUDIO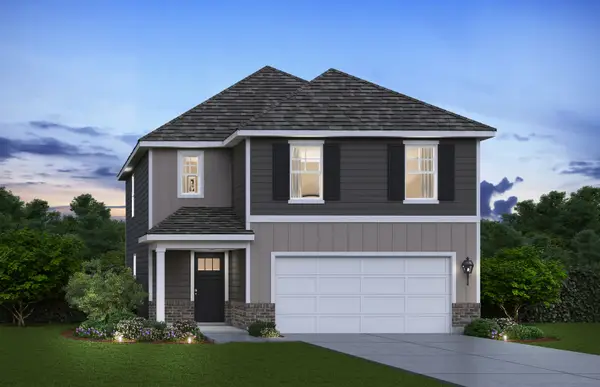 $444,990Pending4 beds 3 baths1,953 sq. ft.
2441 Semillon Street, Oswego, IL 60543
MLS# 12564409Listed by: DAYNAE GAUDIO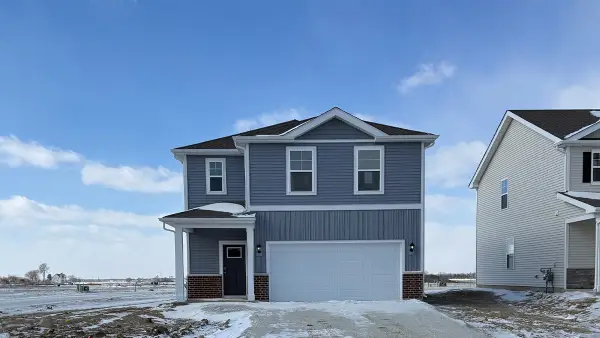 $424,990Pending3 beds 3 baths1,663 sq. ft.
2421 Semillon Street, Oswego, IL 60543
MLS# 12564363Listed by: DAYNAE GAUDIO $389,990Pending3 beds 3 baths1,561 sq. ft.
2445 Semillon Street, Oswego, IL 60543
MLS# 12564416Listed by: DAYNAE GAUDIO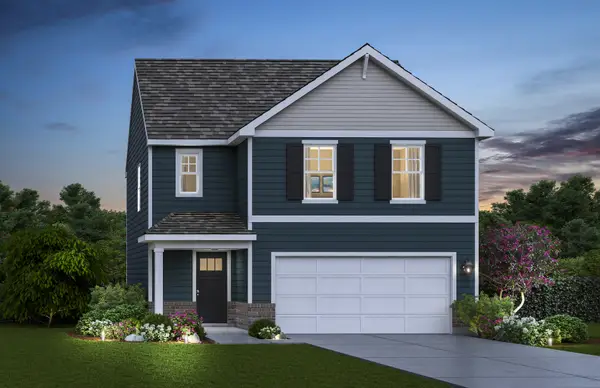 $429,990Active3 beds 3 baths1,663 sq. ft.
2428 Semillon Street, Oswego, IL 60543
MLS# 12564434Listed by: DAYNAE GAUDIO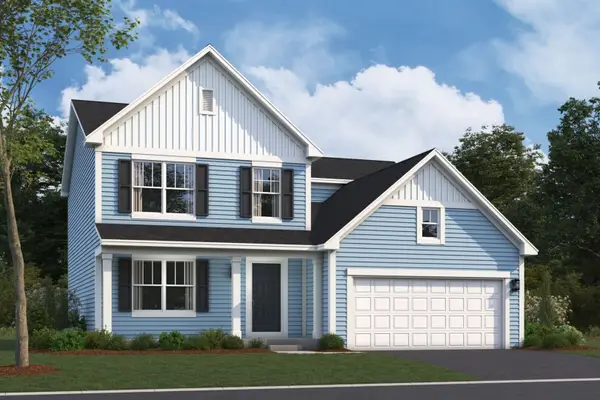 $489,990Pending4 beds 3 baths2,437 sq. ft.
226 Piper Glen Avenue, Oswego, IL 60543
MLS# 12563744Listed by: LITTLE REALTY $341,990Pending3 beds 3 baths1,543 sq. ft.
2239 Barbera Drive, Oswego, IL 60543
MLS# 12556214Listed by: DAYNAE GAUDIO $341,990Pending3 beds 3 baths1,543 sq. ft.
2237 Barbera Drive, Oswego, IL 60543
MLS# 12556208Listed by: DAYNAE GAUDIO $385,990Pending3 beds 3 baths1,561 sq. ft.
2457 Semillon Street, Oswego, IL 60543
MLS# 12555674Listed by: DAYNAE GAUDIO $456,990Pending4 beds 3 baths1,953 sq. ft.
2453 Semillon Street, Oswego, IL 60543
MLS# 12555680Listed by: DAYNAE GAUDIO $374,990Pending3 beds 3 baths1,543 sq. ft.
2233 Barbera Drive, Oswego, IL 60543
MLS# 12556197Listed by: DAYNAE GAUDIO $329,990Pending3 beds 3 baths1,543 sq. ft.
2235 Barbera Drive, Oswego, IL 60543
MLS# 12556245Listed by: DAYNAE GAUDIO $472,990Pending4 beds 3 baths2,203 sq. ft.
375 Danforth Drive, Oswego, IL 60543
MLS# 12556204Listed by: HOMESMART CONNECT LLC $364,900Active4 beds 4 baths2,149 sq. ft.
133 River Mist Drive, Oswego, IL 60543
MLS# 12554682Listed by: ONLINE BROKERS INC.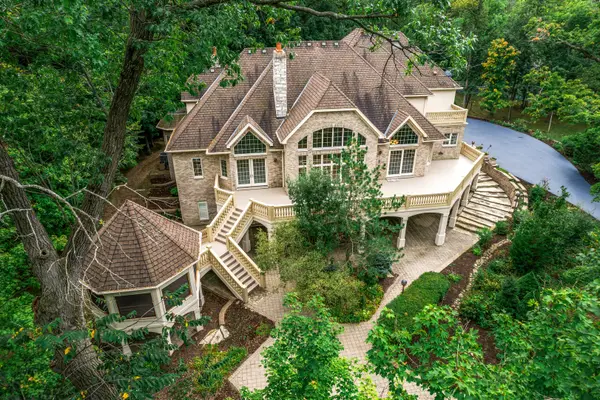 $1,385,000Active5 beds 7 baths7,891 sq. ft.
53 Abbeyfeale Drive, Oswego, IL 60543
MLS# 12540088Listed by: CENTURY 21 INTEGRA $350,000Pending5 beds 4 baths2,132 sq. ft.
109 Old Post Road, Oswego, IL 60543
MLS# 12537025Listed by: BERKSHIRE HATHAWAY HOMESERVICES CHICAGO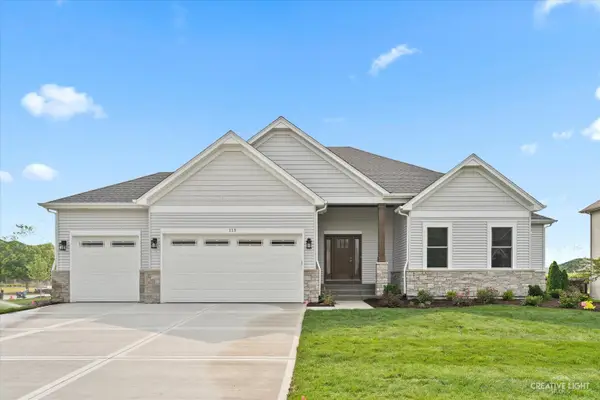 $916,450Pending3 beds 3 baths2,300 sq. ft.
875 Claridge Drive, Oswego, IL 60543
MLS# 12536518Listed by: LPT REALTY $80,000Active0.76 Acres
7400 Roberts Drive, Oswego, IL 60543
MLS# 12536414Listed by: JOHN GREENE, REALTOR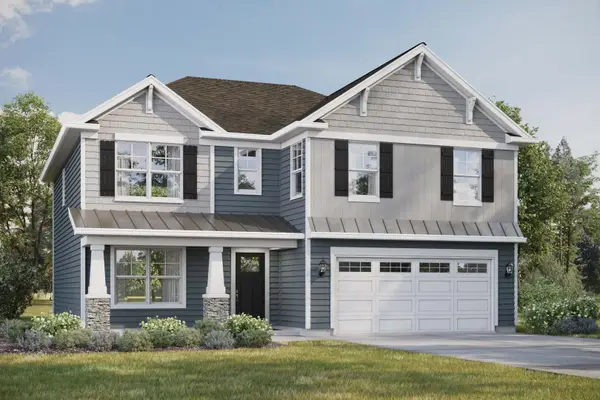 $546,990Pending4 beds 3 baths2,600 sq. ft.
1455 Vintage Drive, Oswego, IL 60543
MLS# 12532903Listed by: DAYNAE GAUDIO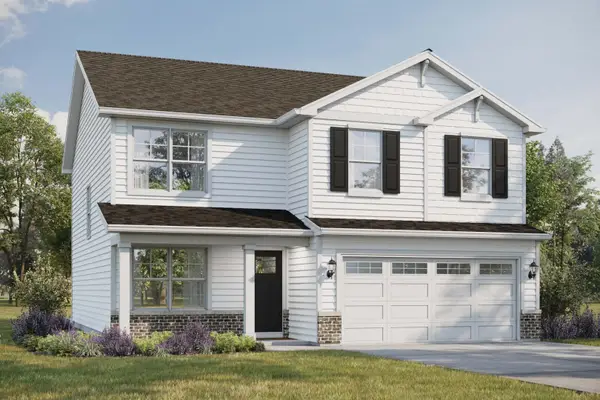 $484,990Pending4 beds 3 baths2,051 sq. ft.
1451 Vintage Drive, Oswego, IL 60543
MLS# 12532916Listed by: DAYNAE GAUDIO $694,600Pending5 beds 5 baths3,342 sq. ft.
404 Tanya Lane, Oswego, IL 60543
MLS# 12532838Listed by: LITTLE REALTY $349,990Pending3 beds 3 baths1,543 sq. ft.
2134 Bodega Road, Oswego, IL 60543
MLS# 12527789Listed by: DAYNAE GAUDIO $346,990Pending3 beds 3 baths1,543 sq. ft.
2132 Bodega Road, Oswego, IL 60543
MLS# 12527793Listed by: DAYNAE GAUDIO $384,990Pending3 beds 3 baths1,543 sq. ft.
2130 Bodega Road, Oswego, IL 60543
MLS# 12527799Listed by: DAYNAE GAUDIO $715,000Pending3 beds 3 baths2,300 sq. ft.
482 Deerfield Drive, Oswego, IL 60543
MLS# 12527940Listed by: LPT REALTY $740,868Pending3 beds 3 baths2,273 sq. ft.
3235 Kimblewick Circle, Aurora, IL 60503
MLS# 12527724Listed by: TWIN VINES REAL ESTATE SVCS $81,000Pending0.69 Acres
7267 Roberts Court, Oswego, IL 60543
MLS# 12525759Listed by: DOMIN'ARE $98,000Active1 Acres
1415 Route 31, Oswego, IL 60543
MLS# 12550227Listed by: CHASE REAL ESTATE LLC $395,500Active2 beds 2 baths2,182 sq. ft.
786 Bohannon Circle, Oswego, IL 60543
MLS# 12592574Listed by: RE/MAX SUBURBAN $971,565Pending4 beds 4 baths3,300 sq. ft.
3169 Bellwether Drive, Aurora, IL 60503
MLS# 12490104Listed by: TWIN VINES REAL ESTATE SVCS $557,900Pending3 beds 2 baths1,900 sq. ft.
851 Claridge Drive, Oswego, IL 60543
MLS# 12483952Listed by: JOHN GREENE, REALTOR $549,990Pending4 beds 3 baths2,600 sq. ft.
1468 Vintage Drive, Oswego, IL 60543
MLS# 12523067Listed by: DAYNAE GAUDIO $782,954Pending2 beds 3 baths2,213 sq. ft.
3146 Bellwether Drive, Aurora, IL 60503
MLS# 12470423Listed by: TWIN VINES REAL ESTATE SVCS $489,990Pending4 beds 3 baths2,218 sq. ft.
417 Hathaway Lane, Oswego, IL 60543
MLS# 12464504Listed by: HOMESMART CONNECT LLC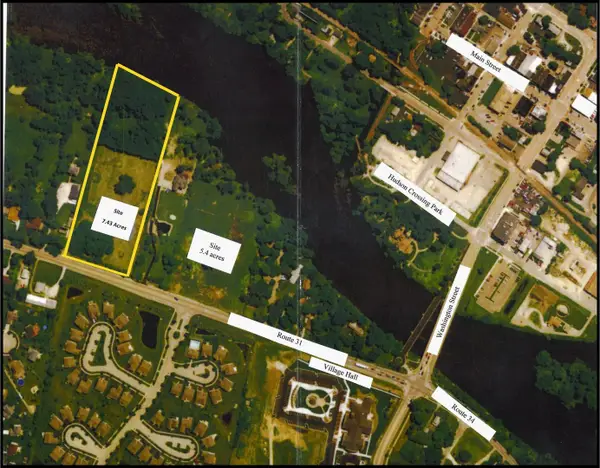 $1,100,000Active7.43 Acres
7.43 Acres Vacant Land State Route 31, Oswego, IL 60543
MLS# 12455839Listed by: JOHN GREENE, REALTOR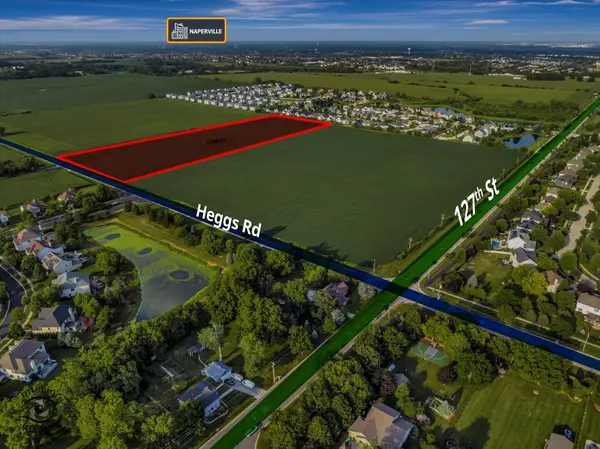 $1,140,762Active-- beds -- baths
10.38 acres S Heggs Road, Plainfield, IL 60585
MLS# 12444228Listed by: BRUMMEL PROPERTIES, INC. $678,530Pending4 beds 3 baths3,145 sq. ft.
215 Willington Way, Oswego, IL 60543
MLS# 12480213Listed by: LITTLE REALTY $599,990Pending4 beds 3 baths2,872 sq. ft.
420 Bower Lane, Oswego, IL 60543
MLS# 12582450Listed by: LITTLE REALTY $669,990Pending4 beds 3 baths3,145 sq. ft.
422 Bower Lane, Oswego, IL 60543
MLS# 12582461Listed by: LITTLE REALTY $1,700,000Active10.09 Acres
0000 Riverwood Drive, Oswego, IL 60543
MLS# 12402553Listed by: REAL BROKER, LLC $159,000Active0.68 Acres
123 W Benton Street, Oswego, IL 60543
MLS# 12335178Listed by: REAL PEOPLE REALTY $850,000Active4 beds 4 baths4,000 sq. ft.
123 W Benton Street, Oswego, IL 60543
MLS# 12335262Listed by: REAL PEOPLE REALTY $599,900Pending-- beds -- baths
870 Simons Road, Oswego, IL 60543
MLS# 12263909Listed by: SWANSON REAL ESTATE $1,750,000Active7.43 Acres
LOT 10 SW Station Drive, Oswego, IL 60543
MLS# 12029409Listed by: BRUMMEL PROPERTIES, INC. $215,000Active1.03 Acres
2071 Wiesbrook Drive, Oswego, IL 60543
MLS# 11947774Listed by: JOHN GREENE, REALTOR $411,206Active1.18 Acres
3 Orchard Road, Oswego, IL 60543
MLS# 11919760Listed by: BRUMMEL PROPERTIES, INC. $1,139,528Active3.27 Acres
123 Orchard Road, Oswego, IL 60543
MLS# 11919763Listed by: BRUMMEL PROPERTIES, INC. $264,844Active0.76 Acres
1 Orchard Road, Oswego, IL 60543
MLS# 11919710Listed by: BRUMMEL PROPERTIES, INC. $463,478Active1.33 Acres
2 Orchard Road, Oswego, IL 60543
MLS# 11919753Listed by: BRUMMEL PROPERTIES, INC.
Local realty services provided by:CENTURY 21 Circle
Copyright 2026 Midwest Real Estate Data LLC. All rights reserved. The data relating to real estate for sale on this web site comes in part from the Broker Reciprocity Program of the Midwest Real Estate Data LLC. Listing information is deemed reliable but not guaranteed.
Popular searches near 60543
Popular neighborhoods near 60543
- Bardwell, Aurora homes for sale
- Carillon Club, Naperville homes for sale
- Century Trace, Plainfield homes for sale
- Far Southeast, Aurora homes for sale
- Georgetown, Aurora homes for sale
- Grande Park, Plainfield homes for sale
- Grande Reserve, Yorkville homes for sale
- Grande Reserve North, Oswego homes for sale
- High Meadow, Naperville homes for sale
- McCarty Burlington, Aurora homes for sale
- South East Villages, Aurora homes for sale
- South End, Aurora homes for sale
- South Farnsworth, Aurora homes for sale
- South Pointe, Naperville homes for sale
- Southeast, Aurora homes for sale
- Tall Grass, Naperville homes for sale
- The Townes at Ashcroft Walk, Oswego homes for sale
- University Neighbors, Aurora homes for sale
- White Eagle Club, Naperville homes for sale
- Windcrest, Oswego homes for sale
Counties near Oswego, 60543
- Boone County homes for sale
- Bureau County homes for sale
- Cook County homes for sale
- DeKalb County homes for sale
- DuPage County homes for sale
- Grundy County homes for sale
- Kane County homes for sale
- Kankakee County homes for sale
- Kendall County homes for sale
- Lake County homes for sale
- Lake County homes for sale
- LaSalle County homes for sale
- Lee County homes for sale
- Livingston County homes for sale
- McHenry County homes for sale
- Ogle County homes for sale
- Porter County homes for sale
- Putnam County homes for sale
- Will County homes for sale
- Winnebago County homes for sale
Protect your home and budget from life's surprises with an Assurant Home Warranty, backed by a partner that supports you through every step of homeownership. Explore Plans.
©2026 Century 21 Real Estate LLC. All rights reserved. CENTURY 21®, the CENTURY 21 Logo and C21® are service marks owned by Century 21 Real Estate LLC. Century 21 Real Estate LLC fully supports the principles of the Fair Housing Act and the Equal Opportunity Act. Each office is independently owned and operated. Listing information is deemed reliable but not guaranteed accurate.