- Berwyn homes for sale
- Chicago homes for sale
- Cicero homes for sale
- Elmwood Park homes for sale
- Evanston homes for sale
- Forest Park homes for sale
- Harwood Heights homes for sale
- Lincolnwood homes for sale
- Niles township homes for sale
- Norridge homes for sale
- North Riverside homes for sale
- Norwood Park homes for sale
- Oak Park Township homes for sale
- Oak Park homes for sale
- River Forest homes for sale
- River Grove homes for sale
- Riverside homes for sale
- Riverside Township homes for sale
- Skokie homes for sale
- Stickney homes for sale
60610, IL - homes for sale
20 of 20 results displayed
- New
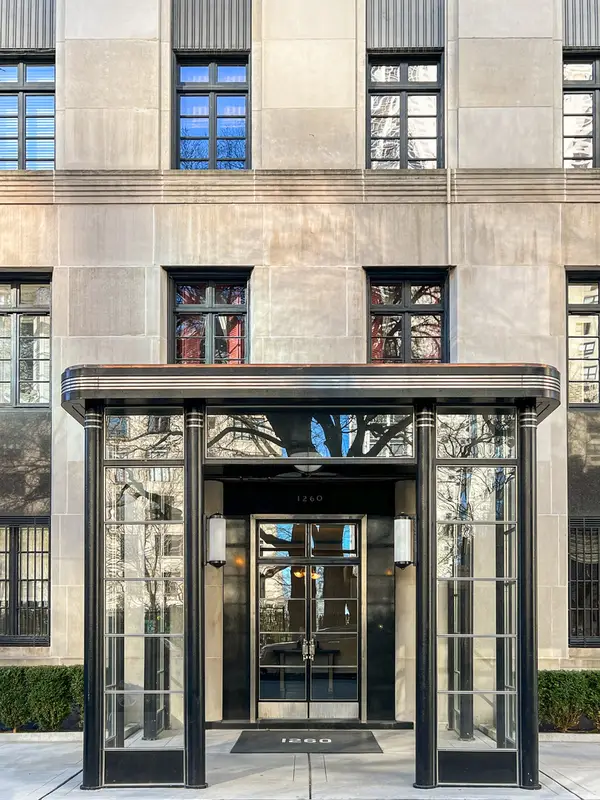 $1,475,000Active5 beds 5 baths4,500 sq. ft.
1260 N Astor Street #7, Chicago, IL 60610
MLS# 12658333Listed by: ENGEL & VOELKERS CHICAGO
 $4,295,000Active5 beds 7 baths6,815 sq. ft.
1434 N Dearborn Street, Chicago, IL 60610
MLS# 12657833Listed by: @PROPERTIES CHRISTIE'S INTERNATIONAL REAL ESTATE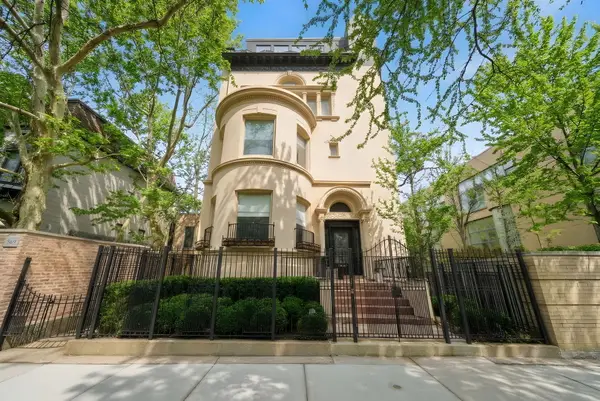 $3,900,000Active5 beds 6 baths9,200 sq. ft.
1352 N La Salle Drive, Chicago, IL 60610
MLS# 12653138Listed by: JAMESON SOTHEBY'S INTL REALTY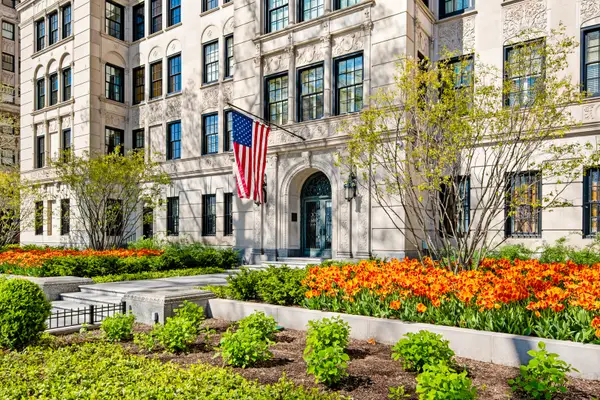 $1,800,000Pending3 beds 4 baths3,500 sq. ft.
1500 N Lake Shore Drive #12C, Chicago, IL 60610
MLS# 12611937Listed by: @PROPERTIES CHRISTIE'S INTERNATIONAL REAL ESTATE $21,000,000Active6 beds 6 baths25,000 sq. ft.
1355 N Astor Street, Chicago, IL 60610
MLS# 12628484Listed by: @PROPERTIES CHRISTIE'S INTERNATIONAL REAL ESTATE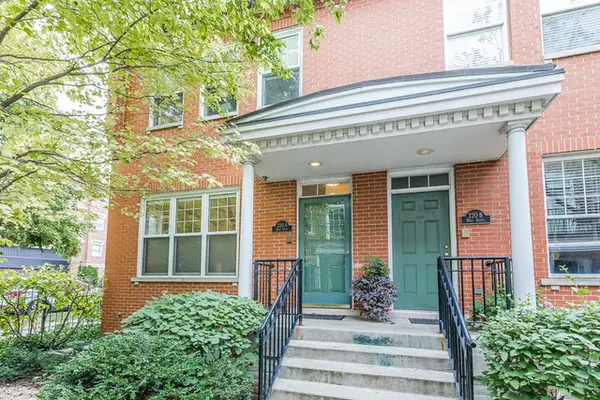 $999,000Pending3 beds 3 baths2,350 sq. ft.
220 W Scott Street #A, Chicago, IL 60610
MLS# 12616542Listed by: FULTON GRACE REALTY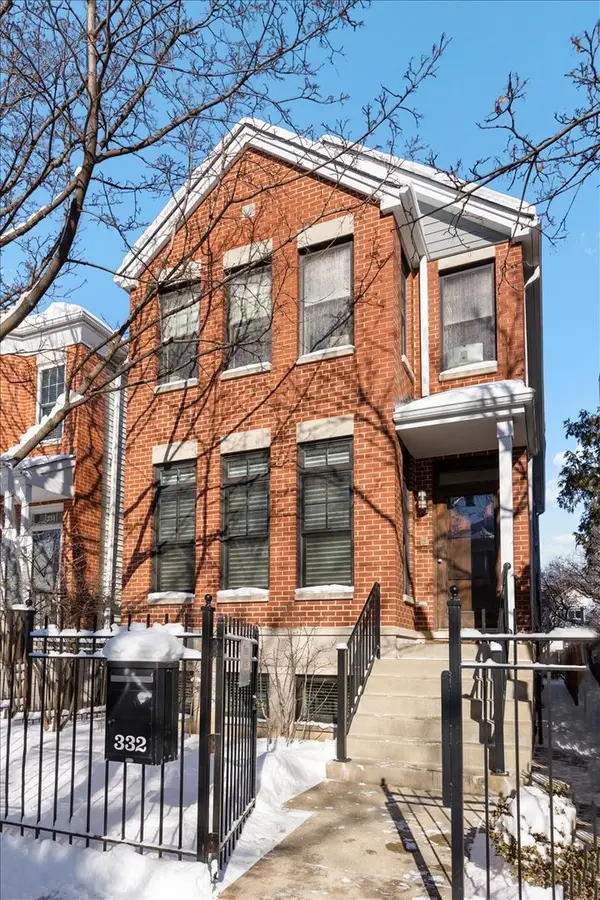 $1,275,000Pending4 beds 5 baths
332 W Goethe Street, Chicago, IL 60610
MLS# 12557103Listed by: @PROPERTIES CHRISTIE'S INTERNATIONAL REAL ESTATE $1,379,000Pending3 beds 4 baths3,108 sq. ft.
1500 N Lake Shore Drive #9B, Chicago, IL 60610
MLS# 12596424Listed by: @PROPERTIES CHRISTIE'S INTERNATIONAL REAL ESTATE $589,000Active3 beds 3 baths2,520 sq. ft.
1448 N Lake Shore Drive #3C, Chicago, IL 60610
MLS# 12589246Listed by: @PROPERTIES CHRISTIE'S INTERNATIONAL REAL ESTATE $6,000,000Active6 beds 5 baths11,000 sq. ft.
1454 N Dearborn Street, Chicago, IL 60610
MLS# 12573383Listed by: COMPASS $1,875,000Pending4 beds 4 baths3,800 sq. ft.
1518 N North Park Street, Chicago, IL 60610
MLS# 12555756Listed by: BAIRD & WARNER $1,700,000Active3 beds 4 baths2,580 sq. ft.
29 E Scott Street, Chicago, IL 60610
MLS# 12498072Listed by: COLDWELL BANKER REALTY $2,750,000Pending3 beds 4 baths4,000 sq. ft.
1500 N Lake Shore Drive #23C, Chicago, IL 60610
MLS# 12482065Listed by: @PROPERTIES CHRISTIE'S INTERNATIONAL REAL ESTATE $2,995,000Active3 beds 3 baths4,100 sq. ft.
1540 N Lake Shore Drive #8N, Chicago, IL 60610
MLS# 12589266Listed by: @PROPERTIES CHRISTIE'S INTERNATIONAL REAL ESTATE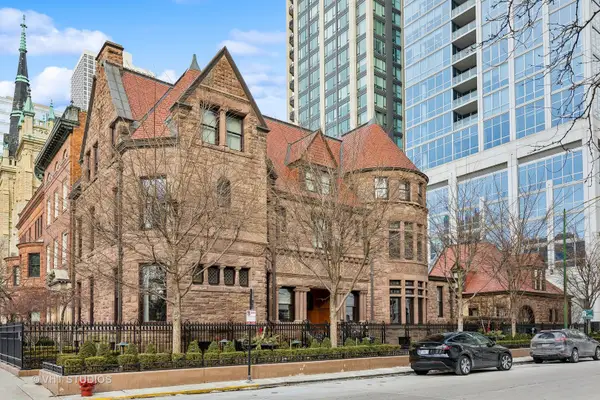 $18,500,000Active6 beds 7 baths13,400 sq. ft.
915 N Dearborn Street, Chicago, IL 60610
MLS# 12273547Listed by: BAIRD & WARNER $5,995,000Active3 beds 6 baths6,500 sq. ft.
1524 N Astor Street, Chicago, IL 60610
MLS# 12578948Listed by: ENGEL & VOELKERS CHICAGO $950,000Active4 beds 4 baths4,200 sq. ft.
1242 N Lake Shore Drive #22, Chicago, IL 60610
MLS# 12260426Listed by: BAIRD & WARNER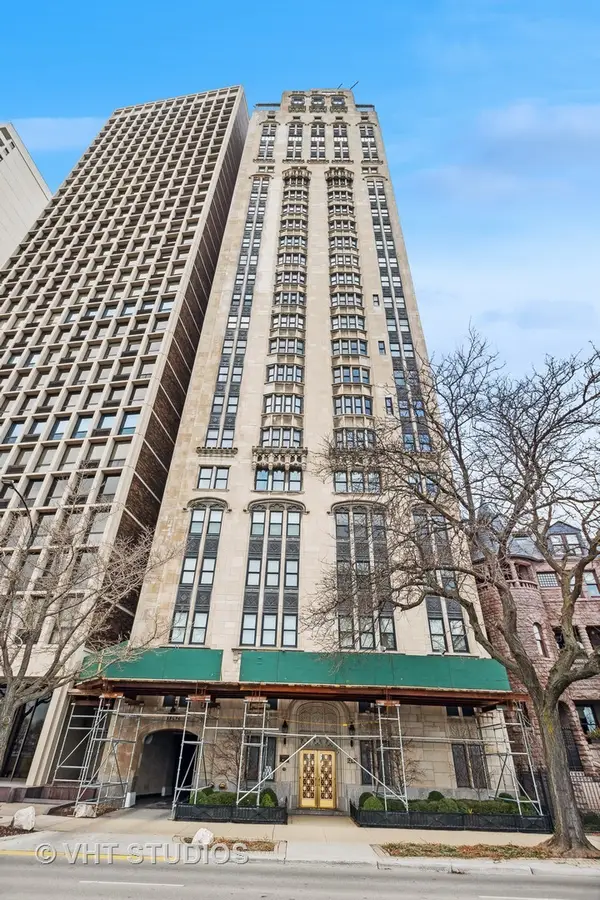 $1,000,000Active4 beds 5 baths5,327 sq. ft.
1242 N Lake Shore Drive #25, Chicago, IL 60611
MLS# 11978074Listed by: BAIRD & WARNER $3,395,000Pending5 beds 7 baths5,500 sq. ft.
1401 N Astor Street, Chicago, IL 60610
MLS# 12535746Listed by: INTER PROPERTIES INC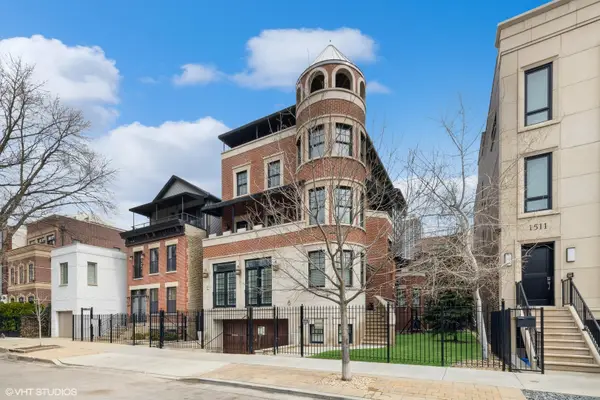 $5,200,000Active7 beds 6 baths8,400 sq. ft.
1515 N North Park Avenue, Chicago, IL 60610
MLS# 11755660Listed by: COLDWELL BANKER REALTY
Local realty services provided by:CENTURY 21 Affiliated
Copyright 2026 Midwest Real Estate Data LLC. All rights reserved. The data relating to real estate for sale on this web site comes in part from the Broker Reciprocity Program of the Midwest Real Estate Data LLC. Listing information is deemed reliable but not guaranteed. MLSNI Member Broker: David Try
Popular searches near 60610
Popular neighborhoods near 60610
- East Village, Chicago homes for sale
- Fulton Market, Chicago homes for sale
- Fulton River District, Chicago homes for sale
- Gold Coast, Chicago homes for sale
- Greektown, Chicago homes for sale
- Lakeshore East, Chicago homes for sale
- Lincoln Park, Chicago homes for sale
- Loop, Chicago homes for sale
- Magnificent Mile, Chicago homes for sale
- Near North Side, Chicago homes for sale
- Noble Square, Chicago homes for sale
- Old Town, Chicago homes for sale
- Printer's Row, Chicago homes for sale
- River North, Chicago homes for sale
- River West, Chicago homes for sale
- Rush & Division, Chicago homes for sale
- Sheffield & DePaul, Chicago homes for sale
- Streeterville, Chicago homes for sale
- West Loop, Chicago homes for sale
- West Town, Chicago homes for sale
Counties near Chicago, 60610
- Berrien County homes for sale
- Boone County homes for sale
- Cook County homes for sale
- DeKalb County homes for sale
- DuPage County homes for sale
- Grundy County homes for sale
- Kane County homes for sale
- Kankakee County homes for sale
- Kendall County homes for sale
- Kenosha County homes for sale
- Lake County homes for sale
- Lake County homes for sale
- LaPorte County homes for sale
- McHenry County homes for sale
- Newton County homes for sale
- Porter County homes for sale
- Racine County homes for sale
- Starke County homes for sale
- Van Buren County homes for sale
- Will County homes for sale
Protect your home and budget from life's surprises with an Assurant Home Warranty, backed by a partner that supports you through every step of homeownership. Explore Plans.
©2026 Century 21 Real Estate LLC. All rights reserved. CENTURY 21®, the CENTURY 21 Logo and C21® are service marks owned by Century 21 Real Estate LLC. Century 21 Real Estate LLC fully supports the principles of the Fair Housing Act and the Equal Opportunity Act. Each office is independently owned and operated. Listing information is deemed reliable but not guaranteed accurate.