- Berwyn homes for sale
- Chicago homes for sale
- Cicero homes for sale
- Elmwood Park homes for sale
- Evanston homes for sale
- Forest Park homes for sale
- Harwood Heights homes for sale
- Lincolnwood homes for sale
- Maywood homes for sale
- Melrose Park homes for sale
- Morton Grove homes for sale
- Niles township homes for sale
- Norridge homes for sale
- Norwood Park homes for sale
- Oak Park Township homes for sale
- Oak Park homes for sale
- River Forest homes for sale
- River Grove homes for sale
- Skokie homes for sale
- Stickney homes for sale
60614, IL - homes for sale
293 of 293 results displayed
- New
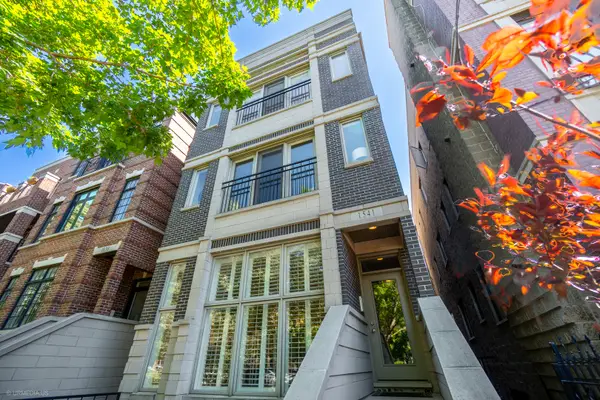
 $539,900Active2 beds 2 baths
2525 N Sheffield Avenue #2C, Chicago, IL 60614
MLS# 12670822Listed by: COLDWELL BANKER STRATFORD PLACE
- New
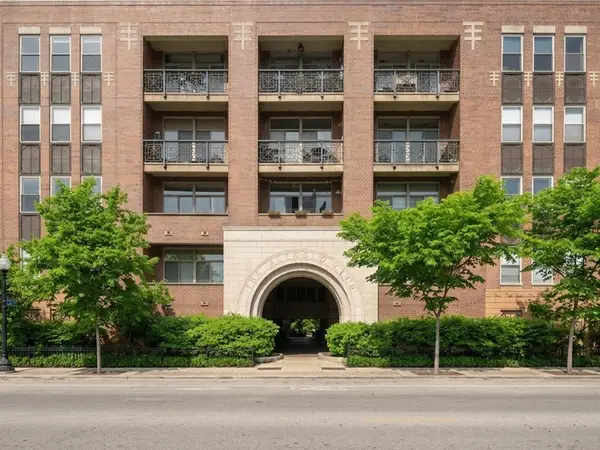
 $675,000Active2 beds 2 baths
1123 W Altgeld Street #3, Chicago, IL 60614
MLS# 12665461Listed by: BAIRD & WARNER - New
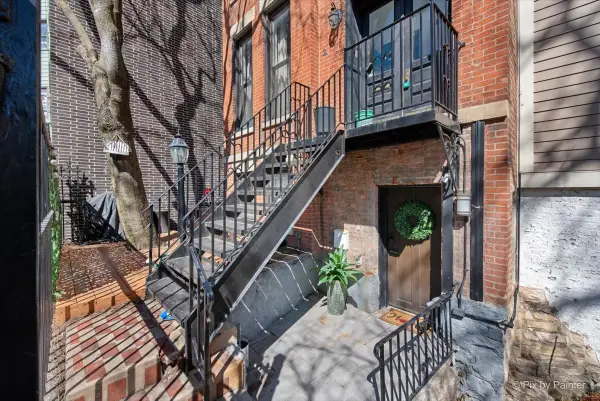
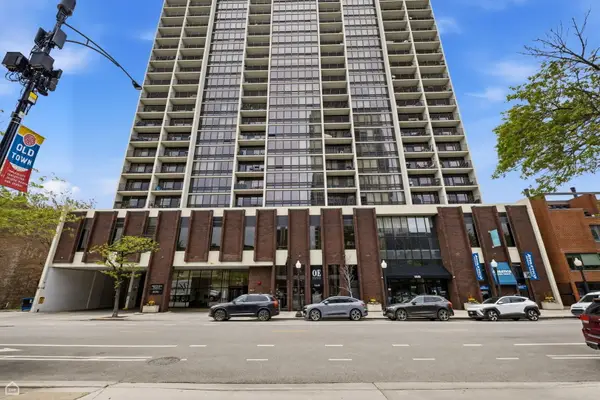
 $285,000Active1 beds 1 baths840 sq. ft.
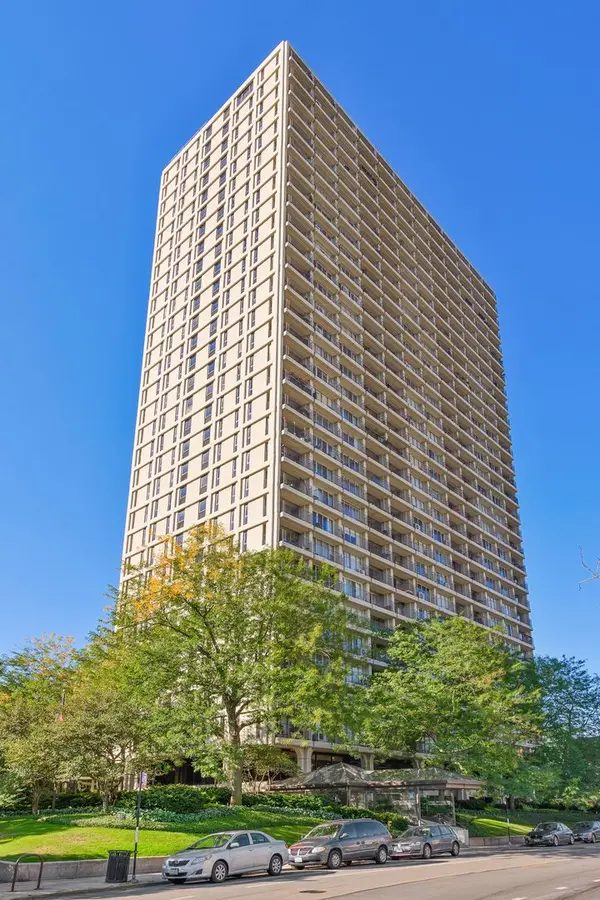
2626 N Lakeview Avenue #3804, Chicago, IL 60614
MLS# 12665867Listed by: HOMESMART CONNECT LLC - New
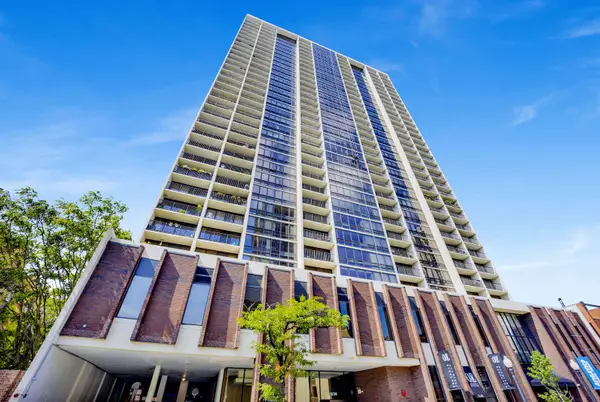
 $500,000Active2 beds 1 baths1,300 sq. ft.
2600 N Southport Avenue #315, Chicago, IL 60614
MLS# 12666934Listed by: @PROPERTIES CHRISTIE'S INTERNATIONAL REAL ESTATE 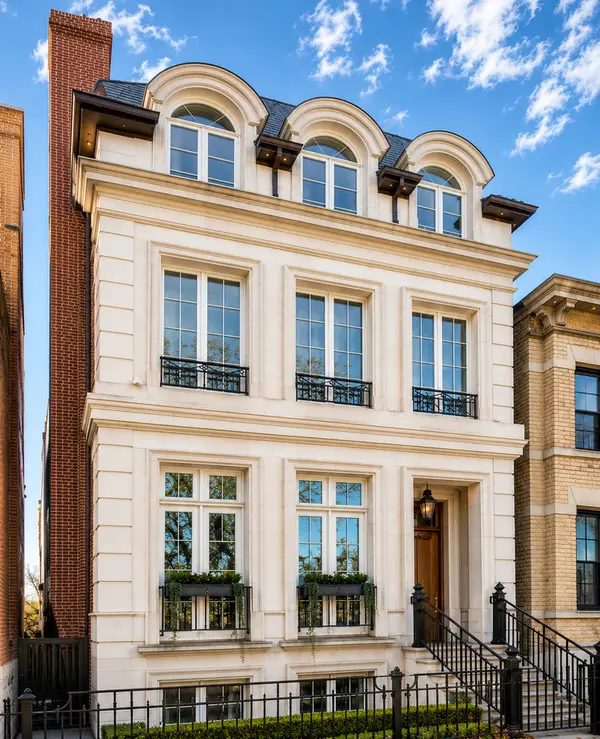 $4,495,000Pending7 beds 7 baths5,750 sq. ft.
1852 N Howe Street, Chicago, IL 60614
MLS# 12645600Listed by: @PROPERTIES CHRISTIE'S INTERNATIONAL REAL ESTATE- New
 $449,000Active2 beds 2 baths1,150 sq. ft.
345 W Fullerton Parkway #801, Chicago, IL 60614
MLS# 12636880Listed by: REAL PEOPLE REALTY - New
 $299,500Active1 beds 1 baths800 sq. ft.
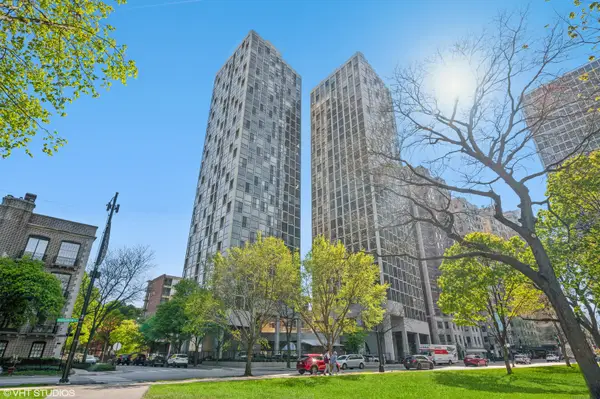
1960 N Lincoln Park West #1601, Chicago, IL 60614
MLS# 12669063Listed by: JAMESON SOTHEBY'S INTL REALTY - New
 $2,399,000Active3 beds 3 baths
1935 N Mohawk Street #4N, Chicago, IL 60614
MLS# 12541812Listed by: FULTON GRACE REALTY - New
 $1,975,000Active4 beds 4 baths
1935 N Mohawk Street #1S, Chicago, IL 60614
MLS# 12597724Listed by: FULTON GRACE REALTY - New
 $825,000Active2 beds 2 baths
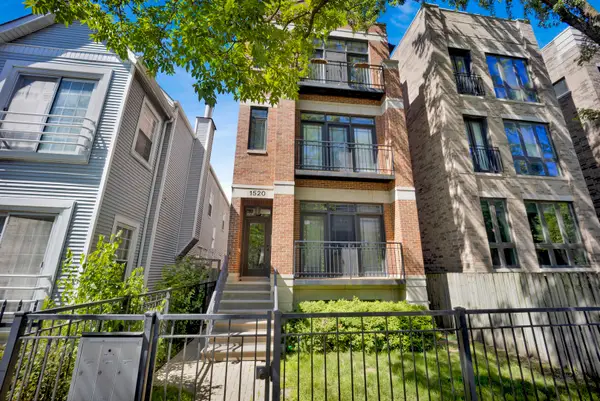
1520 W Diversey Parkway #3, Chicago, IL 60614
MLS# 12659365Listed by: FULTON GRACE REALTY - New
 $849,900Active3 beds 3 baths2,200 sq. ft.
1541 W Montana Street #1, Chicago, IL 60614
MLS# 12652374Listed by: COMPASS  $3,800,000Pending5 beds 5 baths5,900 sq. ft.
1739 N Mohawk Street, Chicago, IL 60614
MLS# 12664232Listed by: WEICHERT,REALTORS-FIRSTCHICAGO- New
 $775,000Active2 beds 2 baths1,496 sq. ft.
1155 W Armitage Avenue #301, Chicago, IL 60614
MLS# 12664276Listed by: KELLER WILLIAMS ONECHICAGO - New
 $1,799,900Active5 beds 4 baths2,500 sq. ft.
1952 N Bissell Street, Chicago, IL 60614
MLS# 12666155Listed by: BERG PROPERTIES - New
 $440,000Active2 beds 2 baths1,162 sq. ft.
2626 N Lakeview Avenue #1102, Chicago, IL 60614
MLS# 12667038Listed by: BERKSHIRE HATHAWAY HOMESERVICES CHICAGO - New
 $515,000Active2 beds 2 baths
1350 W Fullerton Avenue #514, Chicago, IL 60614
MLS# 12665988Listed by: COLDWELL BANKER REALTY - New
 $5,495,000Active6 beds 6 baths6,500 sq. ft.
1755 N Mohawk Street, Chicago, IL 60614
MLS# 12666389Listed by: JAMESON SOTHEBY'S INTL REALTY - New
 $439,000Active2 beds 2 baths
2020 N Lincoln Park West #18M, Chicago, IL 60614
MLS# 12667428Listed by: @PROPERTIES CHRISTIE'S INTERNATIONAL REAL ESTATE - New
 $425,000Active2 beds 1 baths900 sq. ft.
1969 N Lincoln Avenue #1, Chicago, IL 60614
MLS# 12668152Listed by: COLDWELL BANKER REALTY - New
 $290,000Active1 beds 1 baths676 sq. ft.
1636 N Wells Street #1605, Chicago, IL 60614
MLS# 12666631Listed by: FULTON GRACE REALTY  $285,000Pending1 beds 1 baths
2326 N Lincoln Park We #2B, Chicago, IL 60614
MLS# 12663574Listed by: JAMESON SOTHEBY'S INTL REALTY- New
 $1,680,000Active2 beds 3 baths2,220 sq. ft.
2329 N Cambridge Avenue #A, Chicago, IL 60614
MLS# 12572894Listed by: COMPASS - New
 $2,100,000Active4 beds 4 baths2,930 sq. ft.
2329 N Cambridge Avenue, Chicago, IL 60614
MLS# 12573026Listed by: COMPASS - New
 $1,950,000Active3 beds 4 baths2,915 sq. ft.
2329 N Cambridge Avenue #G, Chicago, IL 60614
MLS# 12573046Listed by: COMPASS - New
 $799,000Active2 beds 2 baths1,760 sq. ft.
845 W Altgeld Street #4D, Chicago, IL 60614
MLS# 12667364Listed by: BAIRD & WARNER - New
 $709,000Active2 beds 2 baths1,200 sq. ft.
1541 W Montana Street #2, Chicago, IL 60614
MLS# 12668046Listed by: BAIRD & WARNER - New
 $315,000Active1 beds 1 baths
2122 N Lincoln Avenue #A1, Chicago, IL 60614
MLS# 12660825Listed by: COMPASS - New
 $999,000Active3 beds 3 baths1,700 sq. ft.
1201 W Wrightwood Avenue #7, Chicago, IL 60614
MLS# 12661720Listed by: COMPASS  $875,000Pending2 beds 2 baths
1900 N Sheffield Avenue #2N, Chicago, IL 60614
MLS# 12663604Listed by: COMPASS- New
 $949,900Active3 beds 2 baths2,000 sq. ft.
958 W Willow Street #4, Chicago, IL 60614
MLS# 12666843Listed by: REDFIN CORPORATION - New
 $485,000Active1 beds 2 baths1,300 sq. ft.
2614 N Clybourn Avenue #301, Chicago, IL 60614
MLS# 12666561Listed by: ENGEL & VOELKERS CHICAGO  $1,595,000Pending3 beds 3 baths2,800 sq. ft.
2440 N Lakeview Avenue #13B, Chicago, IL 60614
MLS# 12662662Listed by: ENGEL & VOELKERS CHICAGO- New
 $944,000Active3 beds 3 baths2,907 sq. ft.
2743 N Ashland Avenue #1N, Chicago, IL 60614
MLS# 12663542Listed by: @PROPERTIES CHRISTIE'S INTERNATIONAL REAL ESTATE - New
 $1,170,000Active3 beds 3 baths2,000 sq. ft.
1046 W Altgeld Street #1S, Chicago, IL 60614
MLS# 12665249Listed by: COLDWELL BANKER REALTY - New
 $825,000Active4 beds 3 baths2,000 sq. ft.
2234 N Racine Avenue #1S, Chicago, IL 60614
MLS# 12665506Listed by: AMERICORP, LTD  $349,900Pending1 beds 1 baths
2020 N Lincoln Park West #18C, Chicago, IL 60614
MLS# 12665064Listed by: COLDWELL BANKER REALTY- New
 $999,000Active3 beds 3 baths
1721 N Bissell Street, Chicago, IL 60614
MLS# 12649675Listed by: @PROPERTIES CHRISTIE'S INTERNATIONAL REAL ESTATE  $337,500Pending1 beds 1 baths800 sq. ft.
1960 N Lincoln Park West #2911, Chicago, IL 60614
MLS# 12661003Listed by: COMPASS $379,000Pending1 beds 1 baths
2026 N Burling Street #107, Chicago, IL 60614
MLS# 12660494Listed by: COMPASS- New
 $460,000Active2 beds 2 baths
1636 N Wells Street #2215, Chicago, IL 60614
MLS# 12662271Listed by: EXP REALTY  $519,000Pending3 beds 1 baths1,000 sq. ft.
559 W Fullerton Parkway #1W, Chicago, IL 60614
MLS# 12652212Listed by: @PROPERTIES CHRISTIE'S INTERNATIONAL REAL ESTATE- New
 $650,000Active2 beds 2 baths
2555 N Southport Avenue #3, Chicago, IL 60614
MLS# 12661338Listed by: BAIRD & WARNER - New
 $1,250,000Active3 beds 2 baths2,100 sq. ft.
2800 N Lincoln Avenue #4S, Chicago, IL 60657
MLS# 12661464Listed by: BAIRD & WARNER - New
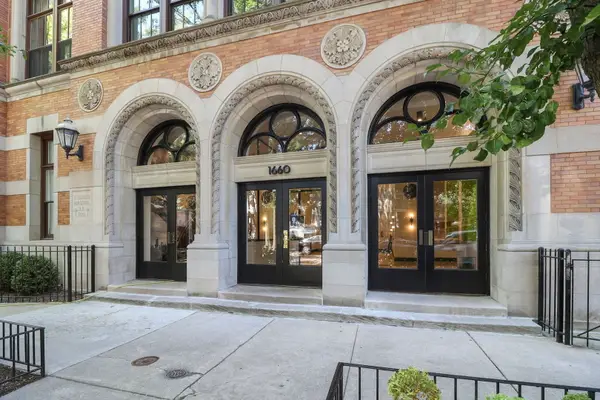 $690,000Active2 beds 3 baths
1660 N Hudson Avenue #1J, Chicago, IL 60614
MLS# 12661620Listed by: COLDWELL BANKER REALTY - New
 $2,750,000Active4 beds 4 baths3,200 sq. ft.
2207 N Orchard Street #1, Chicago, IL 60614
MLS# 12659277Listed by: PREMIER RELOCATION, INC.  $675,000Pending2 beds 3 baths1,640 sq. ft.
2733 N Lincoln Avenue #A, Chicago, IL 60614
MLS# 12661758Listed by: JAMESON SOTHEBY'S INTL REALTY $650,000Pending3 beds 2 baths1,600 sq. ft.
1801 W Diversey Parkway #14, Chicago, IL 60614
MLS# 12660308Listed by: @PROPERTIES CHRISTIE'S INTERNATIONAL REAL ESTATE $1,499,000Pending4 beds 2 baths2,583 sq. ft.
2144 N Fremont Street, Chicago, IL 60614
MLS# 12657770Listed by: @PROPERTIES CHRISTIE'S INTERNATIONAL REAL ESTATE $229,900Pending1 beds 1 baths
2330 N Lincoln Park W Avenue #4C, Chicago, IL 60614
MLS# 12660539Listed by: GREEN IVY REALTY & PROP MGMT- New
 $1,299,900Active2 beds 2 baths
2331 N Elston Court, Chicago, IL 60614
MLS# 12646137Listed by: FULTON GRACE REALTY  $599,000Pending2 beds 1 baths
2053 N Racine Avenue #2S, Chicago, IL 60614
MLS# 12654502Listed by: @PROPERTIES CHRISTIE'S INTERNATIONAL REAL ESTATE- New
 $285,000Active1 beds 1 baths
444 W Fullerton Parkway #1010, Chicago, IL 60614
MLS# 12653859Listed by: @PROPERTIES CHRISTIE'S INTERNATIONAL REAL ESTATE 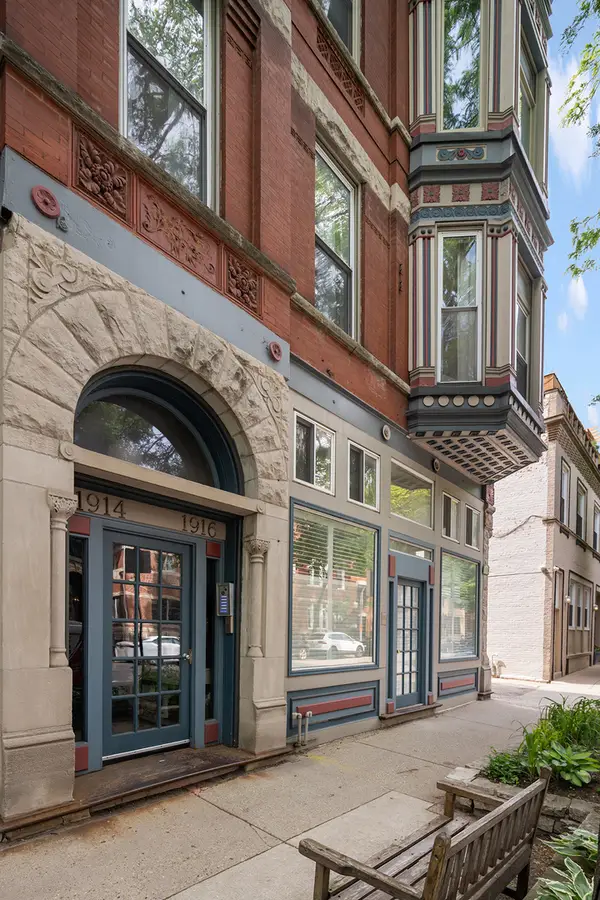 $499,000Pending2 beds 1 baths
1916 N Sheffield Avenue #2F, Chicago, IL 60614
MLS# 12653473Listed by: JAMESON SOTHEBY'S INTL REALTY $399,000Pending2 beds 1 baths800 sq. ft.
1919 N Bissell Street, Chicago, IL 60614
MLS# 12658891Listed by: COMPASS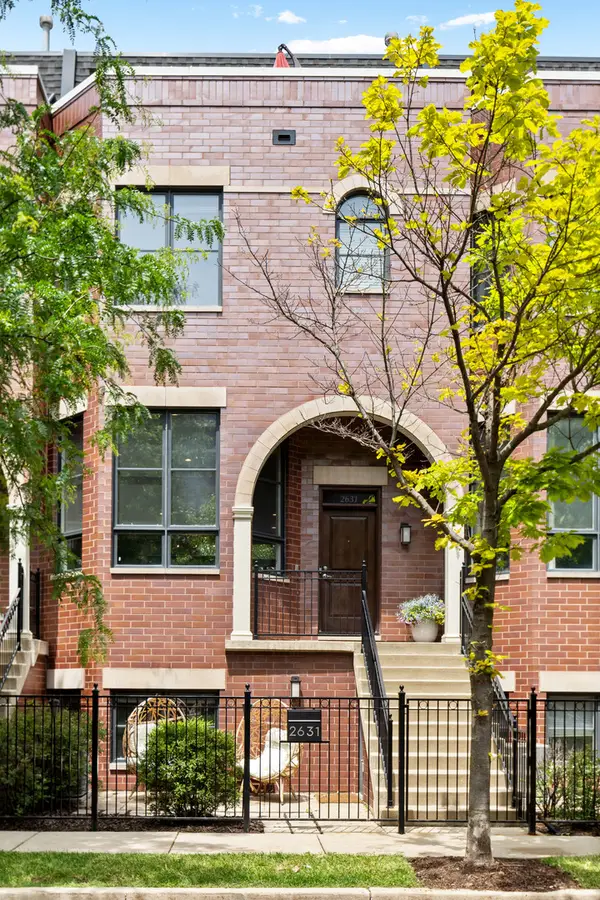 $1,350,000Pending5 beds 5 baths3,400 sq. ft.
2631 N Hartland Court, Chicago, IL 60614
MLS# 12657632Listed by: JAMESON SOTHEBY'S INTL REALTY $969,000Pending3 beds 3 baths2,942 sq. ft.
2743 N Ashland Avenue #1S, Chicago, IL 60614
MLS# 12659860Listed by: COLDWELL BANKER REALTY- New
 $425,000Active2 beds 1 baths
869 N Lasalle Street #2, Chicago, IL 60610
MLS# 12660338Listed by: KELLER WILLIAMS ONECHICAGO 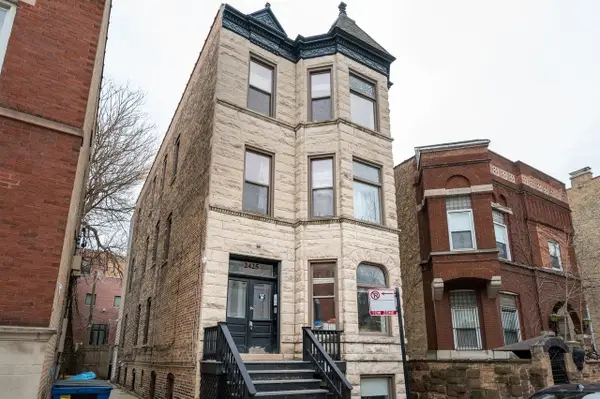 $3,000,000Active14 beds 7 baths
2425 N Geneva Terrace, Chicago, IL 60614
MLS# 12656620Listed by: STAR REALTY & MANAGEMENT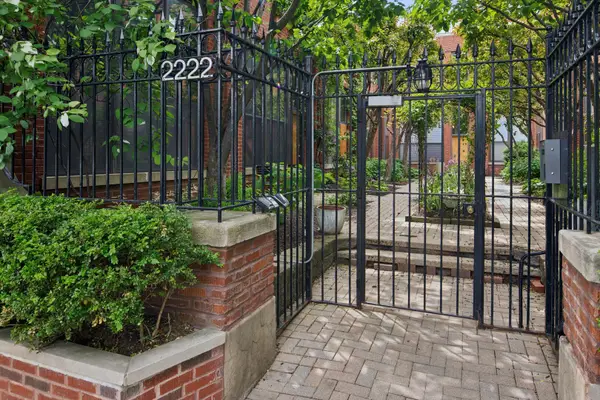 $900,000Pending3 beds 2 baths1,800 sq. ft.
2222 N Racine Avenue #16, Chicago, IL 60614
MLS# 12657129Listed by: @PROPERTIES CHRISTIE'S INTERNATIONAL REAL ESTATE $1,500,000Pending3 beds 3 baths
1321 W Wrightwood Avenue #3, Chicago, IL 60614
MLS# 12642699Listed by: COLDWELL BANKER REALTY $320,000Pending1 beds 1 baths775 sq. ft.
1636 N Wells Street #1709, Chicago, IL 60614
MLS# 12645375Listed by: REDFIN CORPORATION $529,000Pending2 beds 2 baths1,200 sq. ft.
2729 N Wayne Avenue #C, Chicago, IL 60614
MLS# 12647411Listed by: @PROPERTIES CHRISTIE'S INTERNATIONAL REAL ESTATE $1,500,000Active3 beds 3 baths1,850 sq. ft.
855 W Lill Avenue #2, Chicago, IL 60614
MLS# 12654412Listed by: URBAN LIVING PROPERTIES, LLC $1,000,000Pending3 beds 2 baths1,780 sq. ft.
2755 N Lakewood Avenue #4S, Chicago, IL 60614
MLS# 12658982Listed by: JAMESON SOTHEBY'S INTL REALTY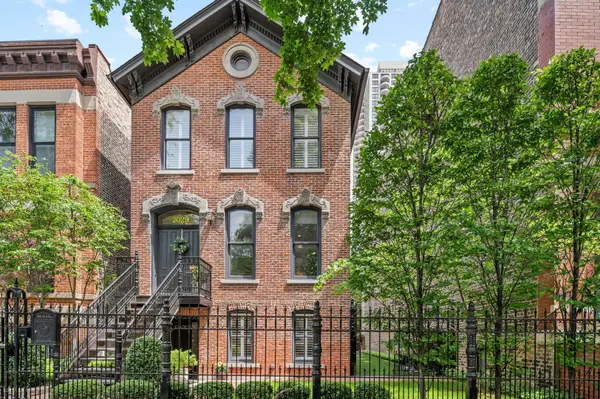 $2,639,000Pending5 beds 5 baths
2029 N Sedgwick Street, Chicago, IL 60614
MLS# 12659143Listed by: @PROPERTIES CHRISTIE'S INTERNATIONAL REAL ESTATE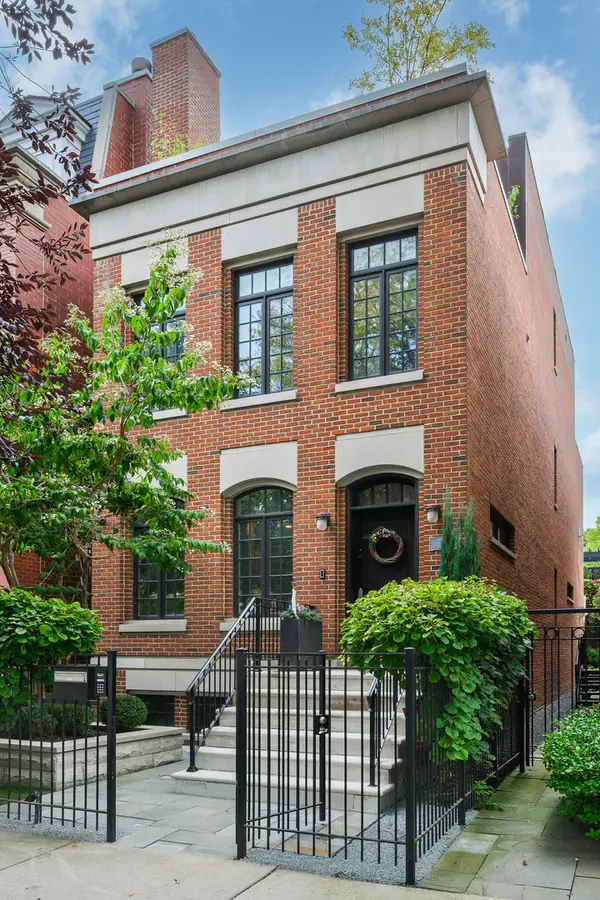 $3,250,000Active6 beds 6 baths
2122 N Magnolia Avenue, Chicago, IL 60614
MLS# 12660001Listed by: COMPASS $2,100,000Active4 beds 3 baths
1839 N Dayton Street #102, Chicago, IL 60614
MLS# 12659434Listed by: MARK ALLEN REALTY ERA POWERED $2,175,000Active3 beds 2 baths
1839 N Dayton Street #PH-02, Chicago, IL 60614
MLS# 12659509Listed by: MARK ALLEN REALTY ERA POWERED $1,450,000Active3 beds 2 baths
1839 N Dayton Street #204, Chicago, IL 60614
MLS# 12659515Listed by: MARK ALLEN REALTY ERA POWERED $600,000Active2 beds 1 baths1,200 sq. ft.
2150 N Clifton Avenue #3, Chicago, IL 60614
MLS# 12655271Listed by: @PROPERTIES CHRISTIE'S INTERNATIONAL REAL ESTATE $379,500Pending1 beds 1 baths750 sq. ft.
223 W Wisconsin Street #2D, Chicago, IL 60614
MLS# 12656797Listed by: @PROPERTIES CHRISTIE'S INTERNATIONAL REAL ESTATE $725,000Active2 beds 2 baths1,800 sq. ft.
2133 N Southport Avenue #3, Chicago, IL 60614
MLS# 12635493Listed by: BAIRD & WARNER $950,000Pending3 beds 3 baths
1843 N Hudson Avenue #A, Chicago, IL 60614
MLS# 12652361Listed by: BAIRD & WARNER $1,299,900Pending4 beds 3 baths
2717 N Racine Avenue #1, Chicago, IL 60614
MLS# 12653398Listed by: BERKSHIRE HATHAWAY HOMESERVICES CHICAGO $370,000Pending1 beds 1 baths700 sq. ft.
2007 N Sedgwick Street #102, Chicago, IL 60614
MLS# 12657550Listed by: BERKSHIRE HATHAWAY HOMESERVICES CHICAGO $1,050,000Pending3 beds 3 baths2,400 sq. ft.
2718 N Wayne Avenue #1, Chicago, IL 60614
MLS# 12657850Listed by: JAMESON SOTHEBY'S INTL REALTY $3,995,000Active7 beds 5 baths5,676 sq. ft.
2705 N Bosworth Avenue, Chicago, IL 60614
MLS# 12658207Listed by: @PROPERTIES CHRISTIE'S INTERNATIONAL REAL ESTATE $570,000Pending2 beds 2 baths
1539 W Montana Street #2, Chicago, IL 60614
MLS# 12584563Listed by: @PROPERTIES CHRISTIE'S INTERNATIONAL REAL ESTATE $795,000Pending3 beds 3 baths2,000 sq. ft.
2707 N Lincoln Avenue #R, Chicago, IL 60614
MLS# 12655977Listed by: KELLER WILLIAMS ONECHICAGO $4,550,000Active4 beds 5 baths3,596 sq. ft.
2350 N Orchard Street #701, Chicago, IL 60614
MLS# 12622843Listed by: ENGEL & VOELKERS CHICAGO $3,125,000Active6 beds 6 baths5,390 sq. ft.
1900 N Fremont Street, Chicago, IL 60614
MLS# 12658282Listed by: @PROPERTIES CHRISTIE'S INTERNATIONAL REAL ESTATE $500,000Pending2 beds 2 baths1,300 sq. ft.
1735 W Diversey Parkway #501, Chicago, IL 60614
MLS# 12626616Listed by: KELLER WILLIAMS ONECHICAGO $2,650,000Active5 beds 7 baths4,000 sq. ft.
1939 N Bissell Street, Chicago, IL 60614
MLS# 12658528Listed by: COMPASS $1,575,000Pending4 beds 3 baths
1907 N Cleveland Avenue #A, Chicago, IL 60614
MLS# 12634266Listed by: JAMESON SOTHEBY'S INTL REALTY $749,000Pending3 beds 2 baths1,800 sq. ft.
1739 N Clybourn Avenue #3S, Chicago, IL 60614
MLS# 12651733Listed by: BAIRD & WARNER $2,695,000Active5 beds 4 baths3,874 sq. ft.
613 W Belden Avenue, Chicago, IL 60614
MLS# 12657878Listed by: @PROPERTIES CHRISTIE'S INTERNATIONAL REAL ESTATE- New
 $725,000Active2 beds 2 baths1,271 sq. ft.
1644 W Diversey Parkway #2, Chicago, IL 60614
MLS# 12663841Listed by: @PROPERTIES CHRISTIE'S INTERNATIONAL REAL ESTATE  $685,000Pending2 beds 2 baths1,800 sq. ft.
1940 N Cleveland Avenue #4, Chicago, IL 60614
MLS# 12656541Listed by: KELLER WILLIAMS ONECHICAGO $299,000Pending1 beds 1 baths641 sq. ft.
1839 N Sheffield Avenue #G, Chicago, IL 60614
MLS# 12657035Listed by: COMPASS $315,000Pending2 beds 1 baths
607 W Wrightwood Avenue #415, Chicago, IL 60614
MLS# 12654826Listed by: COMPASS $179,500Active-- beds 1 baths700 sq. ft.
2740 N Pine Grove Avenue #4D, Chicago, IL 60614
MLS# 12653544Listed by: FIFTH STREET REALTY LLC $499,900Pending2 beds 1 baths
2059 N Larrabee Street, Chicago, IL 60614
MLS# 12655319Listed by: ALLURE REAL ESTATE $675,000Pending3 beds 2 baths1,700 sq. ft.
1915 W Diversey Parkway #402, Chicago, IL 60614
MLS# 12655686Listed by: COMPASS $214,900Pending2 beds 1 baths800 sq. ft.
607 W Wrightwood Avenue #315, Chicago, IL 60614
MLS# 12655688Listed by: GRANDVIEW REALTY, LLC $319,000Pending1 beds 1 baths
1960 N Lincoln Park West Avenue #1206, Chicago, IL 60614
MLS# 12652566Listed by: BAIRD & WARNER $685,000Pending2 beds 2 baths1,400 sq. ft.
1846 N Mohawk Street #B, Chicago, IL 60614
MLS# 12653683Listed by: BAIRD & WARNER $650,000Active2 beds 1 baths2,235 sq. ft.
1872 N Clybourn Avenue #103, Chicago, IL 60614
MLS# 12425678Listed by: KELLER WILLIAMS ONECHICAGO $2,650,000Pending5 beds 6 baths5,440 sq. ft.
2714 N Greenview Avenue, Chicago, IL 60614
MLS# 12620567Listed by: @PROPERTIES CHRISTIE'S INTERNATIONAL REAL ESTATE $450,000Active2 beds 2 baths1,200 sq. ft.
2400 N Lakeview Avenue #1704, Chicago, IL 60614
MLS# 12651467Listed by: REDFIN CORPORATION $650,000Active2 beds 2 baths
1872 N Clybourn Avenue #403, Chicago, IL 60614
MLS# 12646003Listed by: KELLER WILLIAMS ONECHICAGO $655,000Pending2 beds 3 baths1,500 sq. ft.
205 W Eugenie Street, Chicago, IL 60614
MLS# 12652328Listed by: @PROPERTIES CHRISTIE'S INTERNATIONAL REAL ESTATE $1,325,000Pending4 beds 3 baths2,200 sq. ft.
850 W Lill Avenue #1, Chicago, IL 60614
MLS# 12652509Listed by: FULTON GRACE REALTY- New
 $209,000Active-- beds 1 baths518 sq. ft.
2626 N Lakeview Avenue #3206, Chicago, IL 60614
MLS# 12666524Listed by: KOMAR  $375,000Pending2 beds 2 baths
1850 N Clark Street #703, Chicago, IL 60614
MLS# 12646126Listed by: @PROPERTIES CHRISTIE'S INTERNATIONAL REAL ESTATE $1,450,000Pending2 beds 2 baths1,411 sq. ft.
2550 N Lakeview Avenue #N2203, Chicago, IL 60614
MLS# 12619070Listed by: BAIRD & WARNER $4,550,000Active5 beds 6 baths5,000 sq. ft.
1944 N Fremont Street, Chicago, IL 60614
MLS# 12643241Listed by: COLDWELL BANKER REALTY $4,100,000Pending3 beds 4 baths4,400 sq. ft.
2120 N Lincoln Park West #15, Chicago, IL 60614
MLS# 12615964Listed by: COMPASS $1,750,000Active3 beds 3 baths2,644 sq. ft.
2468 N Orchard Street #M-S, Chicago, IL 60614
MLS# 12650366Listed by: @PROPERTIES CHRISTIE'S INTERNATIONAL REAL ESTATE $2,100,000Pending6 beds 5 baths
1726 N Cleveland Avenue, Chicago, IL 60614
MLS# 12650261Listed by: @PROPERTIES CHRISTIE'S INTERNATIONAL REAL ESTATE $899,000Pending3 beds 3 baths2,400 sq. ft.
2740 N Janssen Avenue, Chicago, IL 60614
MLS# 12646165Listed by: COMPASS $999,000Active3 beds 3 baths3,000 sq. ft.
2717 N Lehmann Court #1A, Chicago, IL 60614
MLS# 12647248Listed by: DWELL CHICAGO INC $1,049,900Pending3 beds 2 baths1,600 sq. ft.
2643 N Hermitage Avenue #202, Chicago, IL 60614
MLS# 12589912Listed by: BAIRD & WARNER $1,550,000Active4 beds 4 baths
2641 N Marshfield Avenue, Chicago, IL 60614
MLS# 12621639Listed by: REDFIN CORPORATION $699,000Active2 beds 3 baths
623 W Drummond Place #3, Chicago, IL 60614
MLS# 12646043Listed by: BAIRD & WARNER $2,175,000Pending6 beds 5 baths
2748 N Kenmore Avenue, Chicago, IL 60614
MLS# 12649246Listed by: @PROPERTIES CHRISTIE'S INTERNATIONAL REAL ESTATE $475,000Pending2 beds 2 baths
2022 N Wood Street #3N, Chicago, IL 60614
MLS# 12649411Listed by: @PROPERTIES CHRISTIE'S INTERNATIONAL REAL ESTATE $450,000Pending2 beds 2 baths
345 W Fullerton Parkway #1108, Chicago, IL 60614
MLS# 12642834Listed by: @PROPERTIES CHRISTIE'S INTERNATIONAL REAL ESTATE $700,000Pending2 beds 2 baths
1158 W Armitage Avenue #206, Chicago, IL 60614
MLS# 12647432Listed by: COLDWELL BANKER REALTY $2,750,000Active6 beds 5 baths
2743 N Dayton Street, Chicago, IL 60614
MLS# 12648775Listed by: @PROPERTIES CHRISTIE'S INTERNATIONAL REAL ESTATE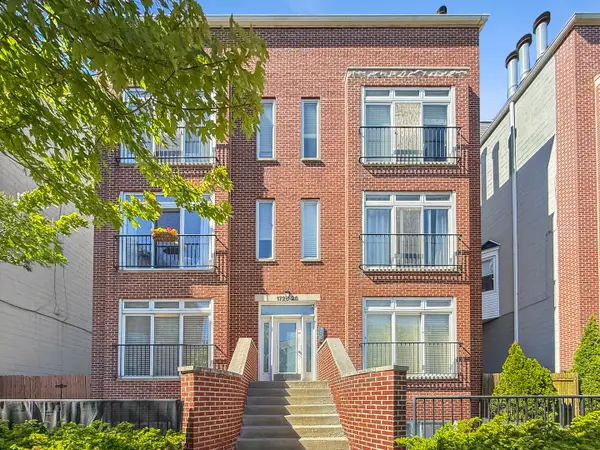 $549,000Pending2 beds 2 baths
1726 W Diversey Parkway #2E, Chicago, IL 60614
MLS# 12650510Listed by: KELLER WILLIAMS ONECHICAGO $990,000Pending3 beds 3 baths2,200 sq. ft.
2440 N Lakeview Avenue #11E, Chicago, IL 60614
MLS# 12604204Listed by: ENGEL & VOELKERS CHICAGO $1,200,000Pending4 beds 3 baths2,600 sq. ft.
1919 N Sheffield Avenue #1R, Chicago, IL 60614
MLS# 12622271Listed by: BERKSHIRE HATHAWAY HOMESERVICES CHICAGO $750,000Pending2 beds 2 baths1,380 sq. ft.
1730 N Bissell Street, Chicago, IL 60614
MLS# 12634157Listed by: BAIRD & WARNER $1,495,000Pending3 beds 3 baths2,800 sq. ft.
1635 N Larrabee Street #B, Chicago, IL 60614
MLS# 12645318Listed by: @PROPERTIES CHRISTIE'S INTERNATIONAL REAL ESTATE $3,998,000Active6 beds 7 baths6,400 sq. ft.
2658 N Mildred Avenue, Chicago, IL 60614
MLS# 12648246Listed by: COLDWELL BANKER REALTY $500,000Active3 beds 2 baths
2356 N Elston Avenue #206, Chicago, IL 60614
MLS# 12498931Listed by: RE/MAX 10 LINCOLN PARK $899,000Pending3 beds 2 baths
910 W Fullerton Avenue #2, Chicago, IL 60614
MLS# 12645333Listed by: @PROPERTIES CHRISTIE'S INTERNATIONAL REAL ESTATE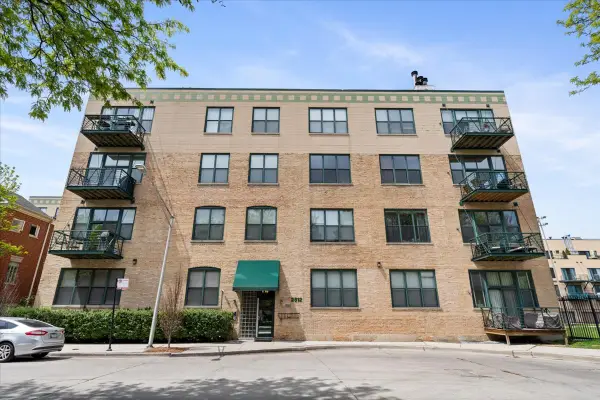 $515,000Pending2 beds 2 baths1,100 sq. ft.
2512 N Bosworth Avenue #208, Chicago, IL 60614
MLS# 12640834Listed by: COMPASS- Open Sat, 11am to 1pm
 $825,000Pending3 beds 4 baths2,200 sq. ft.
2140 N Winchester Avenue #6, Chicago, IL 60614
MLS# 12632994Listed by: REDFIN CORPORATION  $1,150,000Pending3 beds 3 baths3,700 sq. ft.
1725 N Sheffield Avenue #2, Chicago, IL 60614
MLS# 12645240Listed by: COLDWELL BANKER REALTY $1,375,000Pending4 beds 4 baths2,700 sq. ft.
344 W Willow Street #A, Chicago, IL 60614
MLS# 12647403Listed by: COMPASS $485,000Pending2 beds 2 baths
2701 N Mildred Avenue #2B, Chicago, IL 60614
MLS# 12647627Listed by: REDDEN+MCDANIEL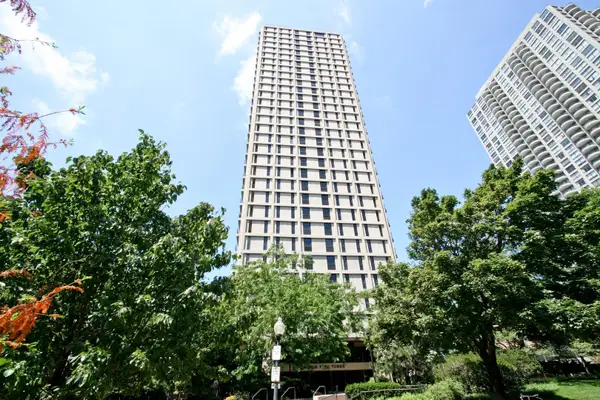 $299,900Pending1 beds 1 baths
1960 N Lincoln Park West #2611, Chicago, IL 60614
MLS# 12646965Listed by: @PROPERTIES CHRISTIE'S INTERNATIONAL REAL ESTATE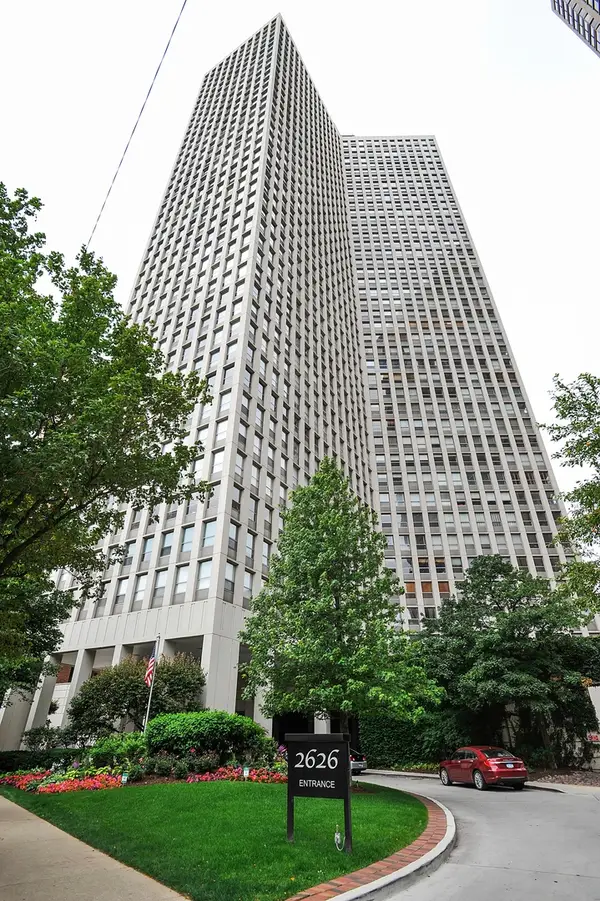 $565,000Pending2 beds 2 baths1,246 sq. ft.
2626 N Lakeview Avenue #3308, Chicago, IL 60614
MLS# 12645475Listed by: BERKSHIRE HATHAWAY HOMESERVICES CHICAGO $2,399,000Pending6 beds 6 baths4,000 sq. ft.
2447 N Greenview Avenue, Chicago, IL 60614
MLS# 12632237Listed by: BERKSHIRE HATHAWAY HOMESERVICES CHICAGO $3,299,000Pending5 beds 6 baths
2514 N Burling Street, Chicago, IL 60614
MLS# 12640275Listed by: JAMESON SOTHEBY'S INTL REALTY $525,000Pending2 beds 2 baths1,200 sq. ft.
916 W Schubert Avenue #3, Chicago, IL 60614
MLS# 12644540Listed by: CROSS STREET REAL ESTATE $265,000Pending1 beds 1 baths
1636 N Wells Street #607, Chicago, IL 60614
MLS# 12635818Listed by: KELLER WILLIAMS ONECHICAGO $1,000,000Pending3 beds 3 baths2,750 sq. ft.
2733 N Southport Avenue #1, Chicago, IL 60614
MLS# 12644490Listed by: REDFIN CORPORATION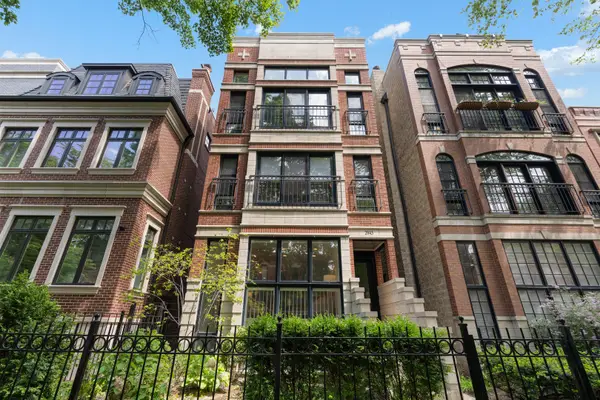 $975,000Pending3 beds 3 baths2,300 sq. ft.
2043 N Bissell Street #1, Chicago, IL 60614
MLS# 12645073Listed by: COMPASS $429,500Active2 beds 1 baths798 sq. ft.
1106 W Montana Street #1, Chicago, IL 60614
MLS# 12646291Listed by: GOLD COAST REALTY CHICAGO $1,199,000Active3 beds 3 baths
2723 N Dayton Street #1, Chicago, IL 60614
MLS# 12659183Listed by: BAIRD & WARNER $649,999Pending2 beds 2 baths1,300 sq. ft.
835 W Diversey Parkway #5, Chicago, IL 60614
MLS# 12617374Listed by: JAMESON SOTHEBY'S INTL REALTY $349,000Pending1 beds 1 baths
2705 N Mildred Avenue #3C, Chicago, IL 60614
MLS# 12645038Listed by: COMPASS $3,300,000Pending4 beds 4 baths3,500 sq. ft.
422 W Deming Place #4, Chicago, IL 60614
MLS# 12644150Listed by: COMPASS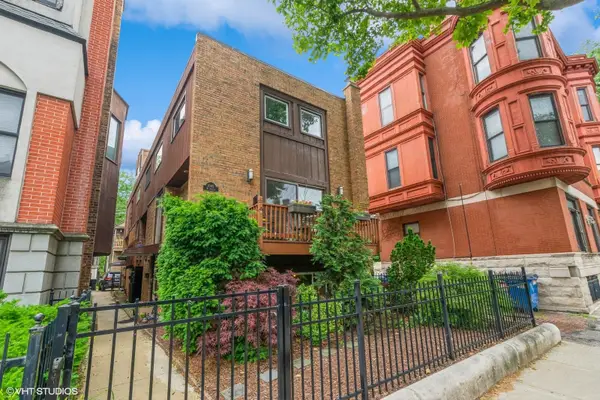 $565,000Pending2 beds 2 baths
1045 W Altgeld Street, Chicago, IL 60614
MLS# 12607148Listed by: COMPASS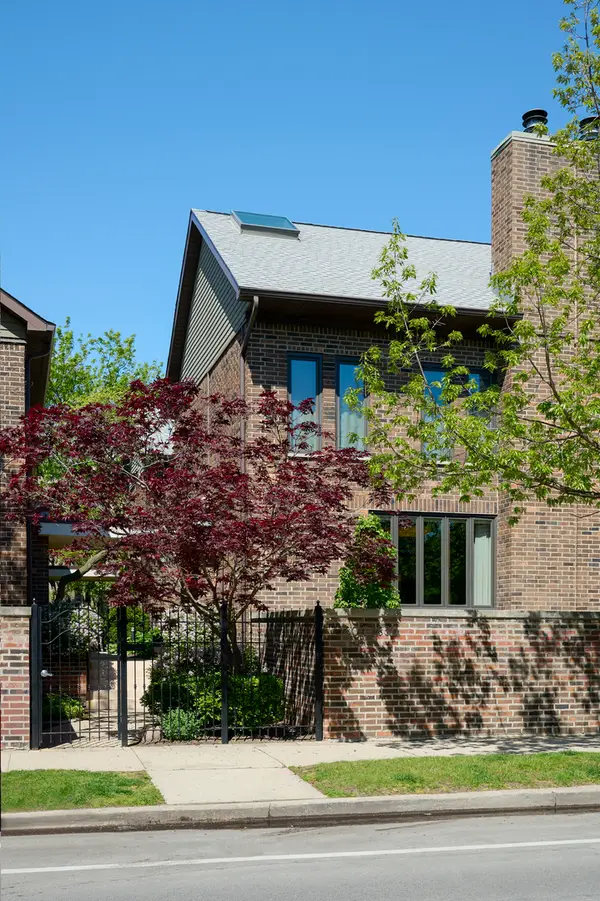 $1,199,000Pending3 beds 3 baths
1818 N Larrabee Street, Chicago, IL 60614
MLS# 12645396Listed by: @PROPERTIES CHRISTIE'S INTERNATIONAL REAL ESTATE $160,000Pending-- beds 1 baths
235 W Eugenie Street #G10, Chicago, IL 60614
MLS# 12645764Listed by: JAMESON SOTHEBY'S INTERNATIONAL REALTY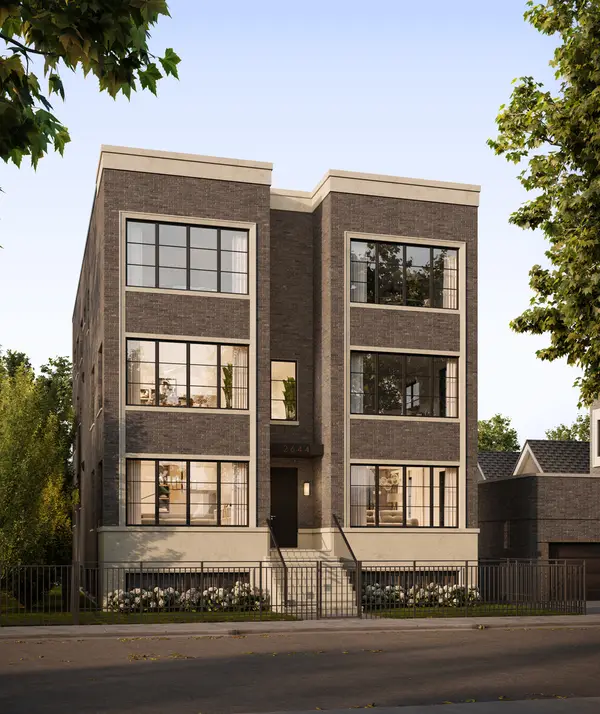 $2,030,000Pending4 beds 4 baths
2644 N Lakewood Avenue #2S, Chicago, IL 60614
MLS# 12645500Listed by: COMPASS $340,000Pending1 beds 1 baths800 sq. ft.
1660 N La Salle Drive #3809, Chicago, IL 60614
MLS# 12631550Listed by: @PROPERTIES CHRISTIE'S INTERNATIONAL REAL ESTATE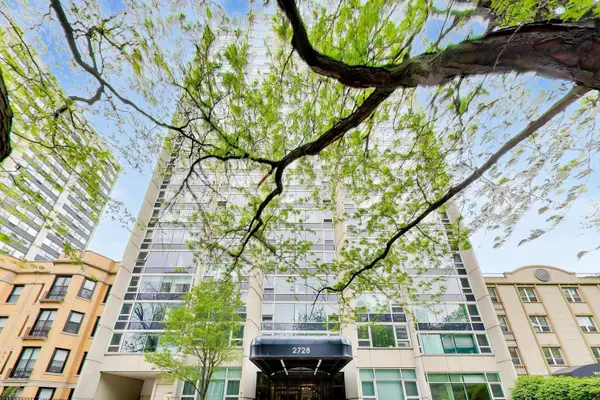 $255,000Pending1 beds 1 baths
2728 N Hampden Court #501, Chicago, IL 60614
MLS# 12643486Listed by: @PROPERTIES CHRISTIE'S INTERNATIONAL REAL ESTATE $175,000Pending-- beds 1 baths500 sq. ft.
2400 N Lakeview Avenue #1002, Chicago, IL 60614
MLS# 12644897Listed by: @PROPERTIES CHRISTIE'S INTERNATIONAL REAL ESTATE $324,999Pending1 beds 1 baths700 sq. ft.
1960 N Lincoln Park West #2106, Chicago, IL 60614
MLS# 12643340Listed by: CITY HABITAT REALTY LLC $220,000Pending1 beds 1 baths
515 W Wrightwood Avenue #217, Chicago, IL 60614
MLS# 12637063Listed by: COLDWELL BANKER REALTY $425,000Pending1 beds 2 baths950 sq. ft.
1050 W Webster Avenue #2W, Chicago, IL 60614
MLS# 12635742Listed by: @PROPERTIES CHRISTIE'S INTERNATIONAL REAL ESTATE $1,158,300Active9 beds 7 baths
2458 N Clybourn Avenue, Chicago, IL 60614
MLS# 12642956Listed by: URBAN ABODES CHICAGO $449,900Active1 beds 1 baths950 sq. ft.
2000 N Lincoln Park W #1614, Chicago, IL 60614
MLS# 12639015Listed by: EXP REALTY $475,000Active2 beds 2 baths1,085 sq. ft.
1610 W Fullerton Avenue #412, Chicago, IL 60614
MLS# 12639673Listed by: COLDWELL BANKER REAL ESTATE GROUP $7,500,000Active6 beds 8 baths9,512 sq. ft.
1878 N Orchard Street, Chicago, IL 60614
MLS# 12641485Listed by: PREMIER RELOCATION, INC. $900,000Pending2 beds 3 baths1,800 sq. ft.
2226 N Racine Avenue #15, Chicago, IL 60614
MLS# 12641892Listed by: COLDWELL BANKER REALTY $475,000Active1 beds 1 baths
2500 N Lakeview Avenue #903, Chicago, IL 60614
MLS# 12654086Listed by: @PROPERTIES CHRISTIE'S INTERNATIONAL REAL ESTATE $745,000Pending2 beds 3 baths
601 W Dickens Avenue #A2, Chicago, IL 60614
MLS# 12637093Listed by: REDFIN CORPORATION $1,195,000Pending3 beds 3 baths2,400 sq. ft.
1606 N Mohawk Street #C, Chicago, IL 60614
MLS# 12640782Listed by: COLDWELL BANKER REALTY $565,000Pending3 beds 2 baths1,500 sq. ft.
2243 N Lister Avenue #402, Chicago, IL 60614
MLS# 12654624Listed by: RE/MAX PREMIER- Open Sat, 12 to 2pm
 $1,599,000Active3 beds 3 baths
1646 N Orchard Street #2, Chicago, IL 60614
MLS# 12638312Listed by: JAMESON SOTHEBY'S INTL REALTY  $2,299,000Pending4 beds 4 baths
908 W Webster Avenue, Chicago, IL 60614
MLS# 12639667Listed by: COLDWELL BANKER REALTY $2,149,900Pending4 beds 4 baths
2660 N Hartland Court, Chicago, IL 60614
MLS# 12621237Listed by: EXP REALTY $325,000Pending1 beds 1 baths750 sq. ft.
1636 N Wells Street #1011, Chicago, IL 60614
MLS# 12648574Listed by: BERKSHIRE HATHAWAY HOMESERVICES CHICAGO $729,000Pending3 beds 3 baths1,725 sq. ft.
2541 N Racine Avenue #1, Chicago, IL 60614
MLS# 12635329Listed by: COLDWELL BANKER REALTY $600,000Pending1 beds 2 baths
2226 N Racine Avenue #7, Chicago, IL 60614
MLS# 12639423Listed by: VESTA PREFERRED LLC $979,000Pending3 beds 3 baths2,000 sq. ft.
2652 N Southport Avenue #C, Chicago, IL 60614
MLS# 12639590Listed by: @PROPERTIES CHRISTIE'S INTERNATIONAL REAL ESTATE $399,000Pending1 beds 1 baths
2510 N Wayne Avenue #304, Chicago, IL 60614
MLS# 12638686Listed by: COLDWELL BANKER REALTY $865,000Pending3 beds 3 baths
1925 N Maud Avenue #1, Chicago, IL 60614
MLS# 12612433Listed by: REDFIN CORPORATION $3,490,000Pending5 beds 7 baths5,500 sq. ft.
2140 N Clifton Avenue, Chicago, IL 60614
MLS# 12638633Listed by: @PROPERTIES CHRISTIE'S INTERNATIONAL REAL ESTATE $649,900Pending3 beds 2 baths
1705 N Clybourn Avenue #E, Chicago, IL 60614
MLS# 12616017Listed by: COMPASS $1,490,000Pending6 beds 6 baths
2444 N Sheffield Avenue, Chicago, IL 60614
MLS# 12638319Listed by: GOOD HOPE PROPERTIES LLC $1,865,000Pending3 beds 4 baths3,500 sq. ft.
2600 N Lakeview Avenue #9B, Chicago, IL 60614
MLS# 12624498Listed by: COMPASS $1,950,000Pending3 beds 3 baths
1935 N Mohawk Street #3S, Chicago, IL 60614
MLS# 12634338Listed by: FULTON GRACE REALTY $349,000Pending1 beds 1 baths1,200 sq. ft.
2440 N Lakeview Avenue #6C, Chicago, IL 60614
MLS# 12630689Listed by: BERKSHIRE HATHAWAY HOMESERVICES CHICAGO $230,000Pending1 beds 1 baths700 sq. ft.
2728 N Hampden Court #109, Chicago, IL 60614
MLS# 12635539Listed by: BERKSHIRE HATHAWAY HOMESERVICES CHICAGO $1,350,000Active4 beds 4 baths2,400 sq. ft.
1742 N Bissell Street, Chicago, IL 60614
MLS# 12636919Listed by: JAMESON SOTHEBY'S INTL REALTY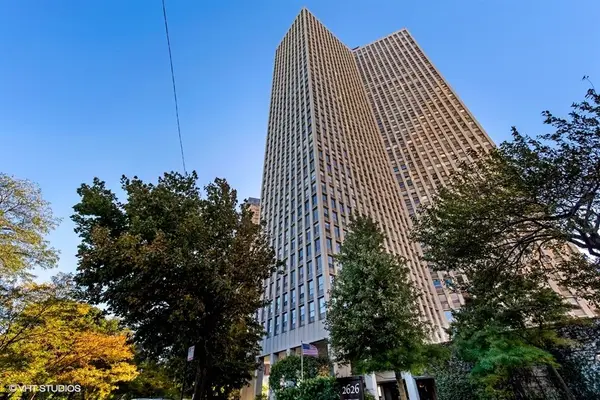 $279,900Pending1 beds 1 baths763 sq. ft.
2626 N Lakeview Avenue #1604, Chicago, IL 60614
MLS# 12632581Listed by: COLDWELL BANKER REALTY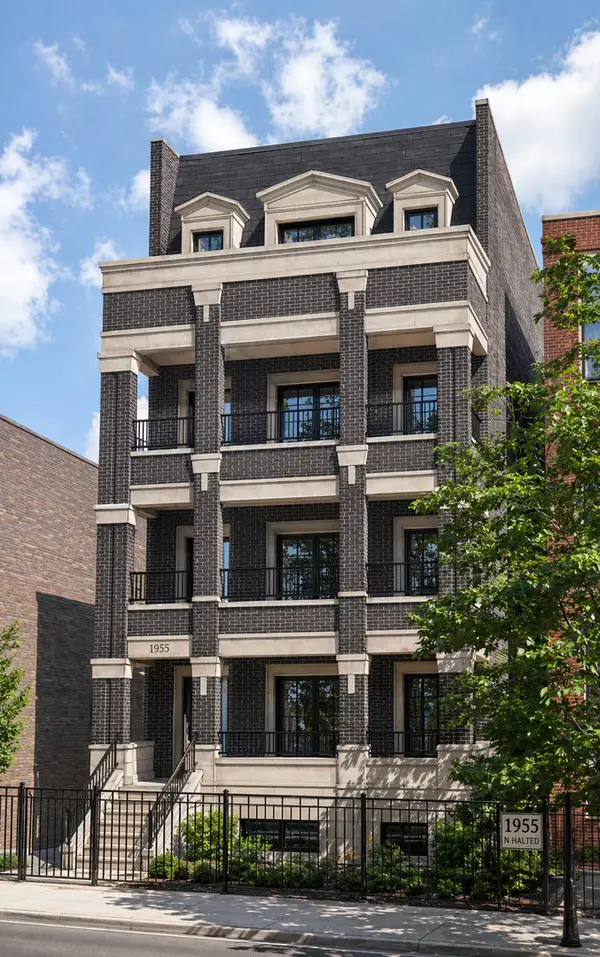 $2,750,000Pending5 beds 4 baths3,855 sq. ft.
1955 N Halsted Street #PH, Chicago, IL 60614
MLS# 12527836Listed by: COMPASS $500,000Pending2 beds 2 baths1,100 sq. ft.
345 W Fullerton Parkway #2001, Chicago, IL 60614
MLS# 12621071Listed by: JAMESON SOTHEBY'S INTL REALTY $325,000Pending1 beds 1 baths750 sq. ft.
1636 N Wells Street #3008, Chicago, IL 60614
MLS# 12629672Listed by: BERKSHIRE HATHAWAY HOMESERVICES CHICAGO $475,000Pending2 beds 2 baths
2701 N Mildred Avenue #3B, Chicago, IL 60614
MLS# 12632543Listed by: REDFIN CORPORATION $1,795,000Pending4 beds 4 baths3,500 sq. ft.
2720 N Magnolia Avenue, Chicago, IL 60614
MLS# 12629525Listed by: COMPASS $499,000Pending2 beds 1 baths1,000 sq. ft.
2608 N Lakeview Avenue #2D, Chicago, IL 60614
MLS# 12629840Listed by: JAMESON SOTHEBY'S INTL REALTY $2,500,000Active6 beds 7 baths6,500 sq. ft.
2054 N Mohawk Street, Chicago, IL 60614
MLS# 12631561Listed by: CARDONI REAL ESTATE DEVELOPMENT LLC $1,899,000Active4 beds 4 baths
2026 N Orleans Street #1N, Chicago, IL 60614
MLS# 12632143Listed by: JAMESON SOTHEBY'S INTL REALTY $575,000Active2 beds 2 baths1,200 sq. ft.
350 W Dickens Avenue #Garden, Chicago, IL 60614
MLS# 12630085Listed by: ROBERTO FUNES $335,000Pending1 beds 1 baths800 sq. ft.
1850 N Clark Street #2805, Chicago, IL 60614
MLS# 12631209Listed by: FULTON GRACE REALTY $1,349,900Pending4 beds 3 baths2,530 sq. ft.
2744 N Mildred Avenue #1, Chicago, IL 60614
MLS# 12623042Listed by: @PROPERTIES CHRISTIE'S INTERNATIONAL REAL ESTATE $1,299,000Pending4 beds 3 baths2,500 sq. ft.
2740 N Seminary Avenue #1, Chicago, IL 60614
MLS# 12627602Listed by: COMPASS $649,000Active2 beds 2 baths1,863 sq. ft.
2737 N Southport Avenue #3, Chicago, IL 60614
MLS# 12626439Listed by: MIDWEST SIGNATUREPROPERTIES CO $425,000Pending2 beds 2 baths1,100 sq. ft.
345 W Fullerton Avenue #2406, Chicago, IL 60614
MLS# 12621040Listed by: JAMESON SOTHEBY'S INTL REALTY $2,995,000Active5 beds 5 baths4,308 sq. ft.
1816 N Hudson Avenue, Chicago, IL 60614
MLS# 12354016Listed by: COLDWELL BANKER REALTY $475,000Pending2 beds 1 baths1,433 sq. ft.
1872 N Clybourn Avenue #204, Chicago, IL 60614
MLS# 12627585Listed by: COMPASS $1,200,000Pending3 beds 3 baths2,554 sq. ft.
434 W Armitage Avenue #C, Chicago, IL 60614
MLS# 12626216Listed by: ESSEX 312, LLC $2,990,000Pending6 beds 7 baths5,900 sq. ft.
1907 N Lincoln Park West Street, Chicago, IL 60614
MLS# 12624742Listed by: CONCENTRIC REALTY INC. $850,000Pending4 beds 3 baths3,200 sq. ft.
2451 N Janssen Avenue #3, Chicago, IL 60614
MLS# 12623794Listed by: JAMESON SOTHEBY'S INTL REALTY $850,000Pending3 beds 3 baths1,800 sq. ft.
1930 N Larrabee Street, Chicago, IL 60614
MLS# 12625627Listed by: @PROPERTIES CHRISTIE'S INTERNATIONAL REAL ESTATE $1,350,000Pending4 beds 4 baths3,000 sq. ft.
2680 N Orchard Street #1, Chicago, IL 60614
MLS# 12626675Listed by: COLDWELL BANKER REALTY $775,000Pending3 beds 3 baths
2736 N Hampden Court #205, Chicago, IL 60614
MLS# 12617230Listed by: @PROPERTIES CHRISTIE'S INTERNATIONAL REAL ESTATE $5,475,000Pending6 beds 8 baths8,500 sq. ft.
835 W Chalmers Place, Chicago, IL 60614
MLS# 12623835Listed by: COMPASS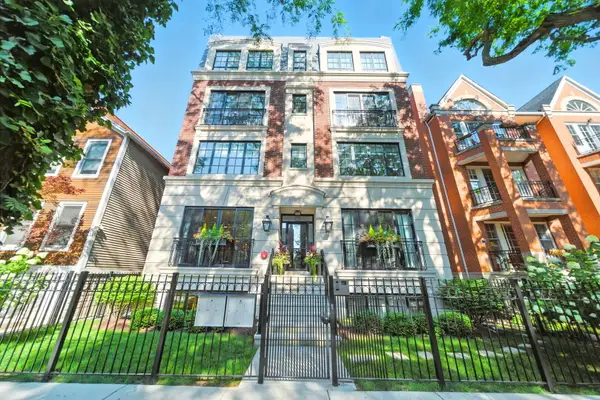 $1,799,000Pending3 beds 4 baths
1733 N Mohawk Street #1N, Chicago, IL 60614
MLS# 12625200Listed by: COMPASS $399,900Pending1 beds 2 baths1,000 sq. ft.
2625 N Ashland Avenue #1B, Chicago, IL 60614
MLS# 12609005Listed by: LEGACY PROPERTIES, A SARAH LEONARD COMPANY, LLC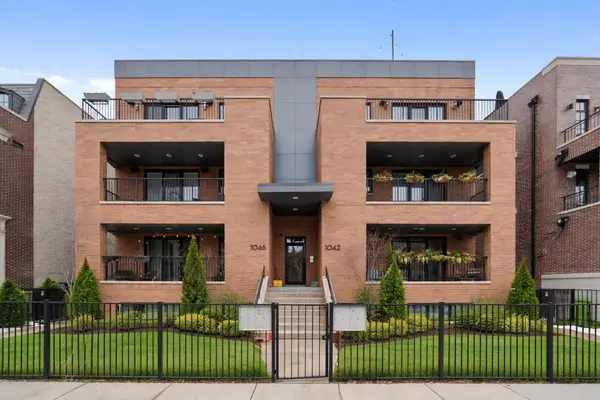 $1,495,000Pending3 beds 2 baths2,000 sq. ft.
1042 W Altgeld Street #3, Chicago, IL 60614
MLS# 12621347Listed by: AMERICORP, LTD $2,095,000Pending3 beds 3 baths2,900 sq. ft.
2042 N Burling Street #PH, Chicago, IL 60614
MLS# 12607476Listed by: @PROPERTIES CHRISTIE'S INTERNATIONAL REAL ESTATE $1,570,000Active4 beds 3 baths
2742 N Kenmore Avenue, Chicago, IL 60614
MLS# 12623692Listed by: WESTWARD PROPERTIES LLC $1,750,000Pending5 beds 9 baths4,200 sq. ft.
2664 N Hartland Court, Chicago, IL 60614
MLS# 12623363Listed by: JAMESON SOTHEBY'S INTL REALTY $399,000Pending1 beds 1 baths1,100 sq. ft.
2000 N Lincoln Park West Avenue #312, Chicago, IL 60614
MLS# 12623681Listed by: REAL PEOPLE REALTY $2,350,000Pending4 beds 4 baths
2679 N Orchard Street #PHN, Chicago, IL 60614
MLS# 12621242Listed by: MERIDIAN REAL ESTATE CHICAGO LLC $1,995,000Active4 beds 4 baths
2679 N Orchard Street #1N, Chicago, IL 60614
MLS# 12621252Listed by: MERIDIAN REAL ESTATE CHICAGO LLC $175,000Active-- beds 1 baths500 sq. ft.
2400 N Lakeview Avenue #402, Chicago, IL 60614
MLS# 12590063Listed by: IN BUSINESS REAL ESTATE $1,350,000Pending7 beds 4 baths
2248 N Southport Avenue, Chicago, IL 60614
MLS# 12620814Listed by: CL3 PROPERTY MANAGEMENT $3,895,000Pending4 beds 5 baths4,000 sq. ft.
2035 N Orleans Street #4W, Chicago, IL 60614
MLS# 12620440Listed by: PEARSON REALTY GROUP $950,000Pending3 beds 2 baths
1905 N Bissell Street #2, Chicago, IL 60614
MLS# 12619734Listed by: COMPASS $4,990,000Pending6 beds 7 baths5,200 sq. ft.
Address Withheld By Seller, Chicago, IL 60614
MLS# 12621024Listed by: @PROPERTIES CHRISTIE'S INTERNATIONAL REAL ESTATE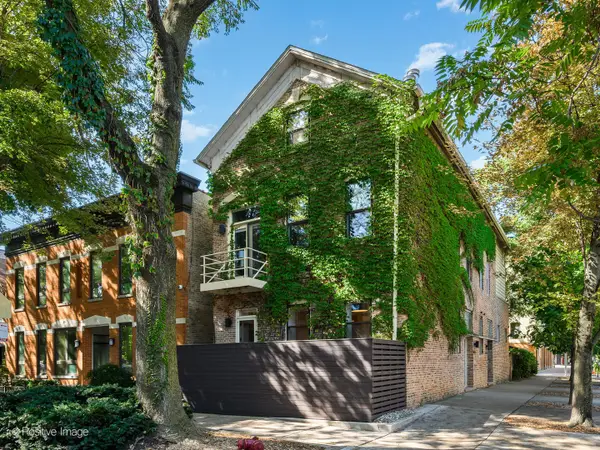 $950,000Pending3 beds 3 baths
1335 W Belden Avenue, Chicago, IL 60614
MLS# 12617339Listed by: COMPASS $3,695,000Pending6 beds 6 baths5,200 sq. ft.
2047 N Bissell Street, Chicago, IL 60614
MLS# 12603262Listed by: @PROPERTIES CHRISTIE'S INTERNATIONAL REAL ESTATE $1,895,000Pending5 beds 4 baths
1303 W Schubert Avenue, Chicago, IL 60614
MLS# 12610777Listed by: BAIRD & WARNER $1,750,000Pending3 beds 4 baths2,681 sq. ft.
540 W Webster Avenue #411, Chicago, IL 60614
MLS# 12619835Listed by: @PROPERTIES CHRISTIE'S INTERNATIONAL REAL ESTATE $195,000Active-- beds 1 baths
444 W Fullerton Parkway #305, Chicago, IL 60614
MLS# 12606014Listed by: @PROPERTIES CHRISTIE'S INTERNATIONAL REAL ESTATE $395,000Pending2 beds 1 baths
2548 N Seminary Avenue #2, Chicago, IL 60614
MLS# 12612385Listed by: BAIRD & WARNER $1,500,000Pending4 beds 3 baths
1831 N Larrabee Street #1, Chicago, IL 60614
MLS# 12617037Listed by: JAMESON SOTHEBY'S INTL REALTY $2,150,000Active3 beds 4 baths
1942 N Orchard Street #1N, Chicago, IL 60614
MLS# 12619170Listed by: COMPASS $210,000Pending1 beds 1 baths
2740 N Pine Grove Avenue #8C, Chicago, IL 60614
MLS# 12613585Listed by: COMPASS $3,995,000Active6 beds 6 baths
1816 N Lincoln Park West, Chicago, IL 60614
MLS# 12581222Listed by: COMPASS $565,000Pending2 beds 2 baths
2547 N Clark Street #2N, Chicago, IL 60614
MLS# 12613895Listed by: COMPASS $1,949,000Active3 beds 4 baths
2026 N Orleans Street #PHS, Chicago, IL 60614
MLS# 12615278Listed by: JAMESON SOTHEBY'S INTL REALTY $399,900Active0 Acres
1905 W Fullerton Avenue, Chicago, IL 60614
MLS# 12614548Listed by: GREENDOOR REALTY $395,000Pending1 beds 1 baths
2804 N Lakewood Avenue #103, Chicago, IL 60657
MLS# 12611820Listed by: COMPASS $690,000Pending3 beds 2 baths1,700 sq. ft.
1921 W Diversey Parkway #401, Chicago, IL 60614
MLS# 12587496Listed by: BAIRD & WARNER $649,000Pending2 beds 2 baths1,250 sq. ft.
2100 N Lincoln Park West #8DN, Chicago, IL 60614
MLS# 12605325Listed by: COMPASS $289,999Pending1 beds 1 baths850 sq. ft.
1660 N La Salle Drive #3208, Chicago, IL 60614
MLS# 12611391Listed by: COLDWELL BANKER REAL ESTATE GROUP $4,495,000Active5 beds 5 baths5,900 sq. ft.
1811 N Howe Street, Chicago, IL 60614
MLS# 12595802Listed by: @PROPERTIES CHRISTIE'S INTERNATIONAL REAL ESTATE $1,799,900Pending4 beds 4 baths4,000 sq. ft.
1934 N Bissell Street, Chicago, IL 60614
MLS# 12607538Listed by: COMPASS $3,500,000Pending5 beds 5 baths5,800 sq. ft.
2249 N Burling Street, Chicago, IL 60614
MLS# 12600587Listed by: @PROPERTIES CHRISTIE'S INTERNATIONAL REAL ESTATE $7,750,000Active5 beds 5 baths6,031 sq. ft.
1838 N Burling Street, Chicago, IL 60614
MLS# 12282585Listed by: JAMESON SOTHEBY'S INTL REALTY $2,799,000Active6 beds 6 baths4,500 sq. ft.
2228 N Southport Avenue, Chicago, IL 60614
MLS# 12584662Listed by: COMPASS $2,795,000Active4 beds 5 baths2,900 sq. ft.
2468 N Orchard Street #3, Chicago, IL 60614
MLS# 12602715Listed by: @PROPERTIES CHRISTIE'S INTERNATIONAL REAL ESTATE $589,000Pending2 beds 2 baths
2401 N Janssen Avenue #204, Chicago, IL 60614
MLS# 12504617Listed by: @PROPERTIES CHRISTIE'S INTERNATIONAL REAL ESTATE $289,000Pending1 beds 1 baths850 sq. ft.
1660 N La Salle Drive #1708, Chicago, IL 60614
MLS# 12600616Listed by: RED CARPET INVESTMENT GROUP IN $939,888Active3 beds 2 baths1,725 sq. ft.
2471 N Clybourn Avenue #3, Chicago, IL 60638
MLS# 12601403Listed by: COMPASS $675,000Pending2 beds 3 baths1,600 sq. ft.
2733 N Lincoln Avenue #D, Chicago, IL 60614
MLS# 12581361Listed by: COMPASS $290,000Pending1 beds 1 baths
2754 N Hampden Court #1203, Chicago, IL 60614
MLS# 12600261Listed by: FULTON GRACE REALTY $1,850,000Pending3 beds 3 baths
Address Withheld By Seller, Chicago, IL 60614
MLS# 12597561Listed by: FULTON GRACE REALTY $2,450,000Pending4 beds 3 baths2,582 sq. ft.
405 W Armitage Avenue #3N, Chicago, IL 60614
MLS# 12596320Listed by: @PROPERTIES CHRISTIE'S INTERNATIONAL REAL ESTATE $2,250,000Pending4 beds 3 baths2,351 sq. ft.
405 W Armitage Avenue #3S, Chicago, IL 60614
MLS# 12596893Listed by: @PROPERTIES CHRISTIE'S INTERNATIONAL REAL ESTATE $249,500Pending1 beds 1 baths720 sq. ft.
2754 N Hampden Court #1707, Chicago, IL 60614
MLS# 12596987Listed by: FULTON GRACE REALTY $2,250,000Pending5 beds 5 baths4,200 sq. ft.
2723 N Magnolia Avenue, Chicago, IL 60614
MLS# 12582262Listed by: BAIRD & WARNER $1,825,000Active4 beds 5 baths3,500 sq. ft.
1303 W Diversey Parkway, Chicago, IL 60614
MLS# 12588635Listed by: COMPASS $1,849,000Pending4 beds 4 baths
2026 N Orleans Street #1S, Chicago, IL 60614
MLS# 12576054Listed by: JAMESON SOTHEBY'S INTL REALTY $1,999,000Pending4 beds 4 baths
2638 N Seminary Avenue #PH, Chicago, IL 60614
MLS# 12594810Listed by: JAMESON SOTHEBY'S INTL REALTY $8,995,000Active7 beds 6 baths8,691 sq. ft.
1853 N Burling Street, Chicago, IL 60614
MLS# 12535466Listed by: @PROPERTIES CHRISTIE'S INTERNATIONAL REAL ESTATE $1,349,000Active4 beds 4 baths3,350 sq. ft.
345 W Fullerton Parkway #1801, Chicago, IL 60614
MLS# 12578739Listed by: JAMESON SOTHEBY'S INT'L REALTY $1,595,000Pending4 beds 4 baths
2638 N Seminary Avenue #1, Chicago, IL 60614
MLS# 12590381Listed by: JAMESON SOTHEBY'S INTL REALTY $2,995,000Pending4 beds 6 baths5,600 sq. ft.
2615 N Paulina Street, Chicago, IL 60614
MLS# 12576137Listed by: ENGEL & VOELKERS CHICAGO $1,999,000Pending4 beds 3 baths
2026 N Orleans Street #2, Chicago, IL 60614
MLS# 12575083Listed by: JAMESON SOTHEBY'S INTL REALTY $2,300,000Active4 beds 5 baths
1445 W Lill Avenue, Chicago, IL 60614
MLS# 12573407Listed by: BAIRD & WARNER $839,000Pending2 beds 2 baths1,600 sq. ft.
1660 N Lasalle Drive #3701-03, Chicago, IL 60614
MLS# 12565086Listed by: EXP REALTY $975,000Pending3 beds 3 baths2,500 sq. ft.
1437 W Diversey Parkway #1W, Chicago, IL 60614
MLS# 12565110Listed by: BAIRD & WARNER $1,350,000Active4 beds 2 baths
2428 N Geneva Terrace, Chicago, IL 60614
MLS# 12567138Listed by: EXP REALTY $1,725,000Active4 beds 2 baths
2424 N Geneva Terrace, Chicago, IL 60614
MLS# 12567271Listed by: EXP REALTY $425,000Active2 beds 2 baths1,200 sq. ft.
2100 N Lincoln Park West #7FN, Chicago, IL 60614
MLS# 12568921Listed by: COLDWELL BANKER GLADSTONE $4,500,000Pending6 beds 7 baths5,200 sq. ft.
2044 N Fremont Street, Chicago, IL 60614
MLS# 12561690Listed by: BERKSHIRE HATHAWAY HOMESERVICES CHICAGO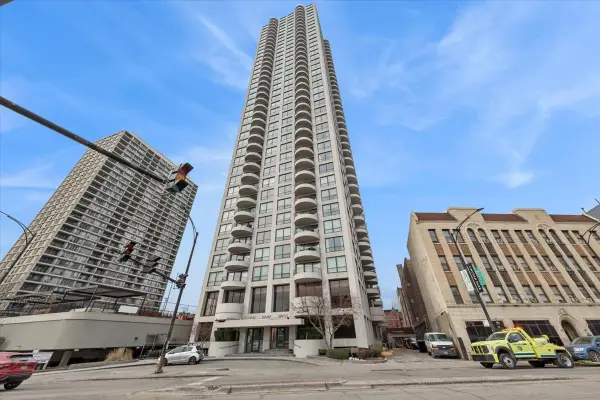 $239,000Pending-- beds 1 baths515 sq. ft.
2020 N Lincoln Park West #14B, Chicago, IL 60614
MLS# 12560044Listed by: BAIRD & WARNER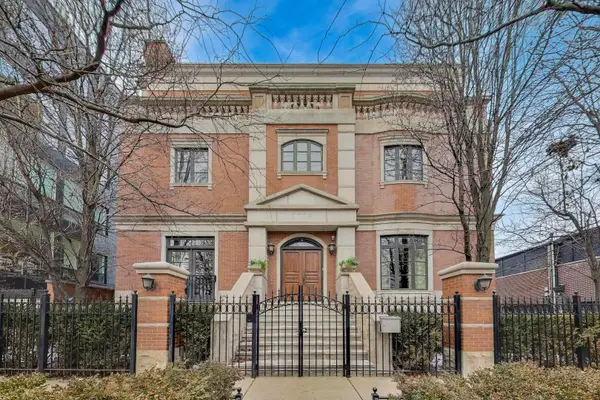
 $3,390,000Active5 beds 6 baths8,000 sq. ft.
1718 W Wrightwood Avenue, Chicago, IL 60614
MLS# 12568716Listed by: CENTURY 21 REALTY ASSOCIATES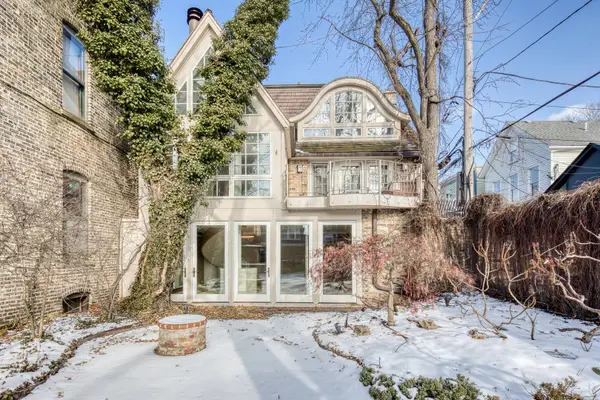 $1,750,000Active3 beds 3 baths
1706 N Fern Court, Chicago, IL 60614
MLS# 12561571Listed by: COMPASS $1,550,000Pending0.07 Acres
1324 W Wrightwood Avenue, Chicago, IL 60614
MLS# 12559426Listed by: SPERRY VAN NESS $650,000Active0 Acres
1716 N Clybourn Avenue, Chicago, IL 60614
MLS# 12545455Listed by: @PROPERTIES CHRISTIE'S INTERNATIONAL REAL ESTATE $2,995,000Pending5 beds 6 baths
1938 N Hudson Avenue, Chicago, IL 60614
MLS# 12543191Listed by: @PROPERTIES CHRISTIE'S INTERNATIONAL REAL ESTATE $4,400,000Active6 beds 7 baths5,200 sq. ft.
2119 N Seminary Avenue, Chicago, IL 60614
MLS# 12536741Listed by: MERIDIAN REAL ESTATE CHICAGO LLC $670,000Pending5 beds 3 baths
2662 N Ashland Avenue, Chicago, IL 60614
MLS# 12514364Listed by: COLDWELL BANKER REALTY $2,490,000Active11 beds 8 baths
Address Withheld By Seller, Chicago, IL 60614
MLS# 12494167Listed by: JAMESON SOTHEBY'S INTL REALTY $4,300,000Pending7 beds 7 baths6,300 sq. ft.
551 W Grant Place, Chicago, IL 60614
MLS# 12507538Listed by: COMPASS $3,658,000Pending7 beds 6 baths7,404 sq. ft.
907-909 W Webster Avenue, Chicago, IL 60614
MLS# 12493988Listed by: THE MARGIE SMIGEL GROUP, LLC $795,000Pending3 beds 2 baths1,625 sq. ft.
2471 N Clybourn Avenue #2, Chicago, IL 60614
MLS# 12560548Listed by: COMPASS $4,200,000Pending7 beds 7 baths6,300 sq. ft.
531 W Grant Place, Chicago, IL 60614
MLS# 12492062Listed by: COMPASS $4,000,000Pending6 beds 7 baths5,200 sq. ft.
2719 N Dayton Avenue, Chicago, IL 60614
MLS# 12489324Listed by: MERIDIAN REAL ESTATE CHICAGO LLC $2,750,000Active5 beds 3 baths7,500 sq. ft.
1962 N Bissell Street, Chicago, IL 60614
MLS# 12486635Listed by: THE NAV AGENCY $3,195,000Pending5 beds 6 baths5,000 sq. ft.
Address Withheld By Seller, Chicago, IL 60614
MLS# 12523960Listed by: JAMESON SOTHEBY'S INTL REALTY $6,950,000Active6 beds 7 baths6,000 sq. ft.
1865 N Burling Street, Chicago, IL 60614
MLS# 12473105Listed by: @PROPERTIES CHRISTIE'S INTERNATIONAL REAL ESTATE $4,100,000Pending7 beds 7 baths6,300 sq. ft.
545 W Grant Place, Chicago, IL 60614
MLS# 12419658Listed by: COMPASS $350,000Pending2 beds 2 baths1,200 sq. ft.
2100 N Lincoln Park West #4DN, Chicago, IL 60614
MLS# 12410874Listed by: @PROPERTIES CHRISTIES INTERNATIONAL REAL ESTATE $3,100,000Active0 Acres
2342 N Cleveland Avenue, Chicago, IL 60614
MLS# 12384367Listed by: @PROPERTIES CHRISTIE'S INTERNATIONAL REAL ESTATE $1,570,000Active3 beds 4 baths
1631 N Halsted Street, Chicago, IL 60614
MLS# 12357756Listed by: MILLENNIUM PROPERTIES RE, INC. $2,100,000Active9 beds 8 baths
1625 N Halsted Street, Chicago, IL 60614
MLS# 12357632Listed by: MILLENNIUM PROPERTIES RE, INC. $1,700,000Active3 beds 6 baths
1629 N Halsted Street, Chicago, IL 60614
MLS# 12357704Listed by: MILLENNIUM PROPERTIES RE, INC. $1,700,000Active6 beds 7 baths
1623 N Halsted Street, Chicago, IL 60614
MLS# 12357009Listed by: MILLENNIUM PROPERTIES RE, INC. $2,995,000Pending3 beds 4 baths3,430 sq. ft.
416 W Deming Place #4, Chicago, IL 60614
MLS# 12313746Listed by: COMPASS $9,995,000Active10 beds 10 baths13,400 sq. ft.
2026 N Kenmore Avenue, Chicago, IL 60614
MLS# 11985710Listed by: @PROPERTIES CHRISTIE'S INTERNATIONAL REAL ESTATE
Local realty services provided by:CENTURY 21 Affiliated
Copyright 2026 Midwest Real Estate Data LLC. All rights reserved. The data relating to real estate for sale on this web site comes in part from the Broker Reciprocity Program of the Midwest Real Estate Data LLC. Listing information is deemed reliable but not guaranteed. MLSNI Member Broker: David Try
Popular searches near 60614
Popular neighborhoods near 60614
- Bucktown, Chicago homes for sale
- East Village, Chicago homes for sale
- Gold Coast, Chicago homes for sale
- Lake View, Chicago homes for sale
- Lake View East, Chicago homes for sale
- Lincoln Park, Chicago homes for sale
- Magnificent Mile, Chicago homes for sale
- Near North Side, Chicago homes for sale
- Noble Square, Chicago homes for sale
- North Side, Chicago homes for sale
- Old Town, Chicago homes for sale
- River North, Chicago homes for sale
- River West, Chicago homes for sale
- Roscoe Village, Chicago homes for sale
- Rush & Division, Chicago homes for sale
- Sheffield & DePaul, Chicago homes for sale
- Southport Corridor, Chicago homes for sale
- West Town, Chicago homes for sale
- Wicker Park, Chicago homes for sale
- Wrigleyville, Chicago homes for sale
Counties near Chicago, 60614
- Berrien County homes for sale
- Boone County homes for sale
- Cook County homes for sale
- DeKalb County homes for sale
- DuPage County homes for sale
- Grundy County homes for sale
- Kane County homes for sale
- Kankakee County homes for sale
- Kendall County homes for sale
- Kenosha County homes for sale
- Lake County homes for sale
- Lake County homes for sale
- LaPorte County homes for sale
- McHenry County homes for sale
- Newton County homes for sale
- Porter County homes for sale
- Racine County homes for sale
- Starke County homes for sale
- Van Buren County homes for sale
- Will County homes for sale
Protect your home and budget from life's surprises with an Assurant Home Warranty, backed by a partner that supports you through every step of homeownership. Explore Plans.
©2026 Century 21 Real Estate LLC. All rights reserved. CENTURY 21®, the CENTURY 21 Logo and C21® are service marks owned by Century 21 Real Estate LLC. Century 21 Real Estate LLC fully supports the principles of the Fair Housing Act and the Equal Opportunity Act. Each office is independently owned and operated. Listing information is deemed reliable but not guaranteed accurate.