- Alsip homes for sale
- Blue Island homes for sale
- Burnham homes for sale
- Calumet homes for sale
- Calumet City homes for sale
- Calumet Park homes for sale
- Dixmoor homes for sale
- Dolton homes for sale
- Evergreen Park homes for sale
- Harvey homes for sale
- Hometown homes for sale
- Merrionette Park homes for sale
- Midlothian homes for sale
- Oak Lawn homes for sale
- Phoenix homes for sale
- Posen homes for sale
- Riverdale homes for sale
- Robbins homes for sale
- South Holland homes for sale
- Thornton Township homes for sale
60628, IL - homes for sale
227 of 227 results displayed
- New
 $165,000Active2 beds 1 baths1,480 sq. ft.
11326 S Union Avenue, Chicago, IL 60628
MLS# 12663376Listed by: EXIT STRATEGY REALTY
- New
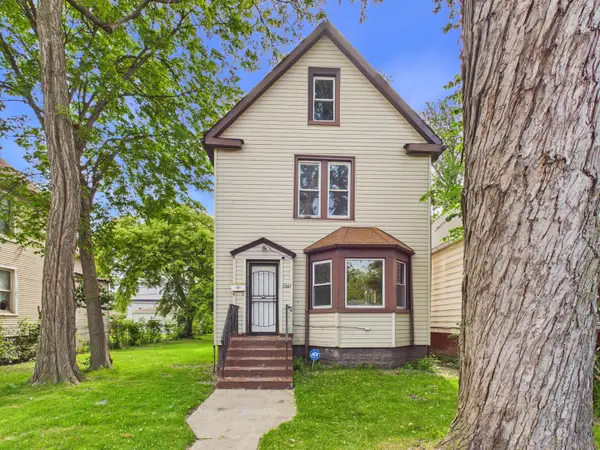 $119,900Active4 beds 2 baths1,376 sq. ft.
12047 S Michigan Avenue, Chicago, IL 60628
MLS# 12663545Listed by: RE/MAX PREMIER - New
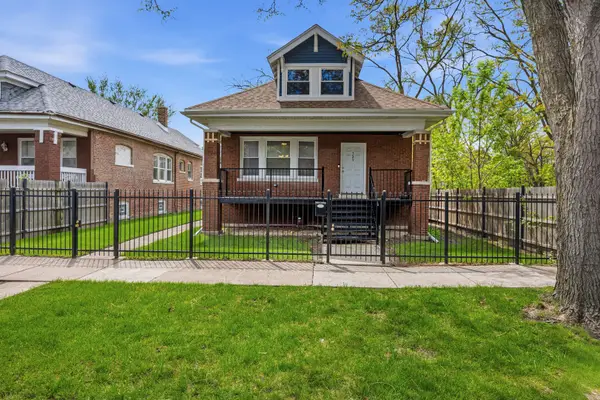
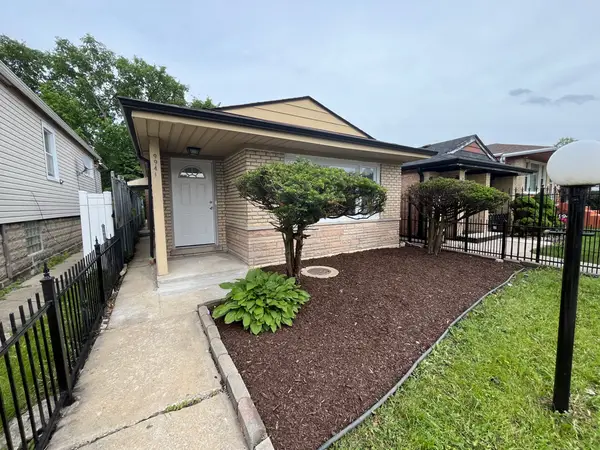 $265,900Active4 beds 2 baths1,155 sq. ft.
9941 S La Salle Street, Chicago, IL 60628
MLS# 12655871Listed by: PEARSON REALTY GROUP - New
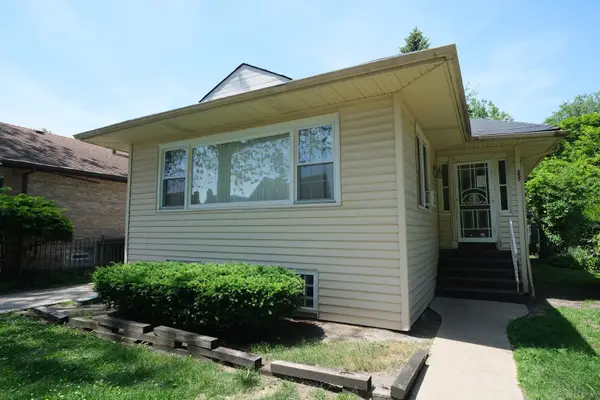
 $289,900Active5 beds 2 baths1,040 sq. ft.
1237 E 95th Street, Chicago, IL 60628
MLS# 12663221Listed by: WILK REAL ESTATE - New
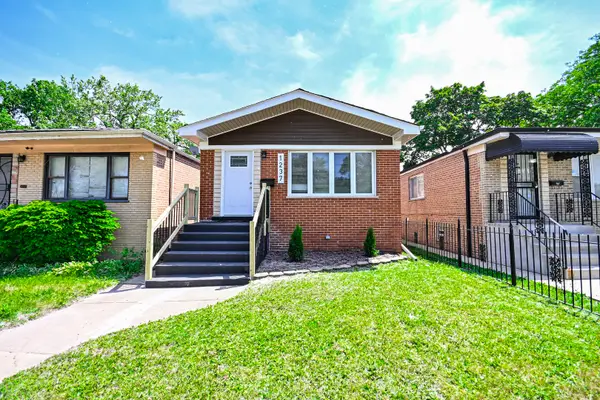
 $249,000Active4 beds 3 baths2,400 sq. ft.
11436 S Yale Avenue, Chicago, IL 60628
MLS# 12662091Listed by: DWELL - New
 $140,000Active5 beds 3 baths1,500 sq. ft.
11949 S Lafayette Avenue, Chicago, IL 60628
MLS# 12660684Listed by: EDEN PROPERTIES REAL ESTATE GROUP LLC - New
 $274,500Active3 beds 2 baths1,500 sq. ft.
738 W 129th Place, Chicago, IL 60628
MLS# 12661526Listed by: VILLAGE REALTY, INC. - New
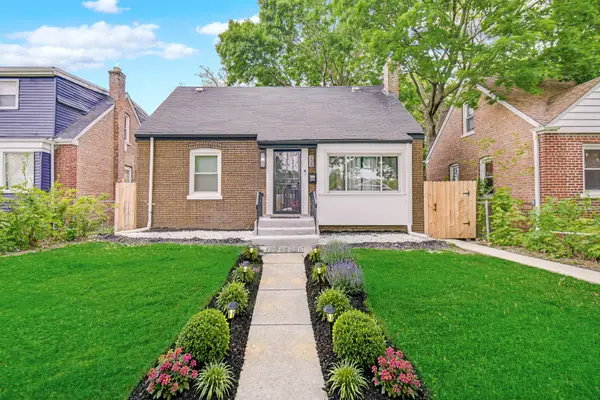
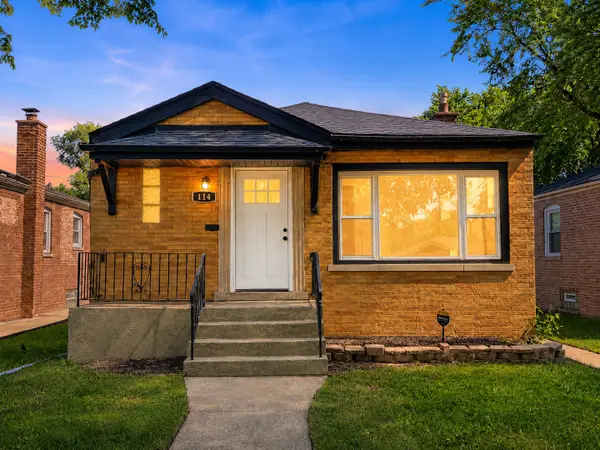 $259,900Active4 beds 2 baths2,292 sq. ft.
114 W 126th Place, Chicago, IL 60628
MLS# 12652341Listed by: CROSSTOWN REALTORS, INC. - New
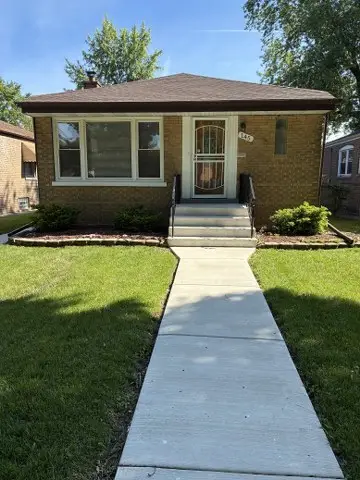 $220,000Active3 beds 1 baths1,173 sq. ft.
145 W 126th Place, Chicago, IL 60628
MLS# 12659666Listed by: CHICAGOLAND BROKERS INC. - New
 $219,900Active2 beds 2 baths1,300 sq. ft.
10449 S Vernon Avenue, Chicago, IL 60628
MLS# 12661563Listed by: GRANDVIEW REALTY, LLC - New
 $229,900Active4 beds 2 baths1,600 sq. ft.
11333 S Edbrooke Avenue, Chicago, IL 60628
MLS# 12661448Listed by: B & B REALTY INC - New
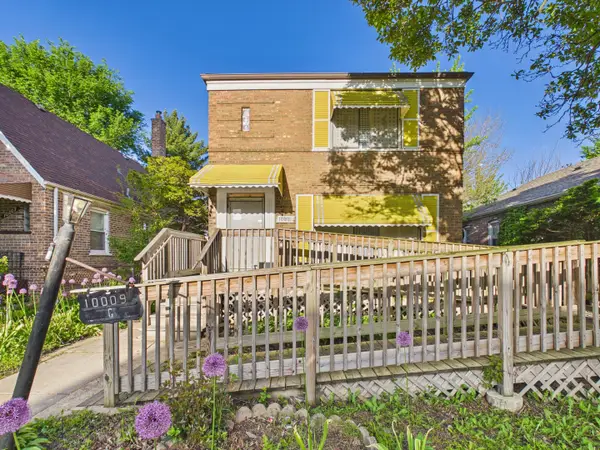 $124,900Active2 beds 2 baths1,056 sq. ft.
10009 S Emerald Avenue, Chicago, IL 60628
MLS# 12659709Listed by: RE/MAX PREMIER - New
 $175,000Active3 beds 2 baths1,200 sq. ft.
10214 S La Salle Street, Chicago, IL 60628
MLS# 12660708Listed by: REAL ESTATE GROWTH PARTNERS 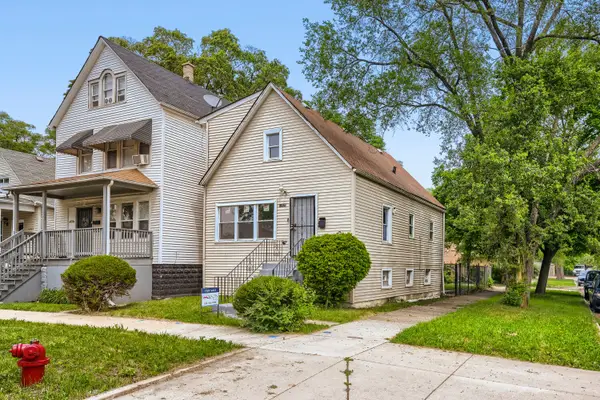 $160,000Pending3 beds 2 baths1,295 sq. ft.
12025 S Prairie Avenue, Chicago, IL 60628
MLS# 12660597Listed by: LARAINE HANSON- New
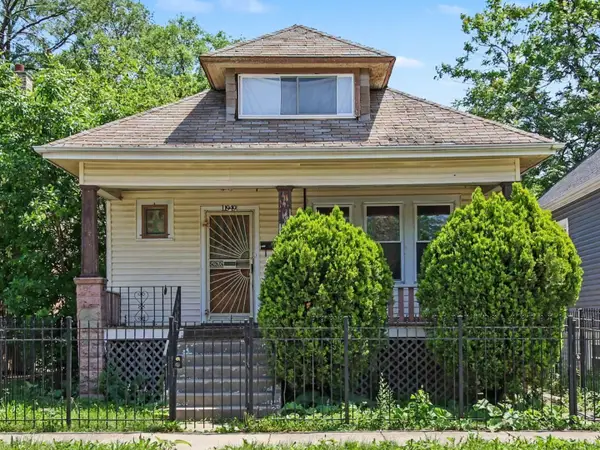
 $165,000Active4 beds 2 baths1,050 sq. ft.
265 W 107th Street, Chicago, IL 60628
MLS# 12656084Listed by: TOP CARE REALTY LLC - New
 $280,000Active4 beds 2 baths1,012 sq. ft.
10747 S Forest Avenue, Chicago, IL 60628
MLS# 12658696Listed by: REAL BROKER LLC - New
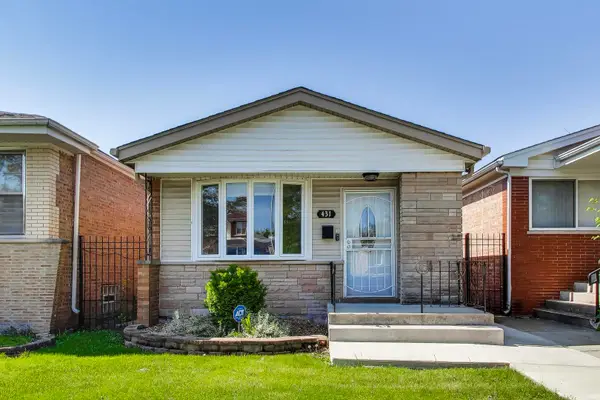 $265,000Active4 beds 2 baths1,109 sq. ft.
431 W 98th Street, Chicago, IL 60628
MLS# 12659054Listed by: COMPASS - New
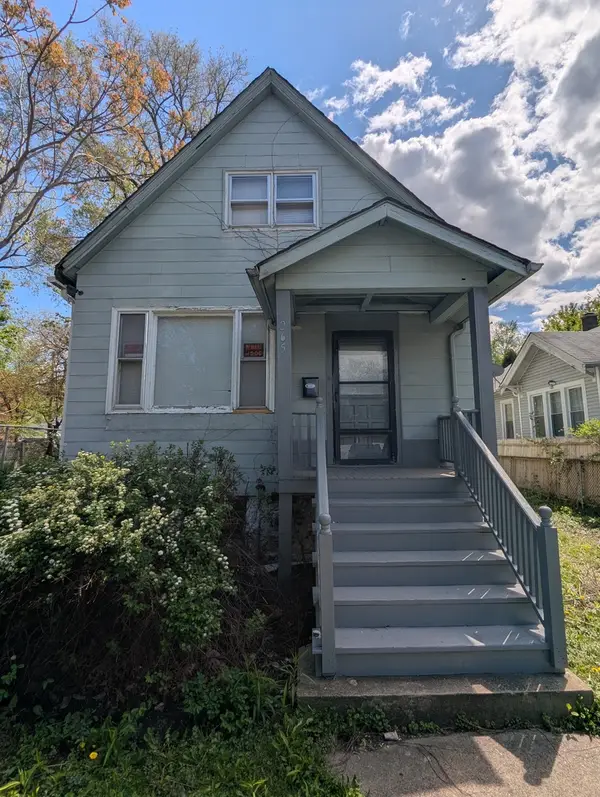
 $162,000Active3 beds 1 baths1,042 sq. ft.
306 E 118th Street, Chicago, IL 60628
MLS# 12658864Listed by: REALPROZ, LLC - New
 $325,112Active4 beds 3 baths2,034 sq. ft.
9755 S Maryland Avenue, Chicago, IL 60628
MLS# 12658390Listed by: HOMESMART REALTY GROUP - New
 $315,900Active5 beds 4 baths1,300 sq. ft.
9630 S La Salle Street, Chicago, IL 60628
MLS# 12650584Listed by: REALTY OF AMERICA - New
 $199,500Active4 beds 2 baths1,000 sq. ft.
10841 S Vernon Avenue, Chicago, IL 60628
MLS# 12650592Listed by: REALTY OF AMERICA  $79,900Pending2 beds 1 baths
12651 S Harvard Avenue, Chicago, IL 60628
MLS# 12654005Listed by: JENNINGS REALTY,INC.- New
 $85,000Active2 beds 1 baths800 sq. ft.
10026 S Indiana Avenue, Chicago, IL 60628
MLS# 12656928Listed by: VYLLA HOME - New
 $269,900Active4 beds 2 baths2,600 sq. ft.
11437 S Normal Avenue, Chicago, IL 60628
MLS# 12656929Listed by: FATHOM REALTY IL - New
 $109,900Active3 beds 1 baths1,042 sq. ft.
703 W 116th Street, Chicago, IL 60628
MLS# 12656679Listed by: RE/MAX PREMIER - New
 $115,000Active3 beds 2 baths1,200 sq. ft.
11432 S Wentworth Avenue, Chicago, IL 60628
MLS# 12558867Listed by: KALE REALTY - New
 $269,900Active6 beds 3 baths2,040 sq. ft.
135 W 109th Place, Chicago, IL 60628
MLS# 12651650Listed by: COLDWELL BANKER REALTY - New
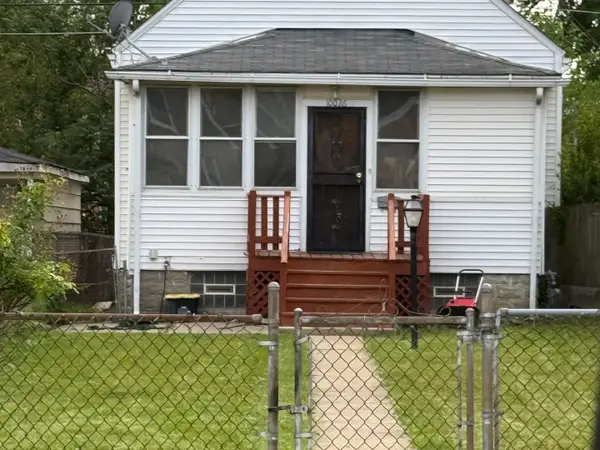
 $125,000Active2 beds 1 baths1,020 sq. ft.
10201 S Princeton Avenue, Chicago, IL 60628
MLS# 12655658Listed by: KALE REALTY - New
 $229,000Active4 beds 2 baths1,600 sq. ft.
12420 S Emerald Avenue, Chicago, IL 60628
MLS# 12654375Listed by: KALE REALTY - New
 $124,900Active3 beds 1 baths923 sq. ft.
12124 S Edbrooke Avenue, Chicago, IL 60628
MLS# 12652506Listed by: EXP REALTY  $264,900Active4 beds 2 baths833 sq. ft.
9836 S Drexel Avenue, Chicago, IL 60628
MLS# 12652419Listed by: HOMESMART CONNECT LLC $285,000Pending4 beds 2 baths1,217 sq. ft.
819 E 98th Place, Chicago, IL 60628
MLS# 12653698Listed by: KELLER WILLIAMS PREFERRED RLTY $255,000Active2 beds 2 baths805 sq. ft.
Address Withheld By Seller, Chicago, IL 60628
MLS# 12652908Listed by: F.J. WILLIAMS REALTY LLC $0Active4 beds 3 baths2,215 sq. ft.
9630 S Yale Avenue, Chicago, IL 60628
MLS# 12342178Listed by: PARKVUE REALTY CORPORATION $0Active3 beds 1 baths960 sq. ft.
9515 S Woodlawn Avenue, Chicago, IL 60628
MLS# 12614017Listed by: PARKVUE REALTY CORPORATION $0Active4 beds 1 baths1,500 sq. ft.
9640 S University Avenue, Chicago, IL 60628
MLS# 12624546Listed by: PARKVUE REALTY CORPORATION $0Active3 beds 1 baths1,009 sq. ft.
12239 S Parnell Avenue, Chicago, IL 60628
MLS# 12626355Listed by: PARKVUE REALTY CORPORATION $42,400Pending4 beds 1 baths1,344 sq. ft.
11723 S Stewart Avenue, Chicago, IL 60628
MLS# 12645914Listed by: REALHOME SERVICES & SOLUTIONS, INC. $0Active2 beds 1 baths840 sq. ft.
12837 S Union Avenue, Chicago, IL 60628
MLS# 12645938Listed by: PARKVUE REALTY CORPORATION $350,000Active5 beds 3 baths1,123 sq. ft.
10944 S Wallace Street, Chicago, IL 60628
MLS# 12652814Listed by: A PROGENY GLOBAL LLC $320,000Pending4 beds 3 baths2,664 sq. ft.
10638 S Union Avenue, Chicago, IL 60628
MLS# 12651279Listed by: KELLER WILLIAMS PREFERRED RLTY $229,888Active5 beds 2 baths1,800 sq. ft.
11916 S Stewart Avenue, Chicago, IL 60628
MLS# 12649711Listed by: EXAREALTY LLC $275,000Active3 beds 4 baths2,397 sq. ft.
10540 S Maryland Avenue, Chicago, IL 60628
MLS# 12651395Listed by: REDFIN CORPORATION $309,900Active4 beds 3 baths1,296 sq. ft.
12211 S Lafayette Avenue, Chicago, IL 60628
MLS# 12651221Listed by: LUNA REALTY GROUP $299,000Pending5 beds 2 baths2,136 sq. ft.
12628 S Emerald Avenue, Chicago, IL 60628
MLS# 12651079Listed by: RE/MAX 10 $185,000Pending3 beds 2 baths1,384 sq. ft.
10211 S Eberhart Avenue, Chicago, IL 60628
MLS# 12643504Listed by: EXP REALTY $129,900Active6 beds 3 baths1,968 sq. ft.
11941 S La Salle Street, Chicago, IL 60628
MLS# 12650200Listed by: NEW MARKET REALTY INC $239,999Pending3 beds 2 baths1,800 sq. ft.
10339 S Calumet Avenue, Chicago, IL 60628
MLS# 12649174Listed by: COMPASS $149,900Active3 beds 2 baths864 sq. ft.
32 W 110th Place, Chicago, IL 60628
MLS# 12649555Listed by: PIP REALTY GROUP $219,900Active3 beds 2 baths924 sq. ft.
10504 S Lafayette Avenue, Chicago, IL 60628
MLS# 12649593Listed by: URBANITAS INC. $129,900Pending5 beds 3 baths1,080 sq. ft.
53 E 101st Street, Chicago, IL 60628
MLS# 12649710Listed by: PIP REALTY GROUP- New
 $299,999Active5 beds 2 baths2,406 sq. ft.
11412 S King Drive, Chicago, IL 60628
MLS# 12658286Listed by: KELLER WILLIAMS THRIVE  $140,000Active3 beds 3 baths1,272 sq. ft.
10031 S Forest Avenue, Chicago, IL 60628
MLS# 12649067Listed by: WILK REAL ESTATE $185,000Pending3 beds 2 baths1,033 sq. ft.
12484 S Michigan Avenue, Chicago, IL 60628
MLS# 12647652Listed by: REALTY OF AMERICA, LLC $159,900Pending3 beds 2 baths1,090 sq. ft.
12400 S Lowe Avenue, Chicago, IL 60628
MLS# 12645255Listed by: PARKVUE REALTY CORPORATION $268,500Active4 beds 2 baths1,634 sq. ft.
12432 S State Street, Chicago, IL 60628
MLS# 12648759Listed by: RE/MAX MI CASA $142,250Active2 beds 1 baths1,019 sq. ft.
10845 S Emerald Avenue, Chicago, IL 60628
MLS# 12648065Listed by: APEX PROPERTY INSIGHT, INC $239,900Active4 beds 4 baths1,869 sq. ft.
11000 S Normal Avenue, Chicago, IL 60628
MLS# 12648672Listed by: KERI HIR $59,900Active2 beds 1 baths864 sq. ft.
650 E 105th Place, Chicago, IL 60628
MLS# 12648333Listed by: LOOP REALTY FIRM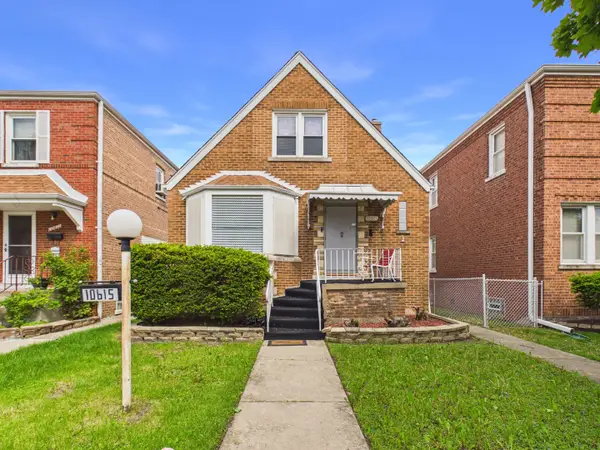 $209,900Pending4 beds 2 baths1,850 sq. ft.
10615 S Vernon Avenue, Chicago, IL 60628
MLS# 12642988Listed by: RE/MAX PREMIER $125,000Pending3 beds 3 baths1,426 sq. ft.
10508 S Forest Avenue, Chicago, IL 60628
MLS# 12644620Listed by: DELTA REALTY, CORP. $124,900Active3 beds 1 baths1,155 sq. ft.
9633 S Princeton Avenue, Chicago, IL 60628
MLS# 12642778Listed by: PARKVUE REALTY CORPORATION $184,900Active3 beds 1 baths1,206 sq. ft.
12529 S Edbrooke Avenue, Chicago, IL 60628
MLS# 12645078Listed by: C T K REALTY INC. $269,900Pending4 beds 3 baths1,514 sq. ft.
10210 S Rhodes Avenue, Chicago, IL 60628
MLS# 12646607Listed by: STAGES REAL ESTATE LLC $159,000Active3 beds 1 baths792 sq. ft.
10423 S State Street, Chicago, IL 60628
MLS# 12645172Listed by: TOP CARE REALTY LLC $300,000Pending4 beds 2 baths2,100 sq. ft.
9754 S Harvard Avenue, Chicago, IL 60628
MLS# 12641633Listed by: COLDWELL BANKER REALTY $284,999Active4 beds 2 baths891 sq. ft.
123 W 104th Place, Chicago, IL 60628
MLS# 12642964Listed by: SOLARIS ENTERPRISES INC $239,900Active3 beds 1 baths1,786 sq. ft.
11349 S Saint Lawrence Avenue, Chicago, IL 60628
MLS# 12643119Listed by: RE/MAX CORNERSTONE $169,900Active3 beds 1 baths1,100 sq. ft.
11741 S Wentworth Avenue, Chicago, IL 60628
MLS# 12642947Listed by: CIRCLE ONE REALTY $315,000Pending5 beds 3 baths1,921 sq. ft.
10429 S Indiana Avenue, Chicago, IL 60628
MLS# 12642435Listed by: JAMESON SOTHEBY'S INTL REALTY $165,000Pending3 beds 2 baths1,171 sq. ft.
10433 S Corliss Avenue, Chicago, IL 60628
MLS# 12640848Listed by: OPTION PREMIER LLC $264,900Pending3 beds 2 baths2,001 sq. ft.
9825 S Avalon Avenue, Chicago, IL 60628
MLS# 12640513Listed by: STEELE REALTY GROUP, INC. $169,900Pending3 beds 2 baths1,200 sq. ft.
317 E 107th Street, Chicago, IL 60628
MLS# 12641134Listed by: EXP REALTY $269,900Active5 beds 2 baths1,750 sq. ft.
12112 S Indiana Avenue, Chicago, IL 60628
MLS# 12632513Listed by: REDFIN CORPORATION $274,900Active5 beds 2 baths1,680 sq. ft.
9709 S Avalon Avenue, Chicago, IL 60628
MLS# 12652993Listed by: KELLER WILLIAMS THRIVE $289,999Active4 beds 2 baths2,500 sq. ft.
10954 S Normal Avenue, Chicago, IL 60628
MLS# 12638011Listed by: REALTY OF AMERICA, LLC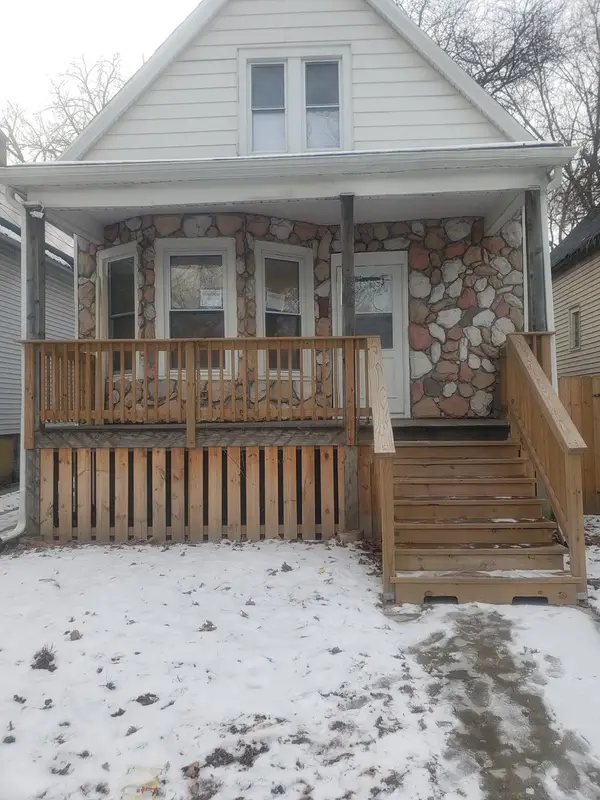 $197,999Pending4 beds 2 baths2,250 sq. ft.
12130 S Lowe Avenue, Chicago, IL 60628
MLS# 12638745Listed by: RICE PROPERTY MANAGEMENT & REALTY L.L.C. $70,000Pending3 beds 2 baths920 sq. ft.
10204 S Lafayette Avenue, Chicago, IL 60628
MLS# 12638373Listed by: PROSALES REALTY $36,400Pending2 beds 2 baths760 sq. ft.
42 W 105th Street, Chicago, IL 60628
MLS# 12552322Listed by: REALHOME SERVICES & SOLUTIONS, INC.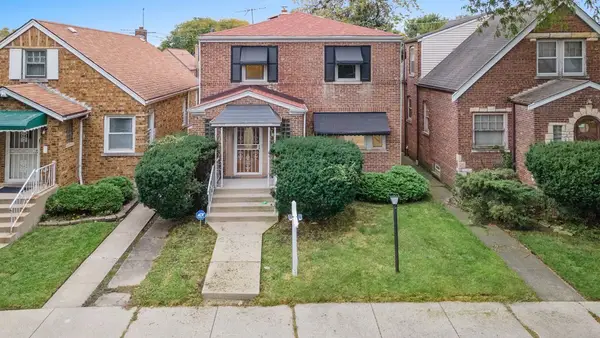 $279,000Active3 beds 3 baths1,500 sq. ft.
10231 S Rhodes Avenue, Chicago, IL 60628
MLS# 12637743Listed by: REALTY OF AMERICA, LLC- Open Sat, 1 to 2:30pm
 $249,000Pending4 beds 2 baths1,295 sq. ft.
131 W 108th Street, Chicago, IL 60628
MLS# 12631299Listed by: @PROPERTIES CHRISTIE'S INTERNATIONAL REAL ESTATE  $84,700Pending4 beds 1 baths1,099 sq. ft.
12337 S Emerald Avenue, Chicago, IL 60628
MLS# 12634434Listed by: KELLER WILLIAMS THRIVE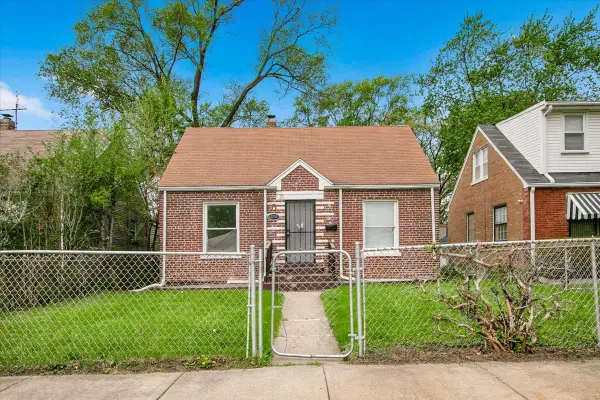 $139,000Active5 beds 3 baths1,300 sq. ft.
12908 S Wallace Street, Chicago, IL 60628
MLS# 12636185Listed by: CIRCLE ONE REALTY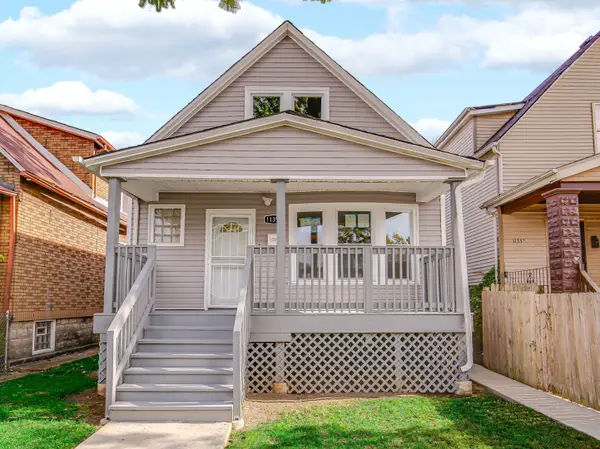 $259,999Active4 beds 3 baths1,600 sq. ft.
11353 S Stewart Avenue, Chicago, IL 60628
MLS# 12634796Listed by: KELLER WILLIAMS ONECHICAGO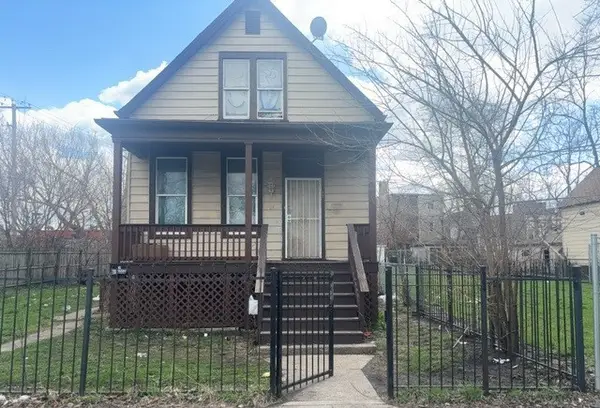 $65,000Pending4 beds 2 baths1,598 sq. ft.
17 W 110th Place, Chicago, IL 60628
MLS# 12634741Listed by: FOUR SEASONS REALTY, INC.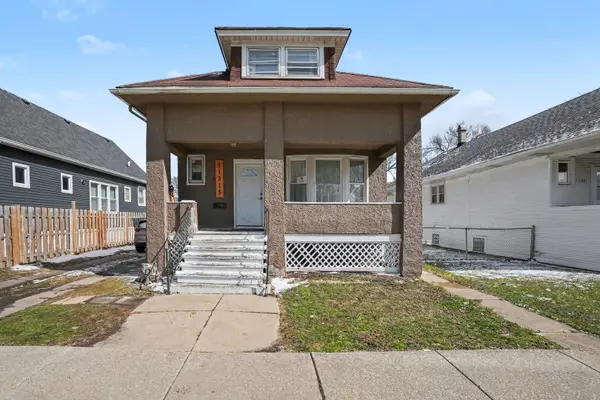 $270,000Pending5 beds 3 baths1,879 sq. ft.
11315 S Stewart Avenue, Chicago, IL 60628
MLS# 12650309Listed by: COLDWELL BANKER REALTY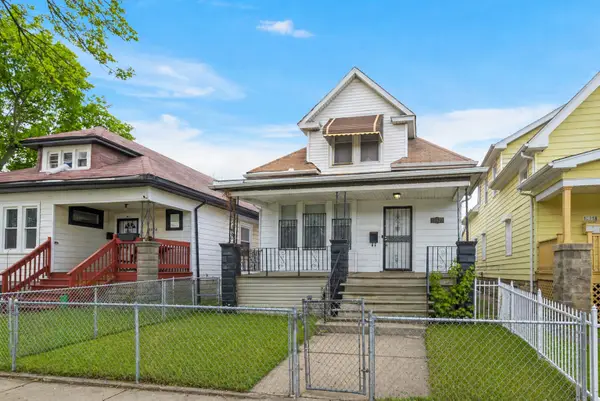 $175,000Active6 beds 2 baths2,000 sq. ft.
10320 S Indiana Avenue, Chicago, IL 60628
MLS# 12634394Listed by: CHICAGOLAND BROKERS INC. $375,000Active4 beds 3 baths2,500 sq. ft.
Address Withheld By Seller, Chicago, IL 60628
MLS# 12635218Listed by: METROPOLITAN REALTY & INVEST. $205,000Active3 beds 1 baths1,476 sq. ft.
11945 S Yale Avenue, Chicago, IL 60628
MLS# 12634226Listed by: REDFIN CORPORATION $299,900Pending5 beds 2 baths1,500 sq. ft.
11440 S Indiana Avenue, Chicago, IL 60628
MLS# 12633953Listed by: URBANITAS INC. $159,900Active3 beds 2 baths969 sq. ft.
346 W 115th Street, Chicago, IL 60628
MLS# 12633021Listed by: VILLAGE REALTY, INC. $229,900Active3 beds 2 baths1,216 sq. ft.
11223 S Forrestville Avenue, Chicago, IL 60628
MLS# 12633794Listed by: RE/MAX 10 $255,000Active4 beds 3 baths2,774 sq. ft.
9549 S Calumet Avenue, Chicago, IL 60628
MLS# 12632371Listed by: @PROPERTIES CHRISTIE'S INTERNATIONAL REAL ESTATE $219,000Active5 beds 2 baths1,200 sq. ft.
442 W 117th Street, Chicago, IL 60628
MLS# 12629386Listed by: KALE REALTY $324,900Pending5 beds 3 baths1,233 sq. ft.
11326 S Parnell Avenue, Chicago, IL 60628
MLS# 12626530Listed by: AT HOME REALTY GROUP, INC. $199,900Active2 beds 2 baths960 sq. ft.
12511 S State Street, Chicago, IL 60628
MLS# 12625241Listed by: PARKVUE REALTY CORPORATION $100,000Pending3 beds 2 baths1,500 sq. ft.
9761 S Ingleside Avenue, Chicago, IL 60628
MLS# 12626050Listed by: HOMESMART REALTY GROUP $225,000Pending3 beds 2 baths1,060 sq. ft.
9520 S Yale Avenue, Chicago, IL 60628
MLS# 12617143Listed by: COLDWELL BANKER REALTY $289,000Pending5 beds 3 baths1,158 sq. ft.
10557 S Indiana Avenue, Chicago, IL 60628
MLS# 12624525Listed by: COLDWELL BANKER REALTY $113,500Active3 beds 2 baths912 sq. ft.
65 W 112th Place, Chicago, IL 60628
MLS# 12623840Listed by: SU FAMILIA REAL ESTATE INC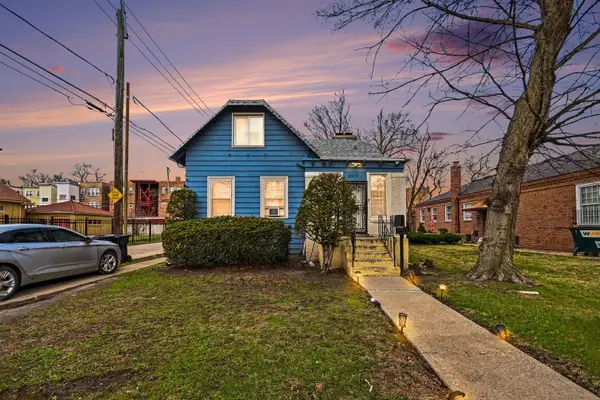 $230,000Active3 beds 2 baths1,204 sq. ft.
11110 S Union Avenue, Chicago, IL 60628
MLS# 12610046Listed by: SHOPPING CASAS CHICAGO LLC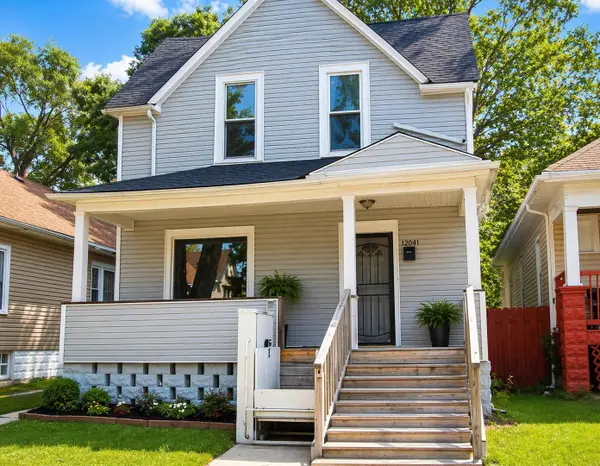 $175,000Active5 beds 3 baths1,920 sq. ft.
12041 S Normal Avenue, Chicago, IL 60628
MLS# 12623096Listed by: EXIT STRATEGY REALTY $359,000Pending4 beds 3 baths3,750 sq. ft.
10141 S Emerald Avenue, Chicago, IL 60628
MLS# 12613568Listed by: LENNOX REALTY LLC $275,000Active5 beds 2 baths1,040 sq. ft.
237 W 117th Street, Chicago, IL 60628
MLS# 12620862Listed by: RE/MAX 10 $75,000Pending2 beds 1 baths960 sq. ft.
12469 S Wabash Avenue, Chicago, IL 60628
MLS# 12620068Listed by: TRADEMARKS & ASSOCIATES $139,900Pending3 beds 2 baths1,492 sq. ft.
10209 S Vernon Avenue, Chicago, IL 60628
MLS# 12620166Listed by: PEARSON REALTY GROUP $299,900Pending5 beds 2 baths2,000 sq. ft.
11038 S Eberhart Avenue, Chicago, IL 60628
MLS# 12608856Listed by: EXP REALTY $179,900Pending3 beds 1 baths1,196 sq. ft.
12120 S Parnell Avenue, Chicago, IL 60628
MLS# 12613869Listed by: PARKVUE REALTY CORPORATION $145,000Pending3 beds 1 baths1,200 sq. ft.
10100 S Saint Lawrence Avenue, Chicago, IL 60628
MLS# 12618101Listed by: KELLER WILLIAMS ONECHICAGO $169,000Active2 beds 2 baths3,690 sq. ft.
12632 S Emerald Avenue, Chicago, IL 60628
MLS# 12618986Listed by: WEICHERT, REALTORS - ALL PRO $171,000Active3 beds 2 baths1,062 sq. ft.
9726 S La Salle Street, Chicago, IL 60628
MLS# 12617692Listed by: TRADEMARKS & ASSOCIATES
 $385,000Pending6 beds 4 baths
62 W 113th Street, Chicago, IL 60628
MLS# 12618040Listed by: CENTURY 21 S.G.R., INC. $289,900Pending5 beds 3 baths2,200 sq. ft.
Address Withheld By Seller, Chicago, IL 60628
MLS# 12614082Listed by: MAJESTIC REAL ESTATE COMPANY $210,000Active4 beds 2 baths1,525 sq. ft.
Address Withheld By Seller, Chicago, IL 60628
MLS# 12617233Listed by: CHARLES RUTENBERG REALTY $325,000Active4 beds 3 baths1,600 sq. ft.
10615 S Emerald Avenue, Chicago, IL 60628
MLS# 12616809Listed by: KELLER WILLIAMS ONECHICAGO $89,000Active4 beds 3 baths1,820 sq. ft.
12108 S Parnell Avenue, Chicago, IL 60628
MLS# 12617134Listed by: COLDWELL BANKER REALTY $99,700Pending3 beds 1 baths946 sq. ft.
116 W 108th Street, Chicago, IL 60628
MLS# 12614156Listed by: MANIFEST HOMES CORPORATION $113,000Pending3 beds 1 baths1,496 sq. ft.
12417 S Wentworth Avenue, Chicago, IL 60628
MLS# 12615896Listed by: REALTY OF AMERICA, LLC $120,000Active3 beds 3 baths1,800 sq. ft.
11224 S Stewart Avenue, Chicago, IL 60628
MLS# 12615016Listed by: EXIT INFINITY REALTY $239,900Pending4 beds 2 baths4,674 sq. ft.
12106 S Emerald Avenue, Chicago, IL 60628
MLS# 12467455Listed by: KELLER WILLIAMS PREFERRED RLTY $155,000Active3 beds 3 baths1,500 sq. ft.
11722 S Parnell Avenue, Chicago, IL 60628
MLS# 12608793Listed by: REAL PEOPLE REALTY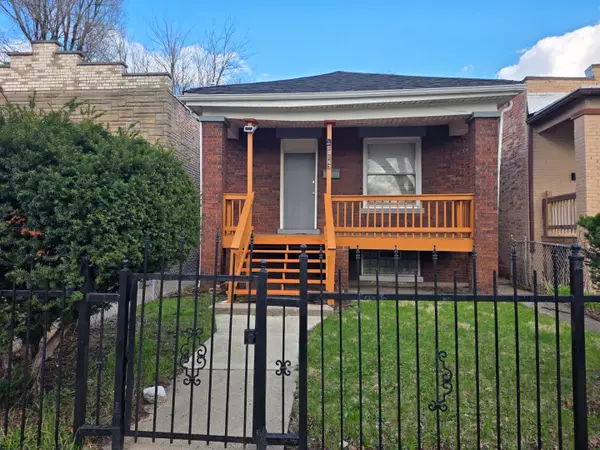 $149,000Active3 beds 2 baths840 sq. ft.
10147 S State Street, Chicago, IL 60628
MLS# 12613984Listed by: REAL PEOPLE REALTY $275,000Active4 beds 3 baths1,500 sq. ft.
10032 S Calumet Avenue, Chicago, IL 60628
MLS# 12612029Listed by: CHICAGOLAND BROKERS, INC. $269,900Pending4 beds 2 baths1,700 sq. ft.
12044 S Perry Avenue, Chicago, IL 60628
MLS# 12613696Listed by: PAVILION REALTY LLC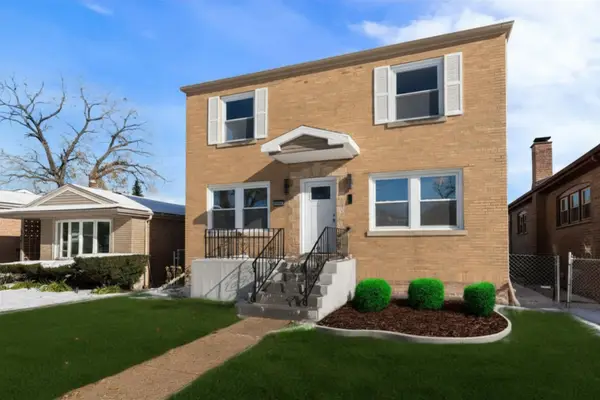 $369,000Active5 beds 3 baths2,450 sq. ft.
9633 S Yale Avenue, Chicago, IL 60628
MLS# 12611180Listed by: COLDWELL BANKER REALTY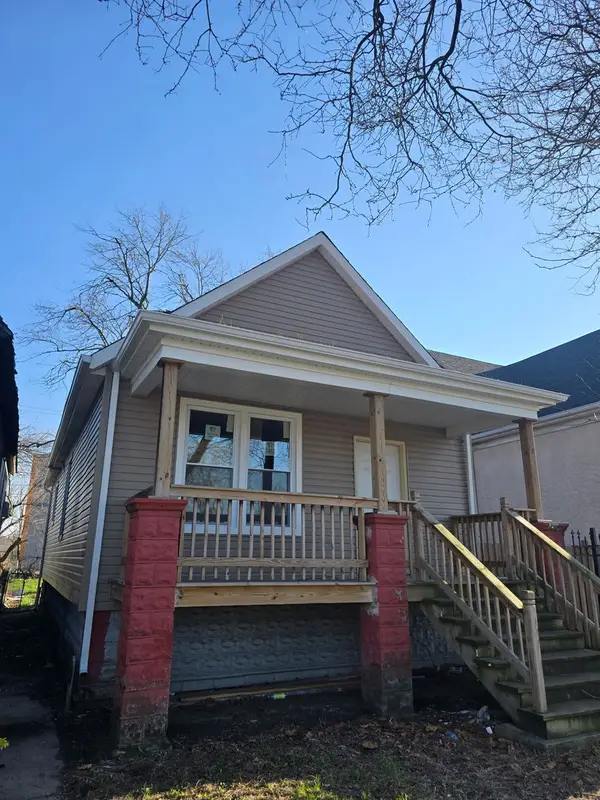 $80,000Active3 beds 1 baths840 sq. ft.
339 W 110th Place, Chicago, IL 60628
MLS# 12612525Listed by: NEXTHOME DREAM BIG REALTY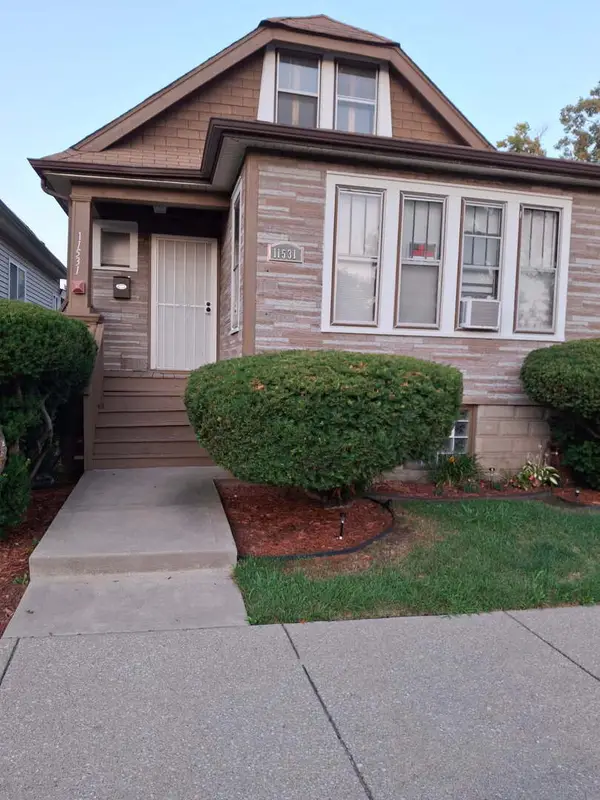 $200,000Pending5 beds 1 baths1,103 sq. ft.
11531 S Stewart Avenue, Chicago, IL 60628
MLS# 12604237Listed by: EXIT STRATEGY REALTY $289,000Active4 beds 3 baths1,000 sq. ft.
10755 S Vernon Avenue, Chicago, IL 60628
MLS# 12611782Listed by: REAL PEOPLE REALTY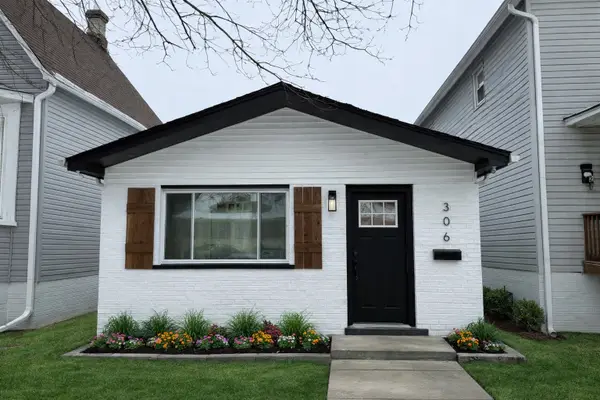 $229,900Pending4 beds 2 baths1,400 sq. ft.
304 W 111th Street, Chicago, IL 60628
MLS# 12609486Listed by: HOMESMART REALTY GROUP $180,000Active3 beds 1 baths1,327 sq. ft.
11217 S Eggleston Avenue, Chicago, IL 60628
MLS# 12608541Listed by: REDFIN CORPORATION $124,900Pending4 beds 3 baths2,000 sq. ft.
11741 S Stewart Avenue, Chicago, IL 60628
MLS# 12608829Listed by: EXAREALTY LLC $99,900Active3 beds 2 baths1,320 sq. ft.
18 W 114th Street, Chicago, IL 60628
MLS# 12607424Listed by: AREA WIDE REALTY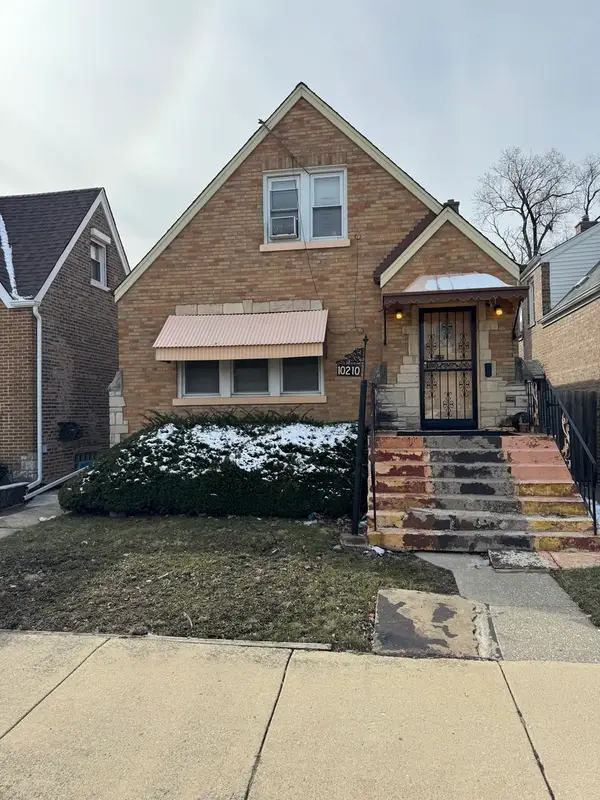 $150,000Pending4 beds 2 baths1,158 sq. ft.
10210 S Prairie Avenue, Chicago, IL 60628
MLS# 12607609Listed by: POWER REALTY CHICAGOLAND,PLLC $174,900Pending3 beds 1 baths1,160 sq. ft.
12416 S Princeton Avenue, Chicago, IL 60628
MLS# 12590289Listed by: DORAZIO REAL ESTATE LLC $65,000Active6 beds 3 baths2,107 sq. ft.
11841 S Union Avenue, Chicago, IL 60628
MLS# 12595541Listed by: COLDWELL BANKER REALTY $239,900Active6 beds 3 baths
1 E 114th Street, Chicago, IL 60628
MLS# 12603665Listed by: CENTURY 21 S.G.R., INC. $273,500Active4 beds 2 baths1,325 sq. ft.
10411 S Vernon Avenue, Chicago, IL 60628
MLS# 12604576Listed by: BLUE MASTER LLC $145,000Active2 beds 1 baths870 sq. ft.
9553 S Greenwood Avenue, Chicago, IL 60628
MLS# 12604540Listed by: BLUE DOOR DAVE INC $279,900Pending4 beds 2 baths1,077 sq. ft.
12423 S Normal Avenue, Chicago, IL 60628
MLS# 12604265Listed by: REMAX LEGENDS $181,000Pending4 beds 2 baths1,714 sq. ft.
10230 S Parnell Avenue, Chicago, IL 60628
MLS# 12599587Listed by: HOMESMART REALTY GROUP $314,600Active6 beds 3 baths2,500 sq. ft.
318 W 112th Street, Chicago, IL 60628
MLS# 12603821Listed by: HOMESMART REALTY GROUP $69,000Pending3 beds 1 baths594 sq. ft.
118 W 103rd Place, Chicago, IL 60628
MLS# 12603761Listed by: AT HOME REALTY, INC. $249,500Pending4 beds 2 baths1,000 sq. ft.
117 W 103rd Place, Chicago, IL 60628
MLS# 12601926Listed by: AT HOME REALTY, INC. $80,000Pending2 beds 2 baths1,074 sq. ft.
317 W 103rd Place, Chicago, IL 60628
MLS# 12598272Listed by: CHICAGO REALTY PARTNERS, LTD $165,000Active3 beds 2 baths1,119 sq. ft.
9650 S Wallace Street, Chicago, IL 60628
MLS# 12600597Listed by: EXP REALTY $159,999Pending4 beds 1 baths1,421 sq. ft.
149 E 120th Street, Chicago, IL 60628
MLS# 12597774Listed by: RE/MAX LOYALTY $167,000Pending2 beds 1 baths949 sq. ft.
10552 S Eberhart Avenue, Chicago, IL 60628
MLS# 12596307Listed by: WINDY CITY REALTORS INC. $290,000Active5 beds 3 baths2,706 sq. ft.
10529 S Perry Avenue, Chicago, IL 60628
MLS# 12584789Listed by: AXEN REALTY LLC $145,000Pending7 beds 3 baths1,066 sq. ft.
11 E 114th Street, Chicago, IL 60628
MLS# 12595754Listed by: MCCOLLY REAL ESTATE $115,000Pending4 beds 1 baths1,056 sq. ft.
12249 S Parnell Avenue, Chicago, IL 60628
MLS# 12593447Listed by: CHICAGO AREA REALTY INC $119,999Active4 beds 2 baths
11720 S Wentworth Avenue, Chicago, IL 60628
MLS# 12593201Listed by: CITY & SUBURBS REALTY, INC.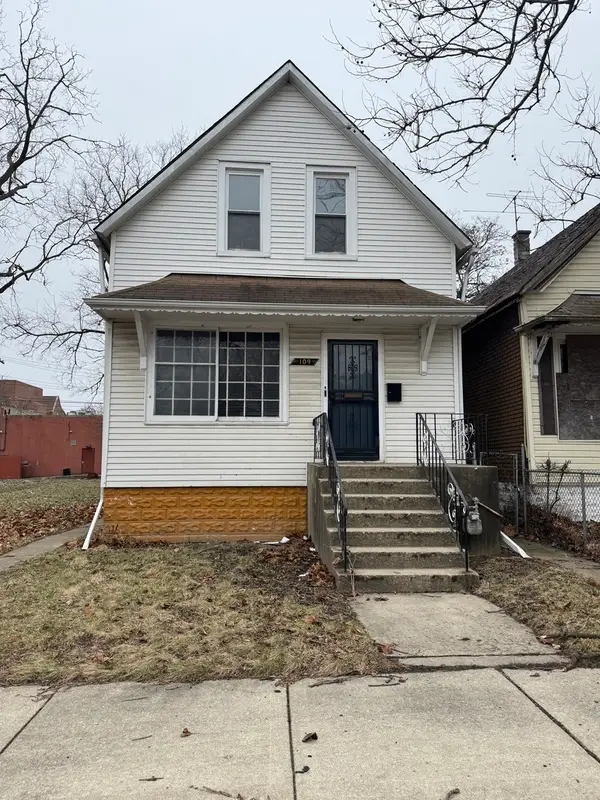 $205,000Active4 beds 3 baths1,064 sq. ft.
109 W 110th Place, Chicago, IL 60628
MLS# 12591240Listed by: KELLER WILLIAMS INFINITY $294,900Pending5 beds 3 baths1,458 sq. ft.
10235 S Rhodes Avenue, Chicago, IL 60628
MLS# 12592560Listed by: FIRST MIDWEST REALTY LLC $275,000Pending3 beds 2 baths1,152 sq. ft.
11935 S Stewart Avenue, Chicago, IL 60628
MLS# 12591692Listed by: CENTURY 21 S.G.R., INC. $67,300Active3 beds 1 baths1,100 sq. ft.
235 W 104th Street, Chicago, IL 60628
MLS# 12591447Listed by: CIRCLE ONE REALTY $249,000Active4 beds 3 baths2,000 sq. ft.
11250 S Parnell Avenue, Chicago, IL 60628
MLS# 12586162Listed by: EXP REALTY $50,000Active4 beds 2 baths1,586 sq. ft.
11931 S Wallace Street, Chicago, IL 60628
MLS# 12586107Listed by: COLDWELL BANKER REALTY $134,900Pending2 beds 1 baths1,107 sq. ft.
546 W 115th Street, Chicago, IL 60628
MLS# 12574308Listed by: COLDWELL BANKER REALTY $87,900Active5 beds 2 baths2,300 sq. ft.
11920 S Calumet Avenue, Chicago, IL 60628
MLS# 12582423Listed by: CENTURY 21 UNIVERSAL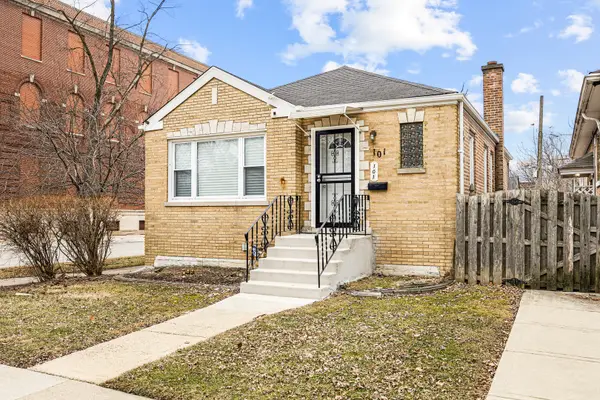 $189,999Pending4 beds 1 baths1,000 sq. ft.
101 W 113th Place, Chicago, IL 60628
MLS# 12577004Listed by: PRINCE REALTY GROUP LLC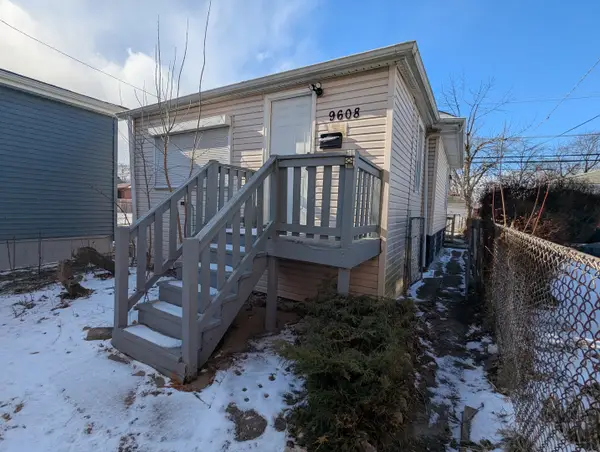 $125,000Active2 beds 1 baths960 sq. ft.
9608 S Wallace Street, Chicago, IL 60628
MLS# 12573298Listed by: TOP CARE REALTY LLC $129,900Pending3 beds 2 baths1,426 sq. ft.
420 W 98th Street, Chicago, IL 60628
MLS# 12576415Listed by: SR REALTY GROUP INC. $232,900Pending4 beds 2 baths1,200 sq. ft.
10524 S Lasalle Street, Chicago, IL 60628
MLS# 12575220Listed by: NEW MARKET REALTY INC $260,000Pending4 beds 2 baths1,126 sq. ft.
11410 S Eggleston Avenue, Chicago, IL 60628
MLS# 12574319Listed by: ICANDY REALTY LLC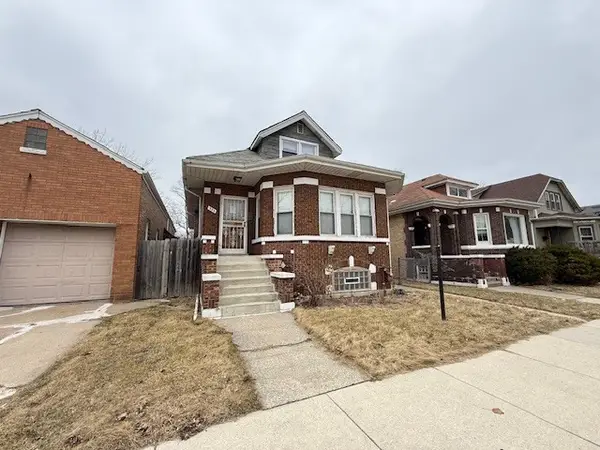 $139,900Pending5 beds 1 baths1,402 sq. ft.
322 W 107th Place, Chicago, IL 60628
MLS# 12573799Listed by: SR REALTY GROUP INC.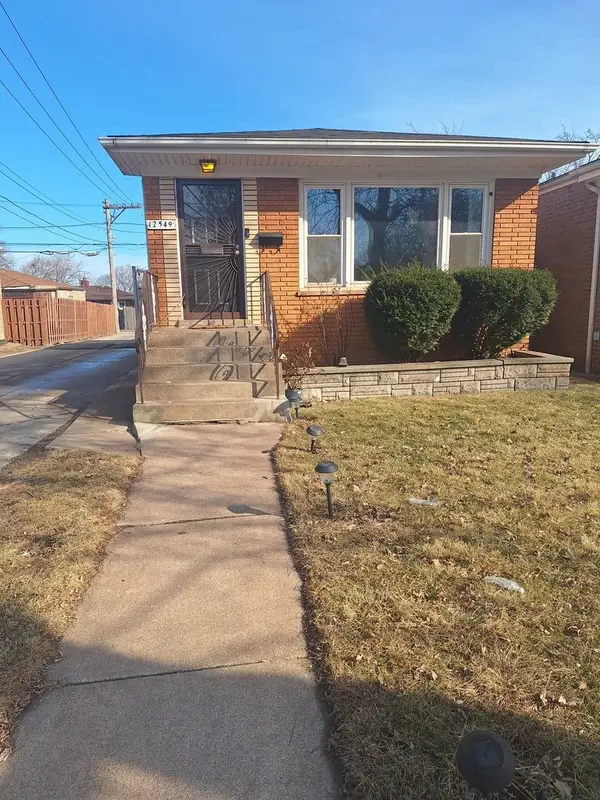 $165,000Pending4 beds 3 baths1,040 sq. ft.
12549 S Michigan Avenue, Chicago, IL 60628
MLS# 12570200Listed by: ONE STOP REAL ESTATE SERVICES $145,000Pending2 beds 1 baths931 sq. ft.
12864 S Eggleston Avenue, Chicago, IL 60628
MLS# 12561996Listed by: ALTURA REALTY INC. $100,000Pending2 beds 1 baths1,000 sq. ft.
10542 S Eggleston Avenue, Chicago, IL 60628
MLS# 12562859Listed by: COLDWELL BANKER REALTY $99,000Pending2 beds 2 baths871 sq. ft.
11341 S Normal Avenue, Chicago, IL 60628
MLS# 12578470Listed by: EXP REALTY $315,500Pending5 beds 3 baths1,678 sq. ft.
10035 S La Salle Street, Chicago, IL 60628
MLS# 12559880Listed by: COMPASS $169,000Active4 beds 2 baths1,058 sq. ft.
11246 S Indiana Avenue, Chicago, IL 60628
MLS# 12558988Listed by: TOP CARE REALTY LLC $231,500Pending3 beds 2 baths890 sq. ft.
10036 S Saint Lawrence Avenue, Chicago, IL 60628
MLS# 12513374Listed by: COLDWELL BANKER REALTY $134,900Pending3 beds 2 baths1,384 sq. ft.
10503 S Edbrooke Avenue, Chicago, IL 60628
MLS# 12556270Listed by: CHICAGOLAND BROKERS, INC. $134,999Active3 beds 2 baths1,182 sq. ft.
10149 S Wentworth Avenue, Chicago, IL 60628
MLS# 12550619Listed by: CITY & SUBURBS REALTY, INC. $39,900Pending5 beds 2 baths1,400 sq. ft.
Address Withheld By Seller, Chicago, IL 60628
MLS# 12551455Listed by: CHOICE REALTY GROUP INC. $77,000Active3 beds 1 baths1,016 sq. ft.
10106 S Union Avenue, Chicago, IL 60628
MLS# 12549764Listed by: MONTALBANO & ASSOCIATES $185,000Pending2 beds 1 baths1,058 sq. ft.
10549 S Eggleston Avenue, Chicago, IL 60628
MLS# 12548339Listed by: MY TURN REALTY & CO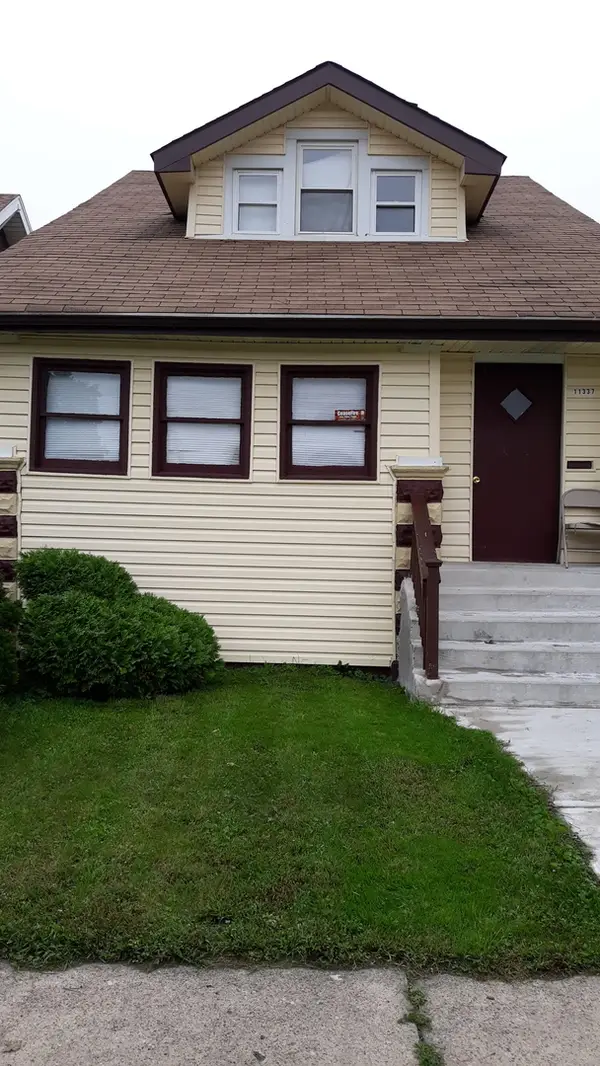 $80,000Pending4 beds 2 baths1,257 sq. ft.
11337 S Parnell Avenue, Chicago, IL 60628
MLS# 12546307Listed by: EXP REALTY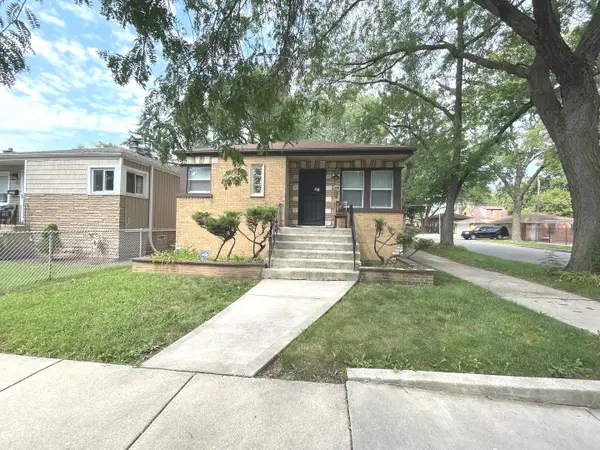 $174,900Pending3 beds 2 baths1,071 sq. ft.
12600 S Wallace Street, Chicago, IL 60628
MLS# 12447827Listed by: COLDWELL BANKER REALTY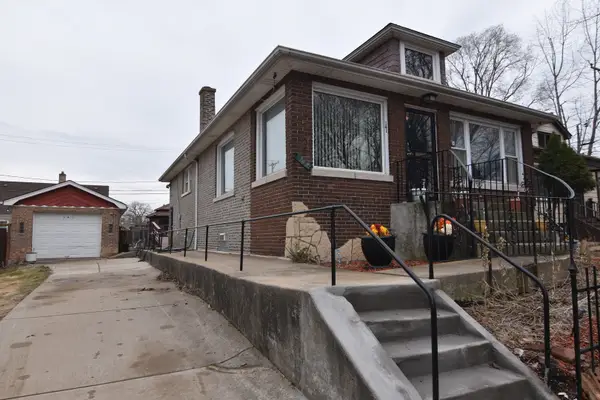 $234,900Active3 beds 3 baths960 sq. ft.
141 W 124th Street, Chicago, IL 60628
MLS# 12543842Listed by: SUBURBAN REALTY INC. $77,900Active3 beds 1 baths800 sq. ft.
Address Withheld By Seller, Chicago, IL 60628
MLS# 12543383Listed by: ZIMA REALTY LLC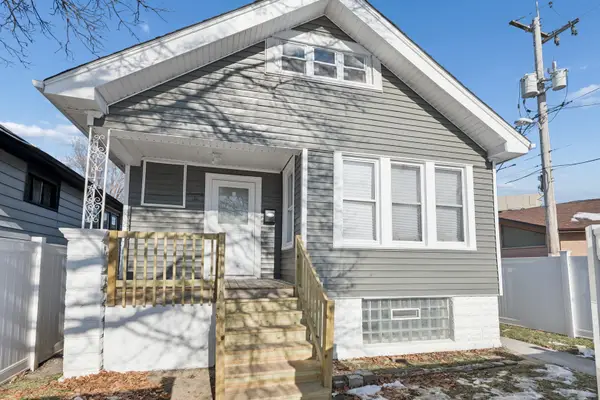 $239,900Pending5 beds 2 baths2,600 sq. ft.
76 E 100th Place, Chicago, IL 60628
MLS# 12535328Listed by: RAMSEY REALTY GROUP LLC $0Active4 beds 2 baths1,387 sq. ft.
54 E 101st Street, Chicago, IL 60628
MLS# 12511764Listed by: REALHOME SERVICES & SOLUTIONS, INC. $103,000Active5 beds 1 baths
11727 S Normal Avenue, Chicago, IL 60628
MLS# 12530524Listed by: MANAGE CHICAGO, INC. $134,999Pending3 beds 2 baths3,750 sq. ft.
10436 S Calumet Avenue, Chicago, IL 60628
MLS# 12528634Listed by: KELLER WILLIAMS PREFERRED REALTY $139,850Pending3 beds 2 baths924 sq. ft.
11322 S Normal Avenue, Chicago, IL 60628
MLS# 12530836Listed by: GENSTONE REALTY $150,000Pending5 beds 4 baths3,197 sq. ft.
9737 S Calumet Avenue, Chicago, IL 60628
MLS# 12528690Listed by: CENTURY 21 IMPACT $199,900Active4 beds 2 baths1,039 sq. ft.
9757 S Woodlawn Avenue, Chicago, IL 60628
MLS# 12561140Listed by: EXP REALTY $140,000Pending3 beds 2 baths1,248 sq. ft.
12453 S State Street, Chicago, IL 60628
MLS# 12525063Listed by: EXP REALTY $242,000Active4 beds 3 baths1,375 sq. ft.
15 W 108th Place, Chicago, IL 60628
MLS# 12523104Listed by: THE WALLACE REAL ESTATE GROUP, INC. $140,000Active2 beds 1 baths960 sq. ft.
12532 S Union Avenue, Chicago, IL 60628
MLS# 12515324Listed by: COLDWELL BANKER REALTY $214,900Pending4 beds 2 baths1,291 sq. ft.
11921 S Wentworth Avenue, Chicago, IL 60628
MLS# 12522729Listed by: URBANITAS INC. $45,000Active5 beds 2 baths1,400 sq. ft.
221 W 112th Place, Chicago, IL 60628
MLS# 12522294Listed by: CHOICE REALTY GROUP INC. $259,900Pending4 beds 2 baths2,500 sq. ft.
Address Withheld By Seller, Chicago, IL 60628
MLS# 12574192Listed by: DIAMOND REAL ESTATE INC $42,400Active4 beds 3 baths1,322 sq. ft.
500 W 103rd Place, Chicago, IL 60628
MLS# 12519747Listed by: CIRCLE ONE REALTY $210,000Pending3 beds 2 baths1,700 sq. ft.
11581 S Lafayette Avenue, Chicago, IL 60628
MLS# 12515232Listed by: KALE REALTY $114,900Pending5 beds 2 baths
12210 S Normal Avenue, Chicago, IL 60628
MLS# 12512426Listed by: GENSTONE REALTY $87,500Active4 beds 1 baths1,292 sq. ft.
12014 S Normal Avenue, Chicago, IL 60628
MLS# 12510532Listed by: MANAGE CHICAGO, INC. $135,000Active3 beds 1 baths942 sq. ft.
10110 S Yale Avenue, Chicago, IL 60628
MLS# 12495010Listed by: TOP CARE REALTY LLC $170,000Pending4 beds 2 baths1,069 sq. ft.
12600 S Stewart Avenue, Chicago, IL 60628
MLS# 12519891Listed by: RE/MAX PREMIER $269,999Pending3 beds 2 baths1,875 sq. ft.
10414 S Wentworth Avenue, Chicago, IL 60628
MLS# 12492210Listed by: EQUITABLE INVESTMENT GROUP INC $59,900Pending2 beds 2 baths1,215 sq. ft.
10710 S Langley Avenue, Chicago, IL 60628
MLS# 12486430Listed by: COLDWELL BANKER REALTY $69,900Pending3 beds 2 baths1,840 sq. ft.
10734 S Langley Avenue, Chicago, IL 60628
MLS# 12486591Listed by: COLDWELL BANKER REALTY $194,900Active3 beds 2 baths1,020 sq. ft.
9760 S Dobson Avenue, Chicago, IL 60628
MLS# 12555874Listed by: JASON MITCHELL REAL ESTATE IL $169,900Active5 beds 2 baths1,672 sq. ft.
11548 S State Street, Chicago, IL 60628
MLS# 12482188Listed by: RE/MAX MI CASA $225,000Pending3 beds 2 baths1,400 sq. ft.
11413 S Normal Avenue, Chicago, IL 60628
MLS# 12470662Listed by: CENTURY 21 CIRCLE $90,000Active3 beds 1 baths819 sq. ft.
15 E 126th Street, Chicago, IL 60628
MLS# 12477326Listed by: MANAGE CHICAGO, INC. $140,000Active3 beds 2 baths1,402 sq. ft.
344 E 117th Street, Chicago, IL 60628
MLS# 12476834Listed by: LISTING LEADERS NORTHWEST, INC $295,000Active5 beds 3 baths1,454 sq. ft.
12053 S Michigan Avenue, Chicago, IL 60628
MLS# 12432887Listed by: ILLINOIS STAR, LTD $169,000Active3 beds 2 baths
550 W 127th Street, Chicago, IL 60628
MLS# 12451320Listed by: RE/MAX PREMIER $57,500Pending4 beds 2 baths1,168 sq. ft.
11922 S Perry Avenue, Chicago, IL 60628
MLS# 12446507Listed by: RE/MAX PREMIER $280,000Active3 beds 2 baths1,130 sq. ft.
10215 S Emerald Avenue, Chicago, IL 60628
MLS# 12570037Listed by: REAL PEOPLE REALTY $39,900Pending3 beds 1 baths700 sq. ft.
149 E 120th Place, Chicago, IL 60628
MLS# 12436261Listed by: LOIS WHITE REALTY $75,000Pending3 beds 1 baths1,400 sq. ft.
10052 S Lafayette Avenue, Chicago, IL 60628
MLS# 12437751Listed by: @PROPERTIES CHRISTIE'S INTERNATIONAL REAL ESTATE $36,500Pending4 beds 2 baths1,400 sq. ft.
11532 S Harvard Avenue, Chicago, IL 60628
MLS# 12436797Listed by: CHOICE REALTY GROUP INC. $289,999Active4 beds 4 baths1,600 sq. ft.
11531 S Perry Avenue, Chicago, IL 60628
MLS# 12415283Listed by: ANCHOR REALTY GROUP, INC $164,900Pending4 beds 3 baths2,133 sq. ft.
10437 S Eberhart Avenue, Chicago, IL 60628
MLS# 12527363Listed by: PARKVUE REALTY CORPORATION $160,000Active5 beds 2 baths1,800 sq. ft.
10515 S Perry Avenue, Chicago, IL 60628
MLS# 12400384Listed by: TOP CARE REALTY LLC $274,900Pending6 beds 3 baths2,100 sq. ft.
26 W 114th Street, Chicago, IL 60628
MLS# 12391282Listed by: COLDWELL BANKER REALTY $159,995Active3 beds 3 baths1,717 sq. ft.
32 W 109th Place, Chicago, IL 60628
MLS# 12396025Listed by: BAIRD & WARNER $239,000Active4 beds 3 baths2,114 sq. ft.
12033 S Wallace Street, Chicago, IL 60628
MLS# 12548496Listed by: LIFESTYLE PROPERTIES $100,000Active4 beds 1 baths799 sq. ft.
10568 S Indiana Avenue, Chicago, IL 60628
MLS# 12066611Listed by: MANAGE CHICAGO, INC. $110,000Active3 beds 1 baths1,200 sq. ft.
656 W 116th Place, Chicago, IL 60628
MLS# 12066614Listed by: MANAGE CHICAGO, INC. $115,000Active3 beds 1 baths924 sq. ft.
10238 S Wentworth Avenue, Chicago, IL 60628
MLS# 12066608Listed by: MANAGE CHICAGO, INC. $125,000Active3 beds 1 baths958 sq. ft.
12115 S Emerald Avenue, Chicago, IL 60628
MLS# 12059697Listed by: MANAGE CHICAGO, INC. $125,500Pending4 beds 2 baths1,082 sq. ft.
549 W 95th Street, Chicago, IL 60628
MLS# 11891805Listed by: 26.2 REALTY, INC $119,900Pending5 beds 2 baths1,493 sq. ft.
10117 S Perry Avenue, Chicago, IL 60628
MLS# 12481197Listed by: EXP REALTY
Local realty services provided by:CENTURY 21 Affiliated
Copyright 2026 Midwest Real Estate Data LLC. All rights reserved. The data relating to real estate for sale on this web site comes in part from the Broker Reciprocity Program of the Midwest Real Estate Data LLC. Listing information is deemed reliable but not guaranteed. MLSNI Member Broker: David Try
Popular searches near 60628
Popular neighborhoods near 60628
- Beverly, Chicago homes for sale
- Burnside, Chicago homes for sale
- Calumet Heights, Chicago homes for sale
- Chatham, Chicago homes for sale
- Far Southeast Side, Chicago homes for sale
- Far Southwest Side, Chicago homes for sale
- Fernwood, Chicago homes for sale
- Ivanhoe, Riverdale homes for sale
- Marynook, Chicago homes for sale
- Morgan Park, Chicago homes for sale
- Pill Hill, Chicago homes for sale
- Princeton Park, Chicago homes for sale
- Pullman, Chicago homes for sale
- Riverdale, Chicago homes for sale
- Roseland, Chicago homes for sale
- South Deering, Chicago homes for sale
- Stony Island Park, Chicago homes for sale
- Washington Heights, Chicago homes for sale
- West Chesterfield, Chicago homes for sale
- West Pullman, Chicago homes for sale
Counties near Chicago, 60628
- Berrien County homes for sale
- Cook County homes for sale
- DeKalb County homes for sale
- DuPage County homes for sale
- Grundy County homes for sale
- Iroquois County homes for sale
- Jasper County homes for sale
- Kane County homes for sale
- Kankakee County homes for sale
- Kendall County homes for sale
- Kenosha County homes for sale
- Lake County homes for sale
- Lake County homes for sale
- LaPorte County homes for sale
- McHenry County homes for sale
- Newton County homes for sale
- Porter County homes for sale
- Pulaski County homes for sale
- Starke County homes for sale
- Will County homes for sale
Protect your home and budget from life's surprises with an Assurant Home Warranty, backed by a partner that supports you through every step of homeownership. Explore Plans.
©2026 Century 21 Real Estate LLC. All rights reserved. CENTURY 21®, the CENTURY 21 Logo and C21® are service marks owned by Century 21 Real Estate LLC. Century 21 Real Estate LLC fully supports the principles of the Fair Housing Act and the Equal Opportunity Act. Each office is independently owned and operated. Listing information is deemed reliable but not guaranteed accurate.