- Arabi homes for sale
- Avondale homes for sale
- Belle Chasse homes for sale
- Bridge City homes for sale
- Chalmette homes for sale
- Elmwood homes for sale
- Estelle homes for sale
- Gretna homes for sale
- Harahan homes for sale
- Harvey homes for sale
- Jefferson homes for sale
- Marrero homes for sale
- Meraux homes for sale
- New Orleans homes for sale
- Poydras homes for sale
- Terrytown homes for sale
- Timberlane homes for sale
- Violet homes for sale
- Westwego homes for sale
- Woodmere homes for sale
70056, LA - homes for sale
198 of 198 results displayed
- New
 $94,900Active3 beds 2 baths1,530 sq. ft.
949 E Kingsway Drive, Gretna, LA 70056
MLS# 2561952Listed by: HOMESMART REALTY SOUTH - New

 $145,000Active3 beds 2 baths1,410 sq. ft.
840 Morningside Drive, Gretna, LA 70056
MLS# 2561966Listed by: C-21 RICHARD BERRY & ASSOC,INC - New
 $239,900Active4 beds 2 baths1,330 sq. ft.
216 Dale Avenue, Gretna, LA 70056
MLS# NO2561777Listed by: GULF SOUTH INTERNATIONAL, REALTORS, LLC - New
 $262,500Active3 beds 2 baths1,418 sq. ft.
725 Hermes Place, Terrytown, LA 70056
MLS# NO2561622Listed by: HOMESMART REALTY SOUTH - New
 $265,000Active4 beds 2 baths1,600 sq. ft.
3300 Mount Laurel Drive, Gretna, LA 70056
MLS# NO2561634Listed by: NOLA LIVING REALTY - New
 $540,000Active3 beds 3 baths2,746 sq. ft.
141 Meadowbrook Street, Gretna, LA 70056
MLS# NO2561291Listed by: TCK REALTY LLC - New
 $218,500Active3 beds 2 baths1,805 sq. ft.
636 Diplomat Street, Gretna, LA 70056
MLS# NO2561175Listed by: INNOVATION REALTY - New
 $200,000Active3 beds 1 baths1,350 sq. ft.
2124 S Butterfly Circle, Terrytown, LA 70056
MLS# NO2561099Listed by: EXP REALTY, LLC - New
 $449,999Active4 beds 3 baths2,309 sq. ft.
3721 Lake Kristin Drive, Gretna, LA 70056
MLS# NO2561136Listed by: KELLER WILLIAMS REALTY NEW ORLEANS - New
 $210,000Active3 beds 2 baths1,344 sq. ft.
553 Diplomat Street, Gretna, LA 70056
MLS# NO2561119Listed by: PALMISANO PROPERTY GROUP LLC - New
 $649,000Active4 beds 4 baths4,780 sq. ft.
392 Fairfield Avenue, Gretna, LA 70056
MLS# NO2560900Listed by: KELLER WILLIAMS REALTY 455-0100 - New
 $150,000Active3 beds 2 baths1,575 sq. ft.
2135 Browning Lane, Terrytown, LA 70056
MLS# 2560601Listed by: GOOD ROOTS REALTY, LLC  $180,000Active3 beds 2 baths1,506 sq. ft.
402 Blossom Street, Terrytown, LA 70056
MLS# NO2560501Listed by: HOMESMART REALTY SOUTH $323,900Active3 beds 2 baths1,500 sq. ft.
733 Rue St Michael, Terrytown, LA 70056
MLS# 2560259Listed by: C-21 RICHARD BERRY & ASSOC,INC $259,900Active3 beds 2 baths1,410 sq. ft.
2149 Graham Drive, Gretna, LA 70056
MLS# 2560059Listed by: TENTH&CALLIOPE LLC $350,000Active3 beds 3 baths1,760 sq. ft.
2329 E Village Court, Gretna, LA 70056
MLS# NO2560288Listed by: THE PELLERIN GROUP NOLA LLC $165,000Active3 beds 2 baths1,627 sq. ft.
342 Cherry Blossom Lane, Gretna, LA 70056
MLS# NO2559513Listed by: COMPASS WESTBANK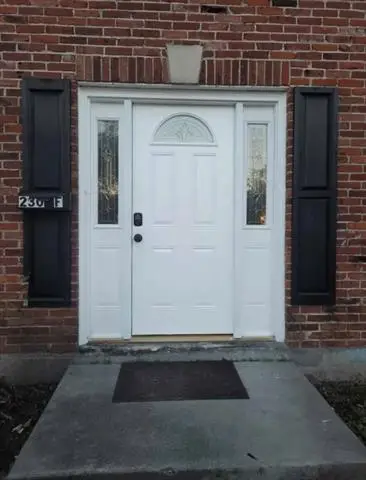 $155,000Active3 beds 3 baths1,350 sq. ft.
230 Terry Pkw Parkway #F, Terrytown, LA 70056
MLS# NO2559820Listed by: KELLER WILLIAMS REALTY SERVICES $265,000Active4 beds 2 baths1,679 sq. ft.
641 Fielding Avenue, Terrytown, LA 70056
MLS# NO2558833Listed by: FORTE REALTY, LLC $315,000Active4 beds 3 baths2,213 sq. ft.
760 Glouster Place, Gretna, LA 70056
MLS# 2556095Listed by: ARMSTRONG REALTY $85,000Active0.2 Acres
264 Southwood Drive, Gretna, LA 70056
MLS# NO2559579Listed by: INNOVATION REALTY $490,000Active4 beds 3 baths2,750 sq. ft.
1117 Lake Louise Drive, Gretna, LA 70056
MLS# NO2559622Listed by: TJONES & CO, LLC $258,000Active3 beds 2 baths1,595 sq. ft.
1472 Alison Street, Gretna, LA 70056
MLS# 2559237Listed by: WATERMARK REALTY, LLC $295,000Active3 beds 2 baths2,150 sq. ft.
120 Firethorn Drive, Gretna, LA 70056
MLS# NO2558925Listed by: HOMESMART REALTY SOUTH $250,000Active4 beds 3 baths2,668 sq. ft.
909 Marlene Drive, Gretna, LA 70056
MLS# NO2558794Listed by: GOOD ROOTS REALTY, LLC $299,000Active3 beds 2 baths2,400 sq. ft.
2145 Leslie Street, Gretna, LA 70056
MLS# 2558707Listed by: TCK REALTY LLC $199,000Active4 beds 2 baths1,807 sq. ft.
425 Sugarpine Drive, Gretna, LA 70056
MLS# NO2557136Listed by: ESSENTIAL LIVING REALTY LLC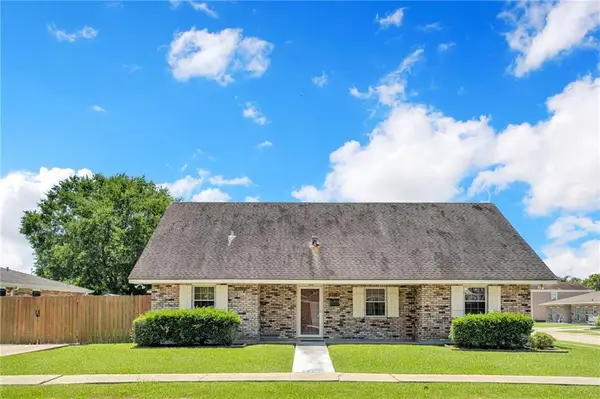 $284,900Active4 beds 3 baths2,717 sq. ft.
2160 Glouster Street, Terrytown, LA 70056
MLS# 2558048Listed by: HOMESMART REALTY SOUTH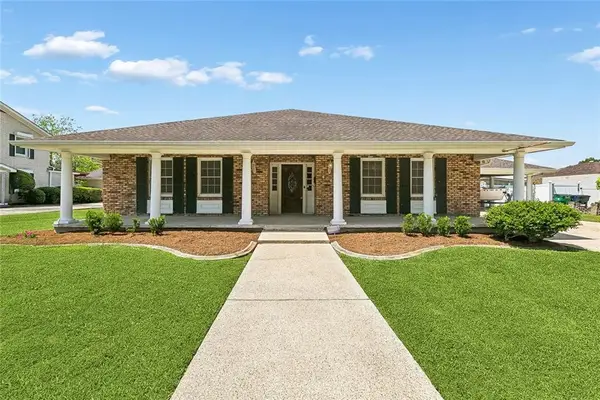 $290,000Active3 beds 3 baths2,553 sq. ft.
404 Fairfield Avenue, Gretna, LA 70056
MLS# 2557519Listed by: COMPASS COVINGTON (COMP27)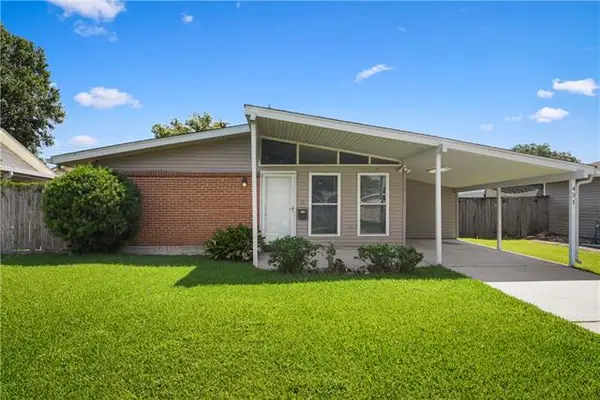 $215,000Active3 beds 2 baths1,357 sq. ft.
431 W Butterfly Circle, Terrytown, LA 70056
MLS# NO2558103Listed by: KELLER WILLIAMS REALTY NEW ORLEANS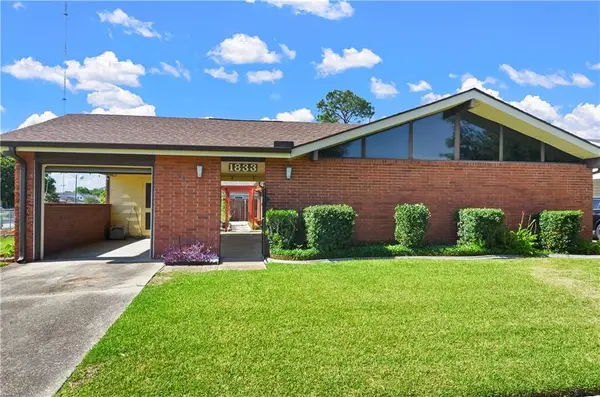 $234,900Active3 beds 2 baths1,620 sq. ft.
1833 Faith Place, Terrytown, LA 70056
MLS# 2557704Listed by: HISTORIC 504 PROPERTIES $189,210Active4 beds 3 baths2,753 sq. ft.
1036 Fairfax Drive, Gretna, LA 70056
MLS# NO2557082Listed by: DONALD JULIEN & ASSOCIATES, INC. $270,000Active4 beds 2 baths1,710 sq. ft.
2729 Fairfield Avenue, Gretna, LA 70056
MLS# NO2558046Listed by: HOSPITALITY REALTY $270,000Active3 beds 2 baths2,028 sq. ft.
328 Southwood Drive, Gretna, LA 70056
MLS# NO2557397Listed by: EXP REALTY, LLC $750,000Active-- beds -- baths4,151 sq. ft.
2900 N Monterey Court, Gretna, LA 70056
MLS# NO2557548Listed by: KELLER WILLIAMS REALTY NEW ORLEANS $275,000Active4 beds 2 baths1,876 sq. ft.
844 Fairfield Avenue, Gretna, LA 70056
MLS# 2557027Listed by: COLDWELL BANKER TEC MAGAZINE $339,900Active4 beds 4 baths2,179 sq. ft.
409 Lynnmeade Road, Gretna, LA 70056
MLS# NO2555873Listed by: NOLA LIVING REALTY $85,000Active1 beds 1 baths780 sq. ft.
2425 Oxford Place #136, Gretna, LA 70056
MLS# NO2556014Listed by: AMANDA MILLER REALTY, LLC $260,000Active3 beds 3 baths2,115 sq. ft.
876 Oakwood Drive, Gretna, LA 70056
MLS# NO2556217Listed by: 1 PERCENT LISTS $375,000Active4 beds 3 baths2,440 sq. ft.
317 Southwood Drive, Gretna, LA 70056
MLS# NO2555860Listed by: COMPASS WESTBANK $217,000Active3 beds 2 baths1,300 sq. ft.
405 Bruce Avenue, Terrytown, LA 70056
MLS# NO2556139Listed by: INFINITE REALTY & ASSOCIATES, LLC $248,800Active4 beds 2 baths1,300 sq. ft.
2026 Dartmouth Street, Terrytown, LA 70056
MLS# NO2555184Listed by: HOMESMART REALTY SOUTH $185,000Active0.72 Acres
00 Colony Road, Gretna, LA 70056
MLS# NO2555853Listed by: HOMESMART REALTY SOUTH $325,000Active4 beds 4 baths2,146 sq. ft.
3237 Whisper Lane, Gretna, LA 70056
MLS# NO2554940Listed by: WATERMARK REALTY, LLC $300,000Active6 beds 4 baths2,020 sq. ft.
669 Taylorbrook Drive, Gretna, LA 70056
MLS# NO2555418Listed by: KEY TURNER REALTY LLC $384,000Active3 beds 3 baths2,732 sq. ft.
344 Southwood Drive, Gretna, LA 70056
MLS# NO2554328Listed by: 1ST BMG REALTY, L.L.C. $260,000Active3 beds 2 baths1,462 sq. ft.
917 Ellen Street, Terrytown, LA 70056
MLS# RANO2520736Listed by: KELLER WILLIAMS REALTY NEW ORLEANS $210,000Active3 beds 2 baths1,584 sq. ft.
2140 Graham Drive, Gretna, LA 70056
MLS# 2524986Listed by: AT HOME REALTY GROUP $249,500Active3 beds 2 baths1,462 sq. ft.
917 Ellen Street, Gretna, LA 70056
MLS# NO2536183Listed by: KELLER WILLIAMS REALTY NEW ORLEANS $499,900Active5 beds 4 baths3,132 sq. ft.
1109 Lake Frances Drive, Gretna, LA 70056
MLS# NO2554179Listed by: NOLA LIVING REALTY $197,800Active3 beds 2 baths1,771 sq. ft.
621 Fairlawn Drive, Terrytown, LA 70056
MLS# NO2554025Listed by: COMPASS WESTBANK $475,000Active3 beds 3 baths2,233 sq. ft.
237 Oak Dale Drive, Gretna, LA 70056
MLS# 2554080Listed by: TCK REALTY LLC $375,000Active3 beds 3 baths2,160 sq. ft.
725 Marlene Drive, Gretna, LA 70056
MLS# NO2553844Listed by: HOMESMART REALTY SOUTH $355,000Active4 beds 2 baths2,000 sq. ft.
3516 Lake Lynn Drive, Gretna, LA 70056
MLS# 2553057Listed by: KELLER WILLIAMS REALTY 455-0100 $144,900Active3 beds 3 baths1,750 sq. ft.
300 Coral Avenue #F, Terrytown, LA 70056
MLS# NO2553794Listed by: ODOMS REALTY GROUP, LLC $850,000Active4 beds 4 baths3,551 sq. ft.
531 Oak Glen Drive, Gretna, LA 70056
MLS# NO2552720Listed by: GENERATIONS REALTY GROUP, LLC $260,000Active3 beds 2 baths1,608 sq. ft.
2168 Graham Drive, Gretna, LA 70056
MLS# 2553215Listed by: MIRAMBELL REALTY $145,499Active3 beds 1 baths1,108 sq. ft.
2122 Stumpf Boulevard, Terrytown, LA 70056
MLS# 2552851Listed by: NOLA LIVING REALTY $319,000Active3 beds 2 baths1,400 sq. ft.
526 Nel Court, Gretna, LA 70056
MLS# NO2542659Listed by: REALTY EXECUTIVES SELA $314,000Active3 beds 2 baths1,343 sq. ft.
527 Nel Court, Gretna, LA 70056
MLS# NO2542667Listed by: REALTY EXECUTIVES SELA $308,000Active3 beds 2 baths1,306 sq. ft.
530 Nel Court, Gretna, LA 70056
MLS# NO2542750Listed by: REALTY EXECUTIVES SELA $324,000Active3 beds 2 baths1,456 sq. ft.
531 Nel Court, Gretna, LA 70056
MLS# NO2542767Listed by: REALTY EXECUTIVES SELA $324,000Active3 beds 2 baths1,465 sq. ft.
534 Nel Court, Gretna, LA 70056
MLS# NO2542776Listed by: REALTY EXECUTIVES SELA $308,000Active3 beds 2 baths1,326 sq. ft.
535 Nel Court, Gretna, LA 70056
MLS# NO2542778Listed by: REALTY EXECUTIVES SELA $314,000Active3 beds 2 baths1,343 sq. ft.
538 Nel Court, Gretna, LA 70056
MLS# NO2542780Listed by: REALTY EXECUTIVES SELA $369,000Pending4 beds 3 baths2,590 sq. ft.
304 Glenmeade Court, Gretna, LA 70056
MLS# 2545783Listed by: HOMESMART REALTY SOUTH $289,500Pending4 beds 2 baths1,932 sq. ft.
748 Grinell Place, Terrytown, LA 70056
MLS# 2551314Listed by: PEOPLE'S REALTY, INC. $590,000Active4 beds 3 baths2,936 sq. ft.
1105 Lake Frances Drive, Gretna, LA 70056
MLS# NO2551621Listed by: COMPASS WESTBANK $260,000Active4 beds 3 baths2,052 sq. ft.
628 Fairlawn Drive, Gretna, LA 70056
MLS# NO2550913Listed by: PEOPLE'S REALTY, INC. $320,000Active4 beds 3 baths2,290 sq. ft.
2125 Glencove Lane, Gretna, LA 70056
MLS# NO2551253Listed by: RED DOOR REALTY, INC. $330,000Active4 beds 2 baths2,634 sq. ft.
1929 Carol Sue Avenue, Terrytown, LA 70056
MLS# NO2551020Listed by: TCK REALTY LLC $379,000Pending4 beds 3 baths2,905 sq. ft.
109 Gaudin Street, Gretna, LA 70056
MLS# 2549238Listed by: HOMESMART REALTY SOUTH $649,000Active4 beds 4 baths3,864 sq. ft.
15 Colony Road, Gretna, LA 70056
MLS# NO2550600Listed by: COMPASS UPTOWN (LATT07) $317,000Active4 beds 3 baths2,455 sq. ft.
2112 Deerfield Road, Terrytown, LA 70056
MLS# 2548493Listed by: C-21 RICHARD BERRY & ASSOC,INC $160,000Active3 beds 2 baths1,073 sq. ft.
2123 Browning Lane, Gretna, LA 70056
MLS# 2549377Listed by: COMPASS WESTBANK (LATT10) $179,000Active3 beds 2 baths1,267 sq. ft.
2114 S Butterfly Circle, Gretna, LA 70056
MLS# NO2550163Listed by: EXP REALTY, LLC $164,900Active2 beds 2 baths1,221 sq. ft.
427 Bluebonnet Street, Terrytown, LA 70056
MLS# NO2549794Listed by: COMPASS METRO $259,000Active3 beds 2 baths1,521 sq. ft.
1914 Fordham Place, Terrytown, LA 70056
MLS# NO2548873Listed by: ATLAS REAL ESTATE COMPANY, LLC $574,900Active6 beds 6 baths4,465 sq. ft.
3633 Lake Michel Court, Gretna, LA 70056
MLS# 2548864Listed by: LEBLANC REALTY GROUP, LLC $249,900Active3 beds 2 baths1,700 sq. ft.
1404 Drake Lane, Gretna, LA 70056
MLS# 2549239Listed by: RE/MAX SELECT $484,000Active4 beds 4 baths2,900 sq. ft.
1320 Lake Louise Drive, Gretna, LA 70056
MLS# NO2549199Listed by: COMPASS WESTBANK $49,000Active0 Acres
1525 Whitney Avenue, Gretna, LA 70056
MLS# NO2547362Listed by: GERALD MILLER, BROKER $323,900Active3 beds 2 baths1,514 sq. ft.
741 Rue St Michael, Terrytown, LA 70056
MLS# NO2548922Listed by: HOMESMART REALTY SOUTH $1,200,000Active5 beds 7 baths7,288 sq. ft.
224 Timberlane Road, Gretna, LA 70056
MLS# 2548688Listed by: CRESCENT SOTHEBY'S INTERNATIONAL $229,900Pending3 beds 2 baths1,562 sq. ft.
661 Taylorbrook Drive, Gretna, LA 70056
MLS# NO2547988Listed by: REALTIES OF ST. CHARLES, LLC $475,000Active3 beds 2 baths2,404 sq. ft.
253 Oak Dale Drive, Gretna, LA 70056
MLS# 2548488Listed by: CENTURY 21 INVESTMENT REALTY $245,000Active3 beds 2 baths1,513 sq. ft.
521 Willowbrook Drive, Gretna, LA 70056
MLS# NO2547877Listed by: REALTY ONE GROUP IMMOBILIA $244,900Active3 beds 2 baths1,300 sq. ft.
748 Oakwood Drive, Gretna, LA 70056
MLS# NO2547987Listed by: REALTY ONE GROUP IMMOBILIA $549,000Active3 beds 3 baths2,854 sq. ft.
820 Fairfield Avenue, Gretna, LA 70056
MLS# 2547148Listed by: ENGEL & VLKERS NEW ORLEANS $155,000Active3 beds 3 baths1,591 sq. ft.
218 Terry Parkway Other #D, Terrytown, LA 70056
MLS# NO2547208Listed by: HOMESMART REALTY SOUTH $245,000Active3 beds 3 baths1,514 sq. ft.
733 Mystic Avenue, Terrytown, LA 70056
MLS# 2541482Listed by: CENTURY 21 ACTION REALTY, INC. $370,000Active4 beds 2 baths2,480 sq. ft.
1200 Wyndham S Drive, Gretna, LA 70056
MLS# NO2545728Listed by: TODAY REALTY & INVESTMENTS $339,000Active3 beds 2 baths1,821 sq. ft.
421 Firethorn Drive, Gretna, LA 70056
MLS# 2546032Listed by: TJONES & CO, LLC $95,000Active0.21 Acres
2605 Whitney Avenue, Gretna, LA 70056
MLS# NO2542410Listed by: NOLA LIVING REALTY $320,000Active4 beds 2 baths2,258 sq. ft.
1820 Green Oak Road, Gretna, LA 70056
MLS# NO2545707Listed by: BRITTNY MCKAY REAL ESTATE $171,000Active2 beds 1 baths1,188 sq. ft.
2130 N Butterfly Circle, Terrytown, LA 70056
MLS# 2518723Listed by: ROBERT WOLFE REAL ESTATE, INC. $289,000Active4 beds 2 baths2,056 sq. ft.
2140 Carol Sue Avenue, Terrytown, LA 70056
MLS# 2544511Listed by: NEWFIELD REALTY GROUP INC. $749,000Active4 beds 5 baths4,400 sq. ft.
3728 Lake Michel Drive, Gretna, LA 70056
MLS# NO2543567Listed by: COMPASS WESTBANK $499,000Active4 beds 4 baths2,925 sq. ft.
1304 Lake Louise Drive, Gretna, LA 70056
MLS# NO2543601Listed by: COMPASS UPTOWN (LATT07) $195,000Pending4 beds 2 baths1,628 sq. ft.
519 Delmar Street, Terrytown, LA 70056
MLS# 2543179Listed by: KELLER WILLIAMS REALTY NEW ORLEANS $100,000Active2 beds 1 baths778 sq. ft.
2425 Oxford Place #106, Gretna, LA 70056
MLS# 2516266Listed by: COMPASS WESTBANK (COMP10) $209,000Active3 beds 2 baths1,530 sq. ft.
637 Clinebrook Drive, Gretna, LA 70056
MLS# 2542819Listed by: REALTY EXECUTIVES SELA $579,900Active5 beds 5 baths3,418 sq. ft.
3501 Lake Kristin Drive, Gretna, LA 70056
MLS# NO2541697Listed by: COMPASS WESTBANK $313,565Pending4 beds 2 baths1,819 sq. ft.
203 Holmes Boulevard, Terrytown, LA 70056
MLS# 2540457Listed by: D.R.HORTON REALTY OF LOUISIANA $530,000Active6 beds 5 baths3,676 sq. ft.
917 Christana Place, Gretna, LA 70056
MLS# 2535222Listed by: COMPASS KENNER (LATT30) $120,000Active2 beds 2 baths1,171 sq. ft.
309-B Cherry Blossom Lane, Gretna, LA 70056
MLS# NO2529532Listed by: HOMESMART REALTY SOUTH $85,000Active1 beds 1 baths700 sq. ft.
714 Fairfax Drive #119, Gretna, LA 70056
MLS# NO2532136Listed by: REVE, REALTORS $150,000Active2 beds 2 baths1,200 sq. ft.
225 Wright Avenue #D, Terrytown, LA 70056
MLS# NO2534532Listed by: REALTIES OF ST. CHARLES, LLC $115,000Active2 beds 2 baths1,081 sq. ft.
2425 Oxford Place #139, Gretna, LA 70056
MLS# NO2550944Listed by: THE O.W.N. LIFE $164,900Active3 beds 3 baths1,438 sq. ft.
218 Terry Parkway #D, Terrytown, LA 70056
MLS# RANO2491077Listed by: LATTER & BLUM (LATT10) $170,000Active3 beds 2 baths1,300 sq. ft.
2764 Mt.laurel Drive, Gretna, LA 70056
MLS# RANO2520942Listed by: LATTER & BLUM (LATT10) $475,000Active3 Acres
Friedrichs Road, Gretna, LA 70056
MLS# NO2538899Listed by: PEOPLE'S REALTY, INC. $299,900Pending4 beds 3 baths2,450 sq. ft.
233 Southwood Drive, Gretna, LA 70056
MLS# 2538324Listed by: LAFRANCE-WILTZ REALTY GROUP $65,000Active0.12 Acres
Lot 7 SQ 1 Frisella Street, Terrytown, LA 70056
MLS# BR2026000626Listed by: SELECT LIVING $99,000Active0 Acres
2509 Belle Chasse Highway, Terrytown, LA 70056
MLS# NO2537479Listed by: TCK REALTY LLC $305,000Pending3 beds 3 baths2,115 sq. ft.
312 Westmeade Drive, Gretna, LA 70056
MLS# 2537294Listed by: RE/MAX PROFESSIONAL $299,000Active4 beds 3 baths2,123 sq. ft.
516 W Marlin Court, Terrytown, LA 70056
MLS# NO2536106Listed by: NOLA LIVING REALTY $75,000Active0.18 Acres
Rouyer Street, Gretna, LA 70056
MLS# NO2534735Listed by: KELLER WILLIAMS REALTY 455-0100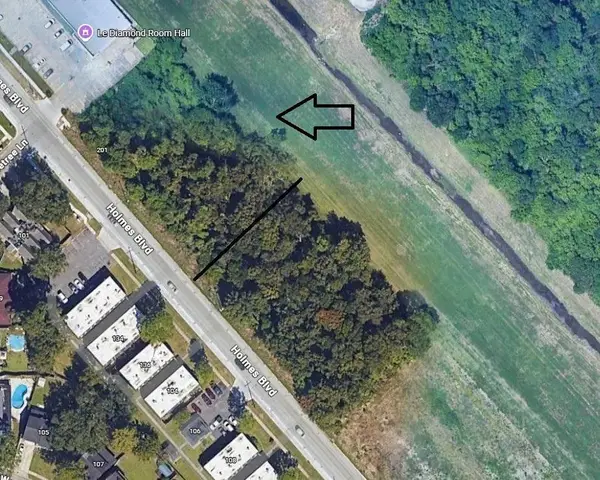 $200,000Active0.88 Acres
Holmes Boulevard, Gretna, LA 70056
MLS# 2533126Listed by: CBTEC BELLE CHASSE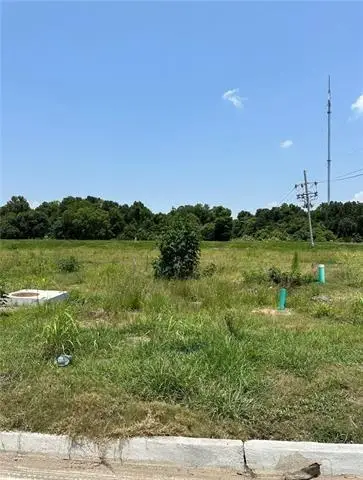 $65,000Active0.17 Acres
121 Holmes Boulevard, Terrytown, LA 70056
MLS# NO2533643Listed by: BERKSHIRE HATHAWAY HOMESERVICES PREFERRED, REALTOR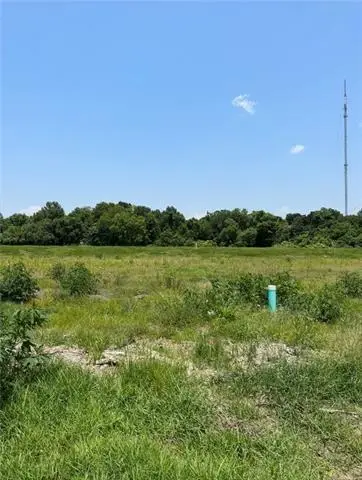 $65,000Active0.18 Acres
123 Holmes Boulevard, Terrytown, LA 70056
MLS# NO2533644Listed by: BERKSHIRE HATHAWAY HOMESERVICES PREFERRED, REALTOR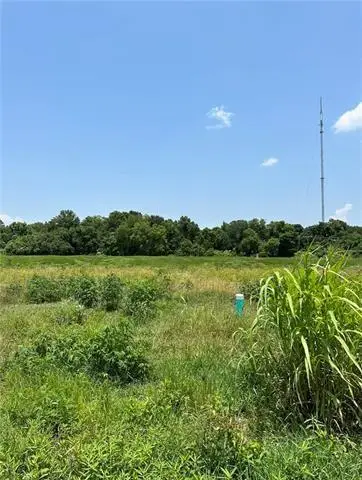 $65,000Active0.18 Acres
125 Holmes Boulevard, Terrytown, LA 70056
MLS# NO2533646Listed by: BERKSHIRE HATHAWAY HOMESERVICES PREFERRED, REALTOR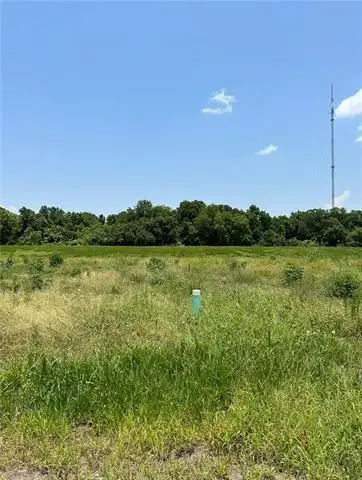 $65,000Active0.18 Acres
127 Holmes Boulevard, Terrytown, LA 70056
MLS# NO2533648Listed by: BERKSHIRE HATHAWAY HOMESERVICES PREFERRED, REALTOR $65,000Active0.18 Acres
129 Holmes Boulevard, Terrytown, LA 70056
MLS# NO2533649Listed by: BERKSHIRE HATHAWAY HOMESERVICES PREFERRED, REALTOR $65,000Active0.18 Acres
131 Holmes Boulevard, Terrytown, LA 70056
MLS# NO2533650Listed by: BERKSHIRE HATHAWAY HOMESERVICES PREFERRED, REALTOR $79,000Active0.22 Acres
133 Holmes Boulevard, Terrytown, LA 70056
MLS# NO2533651Listed by: BERKSHIRE HATHAWAY HOMESERVICES PREFERRED, REALTOR $469,000Active1.31 Acres
121-133 Holmes Boulevard, Terrytown, LA 70056
MLS# NO2533655Listed by: BERKSHIRE HATHAWAY HOMESERVICES PREFERRED, REALTOR $169,000Active4 beds 2 baths1,380 sq. ft.
624 Willowbrook Drive, Gretna, LA 70056
MLS# 2533195Listed by: C-21 RICHARD BERRY & ASSOC,INC $69,500Active0 Acres
640 Behrman Highway, Terrytown, LA 70056
MLS# NO2533478Listed by: PEOPLE'S REALTY, INC. $299,000Active5 beds 3 baths2,478 sq. ft.
144 Appletree Lane, Terrytown, LA 70056
MLS# NO2531108Listed by: COMPASS WESTBANK (COMP10) $199,000Active3 beds 2 baths1,400 sq. ft.
708 Fairlawn Drive, Gretna, LA 70056
MLS# NO2530285Listed by: COMPASS METRO (LATT01) $219,000Active4 beds 3 baths1,850 sq. ft.
617 E Marlin Court, Terrytown, LA 70056
MLS# NO2531612Listed by: NOLA LIVING REALTY $384,900Pending4 beds 3 baths2,075 sq. ft.
857 Marlene Drive, Gretna, LA 70056
MLS# 2530024Listed by: ROBERT WOLFE REAL ESTATE, INC. $370,000Pending4 beds 3 baths2,679 sq. ft.
132 Southwood Drive, Gretna, LA 70056
MLS# 2527659Listed by: CONGRESS REALTY, INC. $260,000Active5 beds 4 baths2,095 sq. ft.
724 Mystic Avenue, Gretna, LA 70056
MLS# NO2514175Listed by: BRIDGEWATER REALTY ADVISORS, LLC $219,500Active3 beds 2 baths1,400 sq. ft.
2176 Euclid Street, Terrytown, LA 70056
MLS# NO2526888Listed by: COMPASS WESTBANK (COMP10)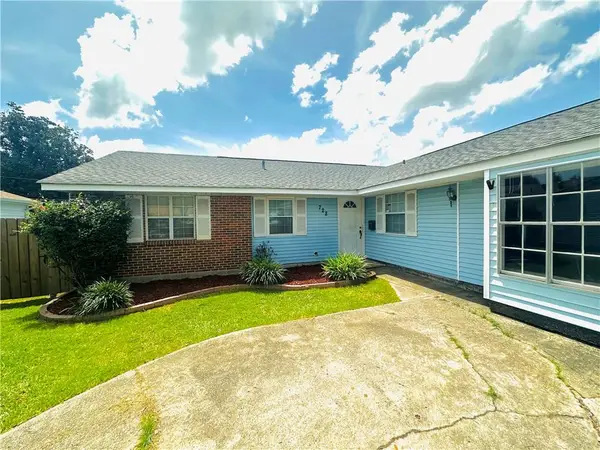 $197,999Active3 beds 2 baths1,776 sq. ft.
728 Morningside Drive, Terrytown, LA 70056
MLS# NO2526271Listed by: GULF SOUTH INTERNATIONAL, REALTORS, LLC $254,000Active3 beds 3 baths2,042 sq. ft.
392 Westmeade Drive, Gretna, LA 70056
MLS# 2525559Listed by: C-21 RICHARD BERRY & ASSOC,INC $210,000Pending3 beds 2 baths1,584 sq. ft.
2140 Graham Drive, Gretna, LA 70056
MLS# NO2524986Listed by: AT HOME REALTY GROUP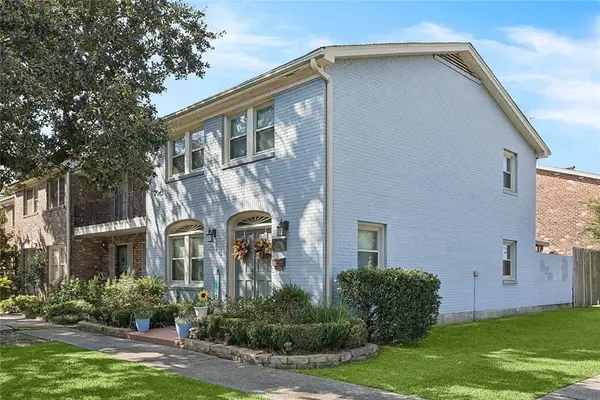 $165,000Active2 beds 3 baths1,566 sq. ft.
224 Terry Parkway #A, Terrytown, LA 70056
MLS# 2523614Listed by: KELLER WILLIAMS REALTY SERVICES $875,000Active2.36 Acres
525 Whitney Avenue, Gretna, LA 70056
MLS# NO2523669Listed by: COMPASS WESTBANK (COMP10)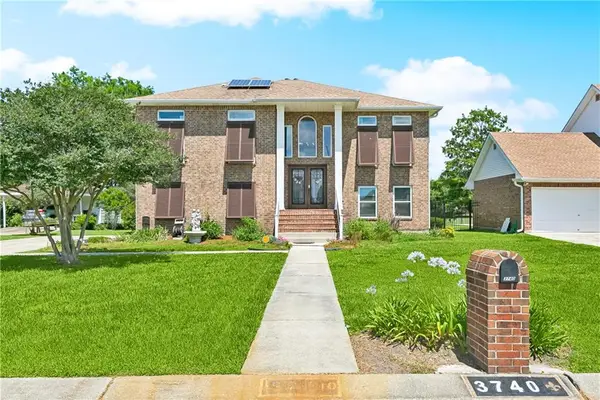 $439,000Active4 beds 3 baths2,886 sq. ft.
3740 Lake Lynn Drive, Gretna, LA 70056
MLS# RANO2503873Listed by: ARMSTRONG REALTY $375,000Active4 beds 3 baths2,397 sq. ft.
2404 Rue Saint Honore Avenue, Gretna, LA 70056
MLS# RANO2510144Listed by: HOSPITALITY REALTY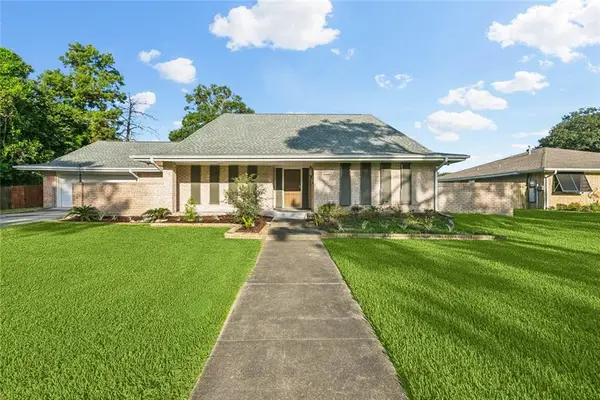 $375,000Active4 beds 4 baths2,549 sq. ft.
364 Fairfield Avenue, Gretna, LA 70056
MLS# RANO2514511Listed by: KELLER WILLIAMS REALTY 504-207-2007 $269,000Active4 beds 2 baths1,689 sq. ft.
564 Deerfield Road, Terrytown, LA 70056
MLS# NO2517400Listed by: COMPASS WESTBANK (COMP10) $599,000Active6 beds 6 baths4,467 sq. ft.
3633 Lake Michel Court, Gretna, LA 70056
MLS# RANO2501743Listed by: NEW WORLD REALTY, LLC $178,000Active3 beds 2 baths1,879 sq. ft.
208 Amapola Circle, Terrytown, LA 70056
MLS# RANO2507595Listed by: GALIANO REALTY $270,000Active4 beds 2 baths1,693 sq. ft.
800 Hickory Street, Gretna, LA 70056
MLS# RANO2517229Listed by: LATTER & BLUM (LATT01) $279,000Active4 beds 3 baths1,700 sq. ft.
419 Blossom Street, Terrytown, LA 70056
MLS# RANO2518483Listed by: UNITED REAL ESTATE PARTNERS LLC $189,000Active2 beds 1 baths1,188 sq. ft.
2130 N Butterfly Circle, Terrytown, LA 70056
MLS# RANO2518723Listed by: ROBERT WOLFE REAL ESTATE, INC. $290,000Active4 beds 2 baths2,019 sq. ft.
2157 Leslie Street, Gretna, LA 70056
MLS# RANO2519418Listed by: HOMESMART REALTY SOUTH $320,000Active4 beds 2 baths2,213 sq. ft.
316 Bienville Drive, Gretna, LA 70056
MLS# RANO2519580Listed by: RAYFORD REALTY NOLA LLC $65,000Active4 beds 3 baths2,290 sq. ft.
2125 S Glencove Lane, Gretna, LA 70056
MLS# RANO2521525Listed by: GILMORE AUCTION & REALTY CO. (A CORP.) $230,000Active3 beds 2 baths1,242 sq. ft.
356 Firethorn Drive, Gretna, LA 70056
MLS# RANO2522142Listed by: TCK REALTY LLC $275,900Active3 beds 3 baths2,218 sq. ft.
441 Bellemeade Boulevard, Gretna, LA 70056
MLS# RANO2522682Listed by: NOLA'S ESSENTIAL PROPERTY, L.L.C. $365,000Active4 beds 3 baths2,893 sq. ft.
1232 Wyndham North Other, Gretna, LA 70056
MLS# RANO2523062Listed by: BILAL A. ZUGHAYER $179,000Active3 beds 2 baths1,000 sq. ft.
1803 Cooper Road, Terrytown, LA 70056
MLS# RANO2521999Listed by: FACE TO FACE REALTY, LLC $210,000Active3 beds 2 baths1,221 sq. ft.
2836 Glenbrook Drive, Gretna, LA 70056
MLS# RANO2520768Listed by: HOMESMART REALTY SOUTH $400,000Active-- beds -- baths5,450 sq. ft.
953 E Monterey Court, Gretna, LA 70056
MLS# NO2514194Listed by: BRIDGEWATER REALTY ADVISORS, LLC $625,000Active-- beds -- baths7,545 sq. ft.
953 E Monterey Court, Gretna, LA 70056
MLS# NO2514428Listed by: BRIDGEWATER REALTY ADVISORS, LLC $224,900Active4 beds 3 baths2,400 sq. ft.
308 Briargrove Street, Gretna, LA 70056
MLS# RANO2492043Listed by: UNITED REAL ESTATE PARTNERS LLC $189,000Active3 beds 2 baths1,951 sq. ft.
2141 Esplanade Place, Gretna, LA 70056
MLS# RANO2503898Listed by: REALTY ONE GROUP IMMOBILIA $199,900Active4 beds 2 baths1,428 sq. ft.
230 Brett Drive, Gretna, LA 70056
MLS# RANO2504644Listed by: DEMPSEY ROGERS, INC. $699,000Active4 beds 4 baths3,864 sq. ft.
15 Colony Road, Gretna, LA 70056
MLS# RANO2508659Listed by: LATTER & BLUM (LATT07) $225,000Active3 beds 2 baths1,312 sq. ft.
772 Oakwood Drive, Terrytown, LA 70056
MLS# RANO2511706Listed by: KELLER WILLIAMS REALTY SERVICES $293,900Active4 beds 2 baths1,555 sq. ft.
401 Holmes Boulevard, Terrytown, LA 70056
MLS# RANO2512499Listed by: D.R.HORTON REALTY OF LOUISIANA $679,000Active4 beds 4 baths3,070 sq. ft.
110 Ciena Drive, Gretna, LA 70056
MLS# RANO2514097Listed by: TCK REALTY LLC $360,000Active4 beds 3 baths2,561 sq. ft.
748 Fairfield Avenue, Gretna, LA 70056
MLS# RANO2516718Listed by: CRESCENT SOTHEBY'S INTERNATIONAL $385,000Active4 beds 2 baths2,214 sq. ft.
3505 Lake Lynn Drive, Gretna, LA 70056
MLS# NO2439405Listed by: HOMESMART REALTY SOUTH $525,000Active3 Acres
708 Bordenave Street, Gretna, LA 70056
MLS# NO2444259Listed by: SUPREME $89,900Active0.15 Acres
224 Mae Drive, Gretna, LA 70056
MLS# NO2494790Listed by: COMPASS WESTBANK (COMP10) $270,000Active3 beds 2 baths1,914 sq. ft.
1813 Green Oak Drive, Gretna, LA 70056
MLS# NO2531595Listed by: PEOPLE'S REALTY, INC. $499,000Active5 beds 5 baths4,537 sq. ft.
2008 Harvard Lane, Gretna, LA 70056
MLS# RANO2490555Listed by: LATTER & BLUM (LATT10) $199,000Active3 beds 3 baths1,492 sq. ft.
740 Morningside Drive, Gretna, LA 70056
MLS# RANO2505175Listed by: WATERMARK REALTY, LLC $265,000Active4 beds 2 baths1,846 sq. ft.
264 Cottonwood Drive, Gretna, LA 70056
MLS# RANO2512152Listed by: MIRAMBELL REALTY $243,900Active3 beds 2 baths1,410 sq. ft.
832 Morningside Drive, Gretna, LA 70056
MLS# RANO2516103Listed by: 1ST BMG REALTY, L.L.C.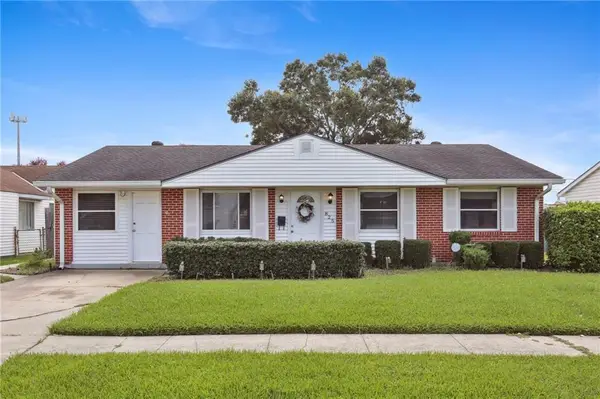 $200,000Active3 beds 2 baths1,380 sq. ft.
825 Matador Drive, Terrytown, LA 70056
MLS# RANO2508080Listed by: LATTER & BLUM (LATT10)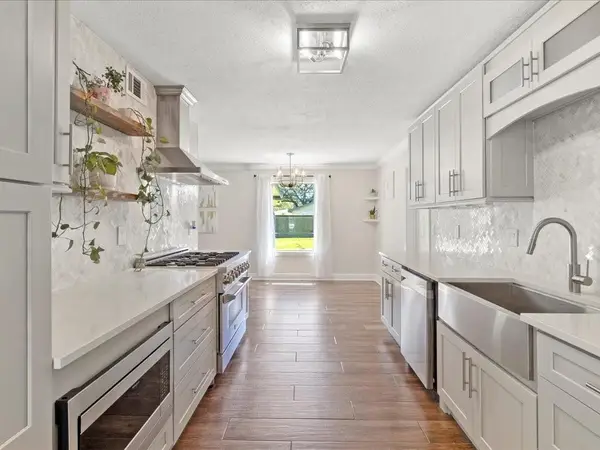 $365,000Pending4 beds 3 baths2,605 sq. ft.
1840 Carol Sue Avenue, Terrytown, LA 70056
MLS# RANO2492359Listed by: ATLAS REAL ESTATE COMPANY, LLC $249,000Pending3 beds 2 baths1,912 sq. ft.
2041 Glencove Lane, Terrytown, LA 70056
MLS# RANO2507308Listed by: NOLA LIVING REALTY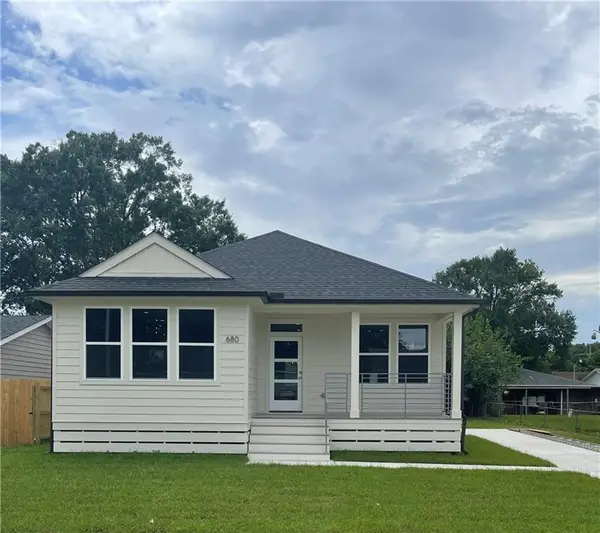 $250,000Pending3 beds 2 baths1,632 sq. ft.
680 Hunterbrook Drive, Gretna, LA 70056
MLS# RANO2510401Listed by: ESSENTIAL LIVING REALTY LLC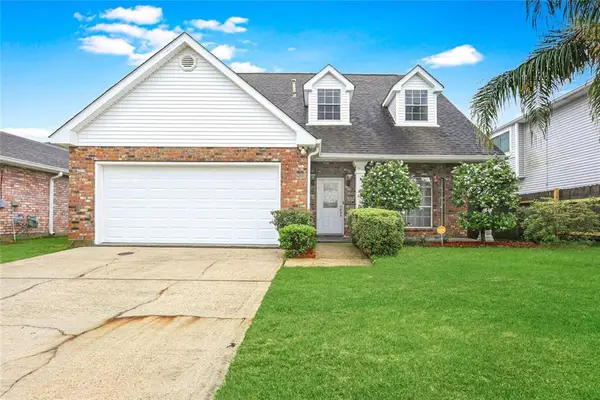 $299,000Pending4 beds 3 baths2,445 sq. ft.
2412 Ave Mont Martre, Gretna, LA 70056
MLS# RANO2511642Listed by: MIRAMBELL REALTY $240,000Pending3 beds 2 baths1,575 sq. ft.
268 Sugarpine Drive, Gretna, LA 70056
MLS# RANO2512203Listed by: SOUND REALTY LLC $216,000Pending3 beds 2 baths1,520 sq. ft.
2153 Emerson Street, Terrytown, LA 70056
MLS# RANO2513544Listed by: NOLA LIVING REALTY $490,000Pending4 beds 4 baths3,161 sq. ft.
3524 Lake Lynn Drive, Gretna, LA 70056
MLS# RANO2519149Listed by: NOLA LIVING REALTY $499,000Pending5 beds 4 baths3,666 sq. ft.
206 Timberlane Road, Gretna, LA 70056
MLS# RANO2520394Listed by: LATTER & BLUM (LATT07) $235,000Active3 beds 2 baths1,525 sq. ft.
2772 Ridgefield Road, Gretna, LA 70056
MLS# RANO2520771Listed by: CRESCENT CITY LIVING, LLC $272,900Active3 beds 3 baths1,977 sq. ft.
929 Kingsway E Street, Gretna, LA 70056
MLS# RANO2521284Listed by: LATTER & BLUM (LATT10) $129,900Active3 beds 2 baths1,000 sq. ft.
1933 Friedrica Street, Gretna, LA 70056
MLS# RANO2522586Listed by: UNITED REAL ESTATE PARTNERS LLC $100,000Active2 beds 1 baths778 sq. ft.
2425 Oxford Place #106, Gretna, LA 70056
MLS# 2516266Listed by: LATTER & BLUM (LATT10) $249,900Pending3 beds 2 baths1,276 sq. ft.
407 Holmes Boulevard, Terrytown, LA 70056
MLS# 2516027Listed by: D.R.HORTON REALTY OF LOUISIANA $190,000Pending3 beds 2 baths1,360 sq. ft.
1918 Farmington Place, Terrytown, LA 70056
MLS# 2540052Listed by: ARMSTRONG REALTY $89,900Active0.15 Acres
224 Mae Drive, Gretna, LA 70056
MLS# 2494790Listed by: COMPASS WESTBANK (COMP10) $154,999Pending3 beds 3 baths1,438 sq. ft.
218 Terry Parkway #D, Terrytown, LA 70056
MLS# 2491077Listed by: LATTER & BLUM (LATT10) $214,900Active3 beds 3 baths1,630 sq. ft.
625 W Niagara Circle, Terrytown, LA 70056
MLS# NO2488999Listed by: DANETTE O'NEAL REALTORS $177,500Pending3 beds 1 baths1,141 sq. ft.
517 Fielding Avenue, Terrytown, LA 70056
MLS# NO2454782Listed by: 1 PERCENT LISTS LEGACY $240,000Pending4 beds 3 baths2,317 sq. ft.
833 Fairfax Drive, Gretna, LA 70056
MLS# NO2466816Listed by: MIRAMBELL REALTY $349,900Active4 beds 3 baths3,330 sq. ft.
717 Fairfield Avenue, Gretna, LA 70056
MLS# 2534327Listed by: ROBERT WOLFE REAL ESTATE, INC. $385,000Active4 beds 2 baths2,214 sq. ft.
3505 Lake Lynn Drive, Gretna, LA 70056
MLS# 2439405Listed by: HOMESMART REALTY SOUTH
Local realty services provided by:CENTURY 21 Lakeshore, CENTURY 21 Action Realty, CENTURY 21 Buelow-Miller Realty
Popular searches near 70056
Popular neighborhoods near 70056
- Algiers, New Orleans homes for sale
- Algiers Point, New Orleans homes for sale
- Behrman, New Orleans homes for sale
- Bocage, New Orleans homes for sale
- Central City, New Orleans homes for sale
- East Riverside, New Orleans homes for sale
- Garden District, New Orleans homes for sale
- Irish Channel, New Orleans homes for sale
- Lower Garden District, New Orleans homes for sale
- Mary Ann Place, Gretna homes for sale
- McDonough, New Orleans homes for sale
- Naval Base, New Orleans homes for sale
- New Aurora, New Orleans homes for sale
- Old Aurora, New Orleans homes for sale
- St Thomas, New Orleans homes for sale
- Scotsdale, Harvey homes for sale
- Tall Timbers, New Orleans homes for sale
- Terry Town, Gretna homes for sale
- Touro, New Orleans homes for sale
- Whitney, New Orleans homes for sale
Counties near Gretna, 70056
- Ascension County homes for sale
- Assumption County homes for sale
- East Baton Rouge County homes for sale
- Hancock County homes for sale
- Harrison County homes for sale
- Jefferson County homes for sale
- Lafourche County homes for sale
- Livingston County homes for sale
- Orleans County homes for sale
- Pearl River County homes for sale
- Plaquemines County homes for sale
- St. Bernard County homes for sale
- St. Charles County homes for sale
- St. Helena County homes for sale
- St. James County homes for sale
- St. John the Baptist County homes for sale
- St. Tammany County homes for sale
- Tangipahoa County homes for sale
- Terrebonne County homes for sale
- Washington County homes for sale
Protect your home and budget from life's surprises with an Assurant Home Warranty, backed by a partner that supports you through every step of homeownership. Explore Plans.
©2026 Century 21 Real Estate LLC. All rights reserved. CENTURY 21®, the CENTURY 21 Logo and C21® are service marks owned by Century 21 Real Estate LLC. Century 21 Real Estate LLC fully supports the principles of the Fair Housing Act and the Equal Opportunity Act. Each office is independently owned and operated. Listing information is deemed reliable but not guaranteed accurate.