- Arabi homes for sale
- Avondale homes for sale
- Bridge City homes for sale
- Chalmette homes for sale
- Elmwood homes for sale
- Estelle homes for sale
- Gretna homes for sale
- Harahan homes for sale
- Harvey homes for sale
- Jefferson homes for sale
- Kenner homes for sale
- Marrero homes for sale
- Metairie homes for sale
- New Orleans homes for sale
- River Ridge homes for sale
- Terrytown homes for sale
- Timberlane homes for sale
- Waggaman homes for sale
- Westwego homes for sale
- Woodmere homes for sale
70119, LA - homes for sale
300 of 493 results displayed
- New
 $199,000Active-- beds -- baths1,500 sq. ft.
2713-15 Bruxelles Street, New Orleans, LA 70119
MLS# NO2560847Listed by: COMPASS UPTOWN - New
 $199,000Active4 beds 2 baths1,500 sq. ft.
2713 15 Bruxelles Street, New Orleans, LA 70119
MLS# 2560847Listed by: COMPASS UPTOWN - New
 $649,000Active-- beds -- baths3,280 sq. ft.
1517 Crete Street, New Orleans, LA 70119
MLS# NO2556856Listed by: FRERET REALTY - New
 $795,000Active-- beds -- baths3,437 sq. ft.
1520-22 Leda Court, New Orleans, LA 70119
MLS# NO2561875Listed by: REALTY ONE GROUP IMMOBILIA - New
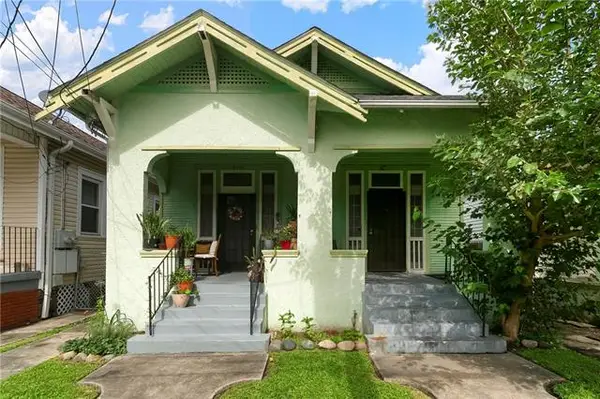
 $899,000Active4 beds 3 baths3,096 sq. ft.
321 & 325 S Telemachus Street, New Orleans, LA 70119
MLS# NO2561259Listed by: MCCARTHY GROUP REALTORS - Open Sat, 11am to 1pmNew
 $309,000Active3 beds 2 baths1,988 sq. ft.
3027 Paris Avenue, New Orleans, LA 70119
MLS# 2561878Listed by: THE W GROUP REAL ESTATE LLC - New
 $435,000Active-- beds -- baths3,221 sq. ft.
3101 Banks Street, New Orleans, LA 70119
MLS# NO2559698Listed by: COMPASS UPTOWN-MAPLE ST - New
 $795,000Active5 beds 4 baths3,437 sq. ft.
1520 Leda Court, New Orleans, LA 70119
MLS# NO2554627Listed by: REALTY ONE GROUP IMMOBILIA - Open Sun, 12am to 2pmNew
 $575,000Active3 beds 3 baths3,041 sq. ft.
3114 Palmyra Street, New Orleans, LA 70119
MLS# 2553431Listed by: COLDWELL BANKER TEC MAGAZINE - New
 $599,000Active3 beds 2 baths1,887 sq. ft.
3238 Banks Street, New Orleans, LA 70117
MLS# NO2561054Listed by: COMPASS UPTOWN - New
 $160,000Active2 beds 1 baths871 sq. ft.
530 S Rocheblave Street, New Orleans, LA 70119
MLS# NO2561449Listed by: EXP REALTY, LLC - New
 $299,000Active2 beds 2 baths1,292 sq. ft.
417 S Solomon Street, New Orleans, LA 70119
MLS# NO2561533Listed by: SNAP REALTY - New
 $340,000Active-- beds -- baths3,192 sq. ft.
3030 Pauger Street, New Orleans, LA 70119
MLS# NO2560905Listed by: POWERHOUSE REALTY GROUP - New
 $675,000Active3 beds 3 baths2,620 sq. ft.
427 S Pierce Street, New Orleans, LA 70119
MLS# NO2560889Listed by: SNAP REALTY - New
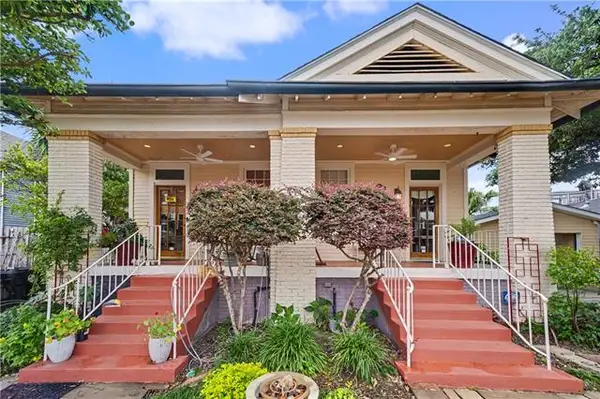
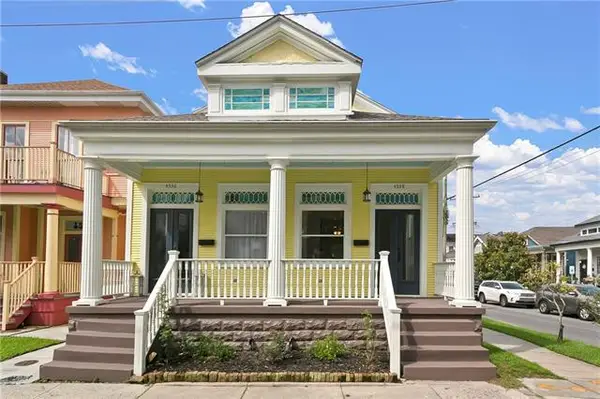 $525,000Active-- beds -- baths3,240 sq. ft.
4336-38 Palmyra Street, New Orleans, LA 70119
MLS# NO2560855Listed by: FQR REALTORS - New
 $530,000Active-- beds -- baths2,128 sq. ft.
137-39 S Murat Street, New Orleans, LA 70119
MLS# NO2561150Listed by: REVE, REALTORS - New
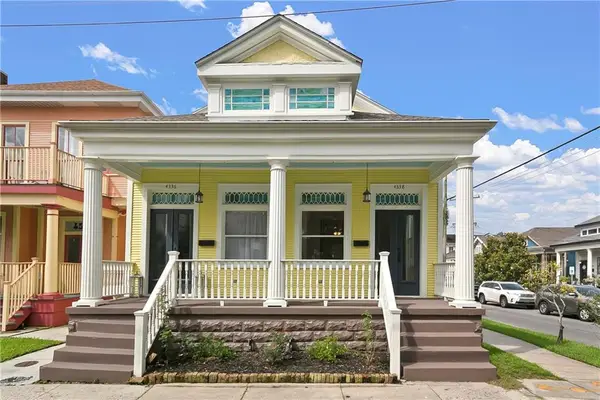 $525,000Active5 beds 5 baths3,240 sq. ft.
4336 38 Palmyra Street, New Orleans, LA 70119
MLS# 2560855Listed by: FQR REALTORS - Open Wed, 11am to 2pmNew
 $530,000Active4 beds 2 baths2,128 sq. ft.
137 39 S Murat Street, New Orleans, LA 70119
MLS# 2561150Listed by: REVE, REALTORS - Open Wed, 12 to 2pmNew
 $575,000Active3 beds 2 baths1,766 sq. ft.
4117 Stewart Court, New Orleans, LA 70119
MLS# 2560802Listed by: CRANE REALTORS - New
 $150,000Active3 beds 2 baths1,890 sq. ft.
2122 Onzaga Street, New Orleans, LA 70119
MLS# NO2560718Listed by: EXP REALTY, LLC - New
 $1,075,000Active-- beds -- baths4,193 sq. ft.
3608 Elaine Place, New Orleans, LA 70119
MLS# NO2560423Listed by: CRANE REALTORS - New
 $525,000Active-- beds -- baths4,930 sq. ft.
318-20 N Olympia Street, New Orleans, LA 70119
MLS# NO2560962Listed by: SATSUMA REAL ESTATE LLC - New
 $525,000Active13 beds 6 baths4,930 sq. ft.
318 20 N Olympia Street, New Orleans, LA 70119
MLS# 2560962Listed by: SATSUMA REAL ESTATE LLC - New
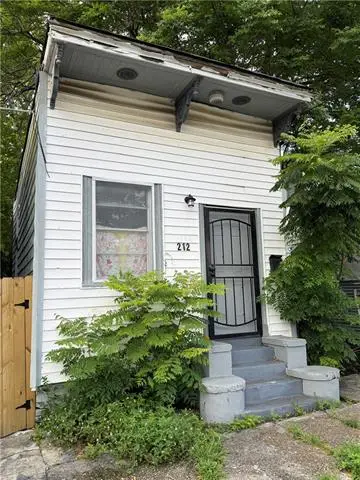 $135,000Active2 beds 2 baths732 sq. ft.
212 N Tonti Street, New Orleans, LA 70119
MLS# NO2560756Listed by: ENGEL & VOELKERS NEW ORLEANS - New
 $57,000Active0 Acres
538 S Dorgenois Street, New Orleans, LA 70119
MLS# NO2560757Listed by: THE PELLERIN GROUP NOLA LLC  $425,000Pending3 beds 3 baths1,936 sq. ft.
434 S Scott Street, New Orleans, LA 70119
MLS# NO2560551Listed by: SNAP REALTY- New
 $250,000Active3 beds 2 baths1,196 sq. ft.
2425 Allen Street, New Orleans, LA 70119
MLS# NO2560568Listed by: KEY TURNER REALTY LLC  $545,000Active3 beds 3 baths1,830 sq. ft.
709 N Salcedo Street, New Orleans, LA 70119
MLS# NO2560530Listed by: REVE, REALTORS- Open Sun, 12am to 1pm
 $475,000Active4 beds 4 baths2,144 sq. ft.
4519 Dhemecourt Street, New Orleans, LA 70119
MLS# 2560434Listed by: ENGEL & VLKERS NEW ORLEANS 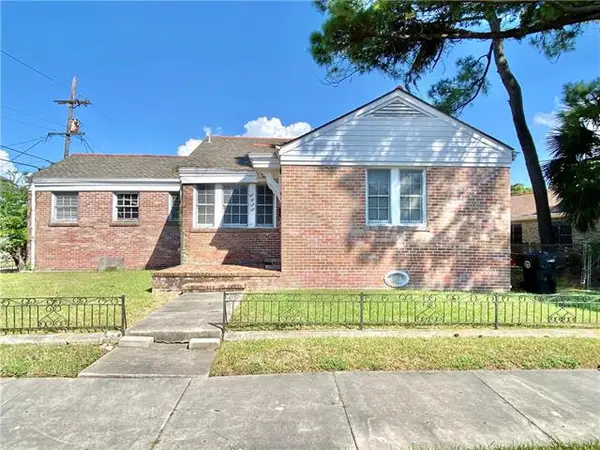 $215,000Active4 beds 3 baths2,240 sq. ft.
2835 Paris Avenue, New Orleans, LA 70119
MLS# NO2560425Listed by: GALIANO REALTY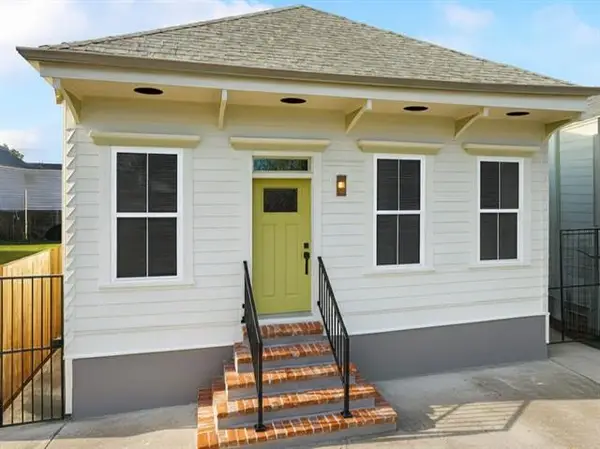 $399,000Active3 beds 2 baths1,372 sq. ft.
2748 Orleans Avenue, New Orleans, LA 70119
MLS# NO2560384Listed by: INNOVATIVE REALTY LLC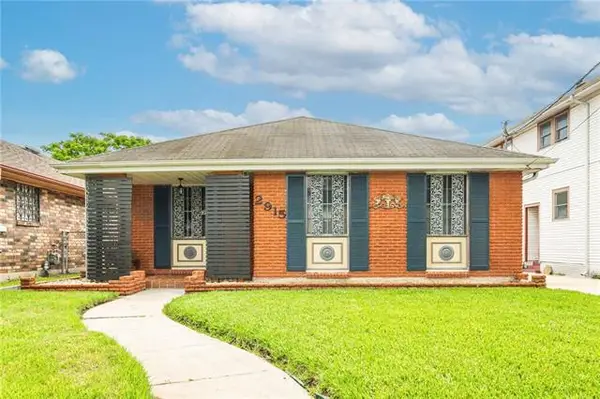 $242,500Active3 beds 2 baths1,708 sq. ft.
2915 Paris Avenue, New Orleans, LA 70119
MLS# NO2560337Listed by: HOSPITALITY REALTY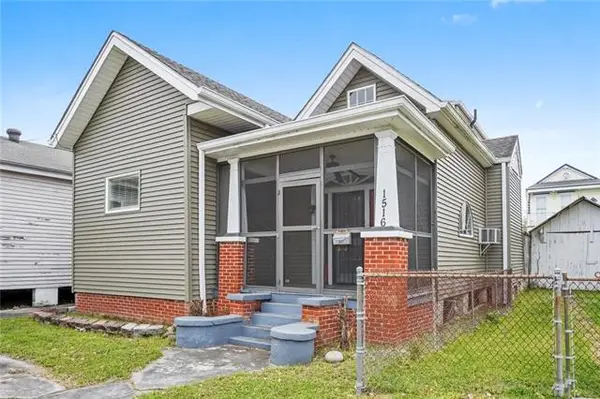 $300,000Active4 beds -- baths1,904 sq. ft.
1516 Gentilly Boulevard, New Orleans, LA 70119
MLS# NO2560300Listed by: KELLER WILLIAMS REALTY SERVICES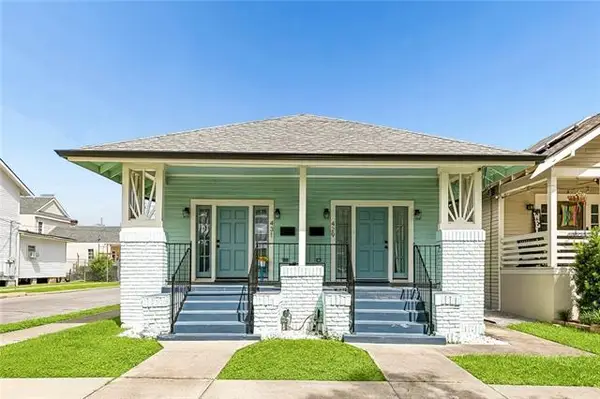 $425,000Active-- beds -- baths1,979 sq. ft.
431 & 429 S Genois Street, New Orleans, LA 70119
MLS# NO2559736Listed by: NOLA LIVING REALTY $340,000Active3 beds 2 baths1,875 sq. ft.
224 Jane Place, New Orleans, LA 70119
MLS# NO2557295Listed by: HAUS NOLA REALTY GROUP, LLC $279,000Active6 beds 4 baths2,180 sq. ft.
2600 02 Annette Street, New Orleans, LA 70119
MLS# 2560088Listed by: HOMESMART REALTY SOUTH $580,000Active-- beds -- baths2,902 sq. ft.
4149-51 Canal Street, New Orleans, LA 70119
MLS# NO2555396Listed by: UNITED REAL ESTATE PARTNERS LLC $279,000Active-- beds -- baths2,180 sq. ft.
2600-02 Annette Street, New Orleans, LA 70119
MLS# NO2560088Listed by: HOMESMART REALTY SOUTH $325,000Active3 beds 2 baths1,196 sq. ft.
1659 N Galvez Street, New Orleans, LA 70119
MLS# NO2559898Listed by: KELLER WILLIAMS REALTY NEW ORLEANS $877,200Active2 beds 3 baths2,193 sq. ft.
918 Solomon Place, New Orleans, LA 70119
MLS# 2559674Listed by: REVE, REALTORS $420,000Pending-- beds -- baths2,483 sq. ft.
632 N Alexander Street, New Orleans, LA 70119
MLS# NO2559471Listed by: THE CARSON CO. INC. OF NEW ORLEANS $630,000Active-- beds -- baths2,820 sq. ft.
912 Harding Drive, New Orleans, LA 70119
MLS# NO2559705Listed by: BERT BROWN & ASSOCIATES REAL ESTATE, LLC $630,000Active8 beds 8 baths2,820 sq. ft.
912 Harding Drive, New Orleans, LA 70119
MLS# 2559705Listed by: BERT BROWN & ASSOCIATES REAL ESTATE, LLC $140,000Active0.04 Acres
412 S Bernadotte Street, New Orleans, LA 70119
MLS# NO2558339Listed by: WITRY COLLECTIVE, L.L.C.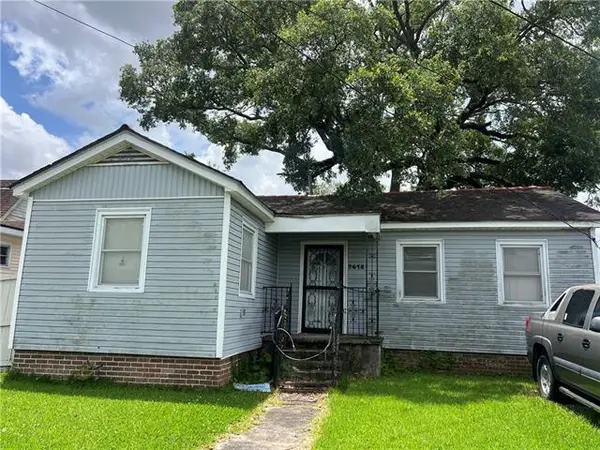 $145,000Active0.13 Acres
3618 Desaix Boulevard, New Orleans, LA 70119
MLS# NO2558976Listed by: KELLER WILLIAMS REALTY 455-0100 $649,900Active7 beds -- baths2,648 sq. ft.
4221 S Carrollton Avenue, New Orleans, LA 70119
MLS# NO2558510Listed by: HISTORIC 504 PROPERTIES $248,900Active3 beds 3 baths1,687 sq. ft.
521 S Alexander Street, New Orleans, LA 70119
MLS# NO2559057Listed by: TALBOT REALTY GROUP- Open Sun, 12 to 1:30pm
 $290,000Active4 beds 3 baths1,644 sq. ft.
527 S Galvez Street, New Orleans, LA 70119
MLS# 2559145Listed by: HOMESMART REALTY SOUTH  $244,900Active2 beds 2 baths1,260 sq. ft.
3036 Saint Peter Street, New Orleans, LA 70119
MLS# NO2559071Listed by: CONGRESS REALTY, INC. $169,900Active4 beds 2 baths1,400 sq. ft.
1983 Law Street, New Orleans, LA 70119
MLS# NO2558747Listed by: AUDUBON REALTY, LLC $685,000Active-- beds -- baths3,144 sq. ft.
4218 S Carrollton Avenue, New Orleans, LA 70119
MLS# NO2558754Listed by: BRIDGEWATER REALTY ADVISORS, LLC $245,900Active1 beds 1 baths782 sq. ft.
800 N Rendon Street #102, New Orleans, LA 70119
MLS# NO2557011Listed by: TALBOT REALTY GROUP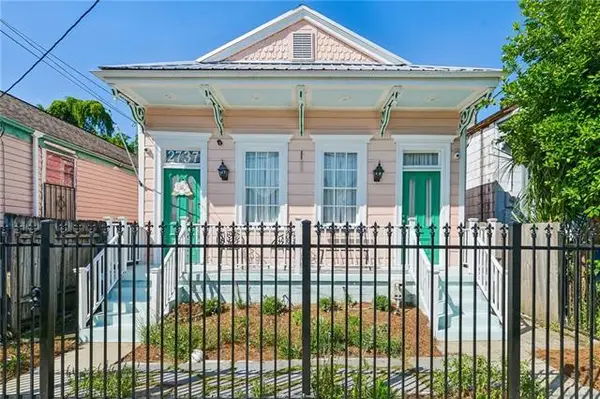 $539,000Active4 beds 3 baths1,800 sq. ft.
2737 Iberville Street, New Orleans, LA 70119
MLS# NO2558296Listed by: KELLER WILLIAMS REALTY NEW ORLEANS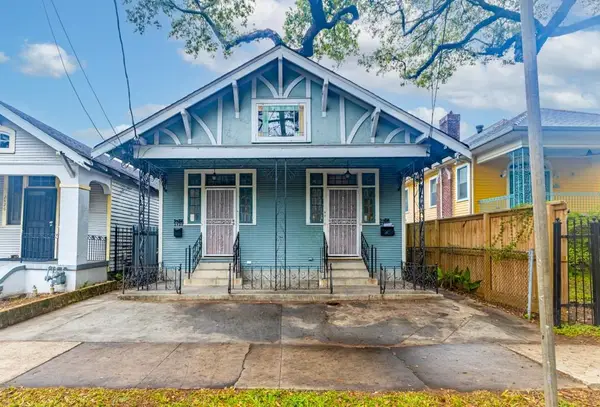 $315,000Active6 beds 2 baths1,882 sq. ft.
2428 30 Saint Bernard Avenue, New Orleans, LA 70119
MLS# 2557137Listed by: BERKSHIRE HATHAWAY HOMESERVICES PREFERRED, REALTOR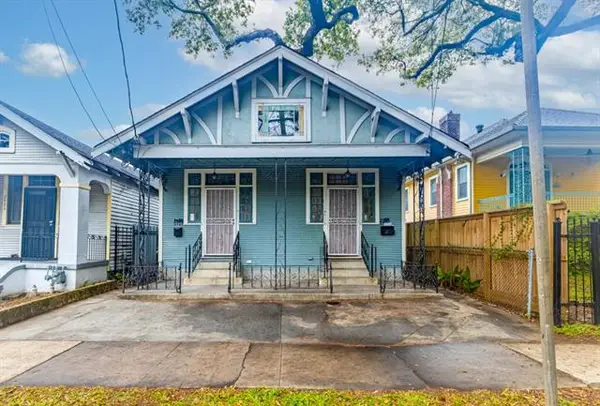 $315,000Active-- beds -- baths1,882 sq. ft.
2428-30 Saint Bernard Avenue, New Orleans, LA 70119
MLS# NO2557137Listed by: BERKSHIRE HATHAWAY HOMESERVICES PREFERRED, REALTOR $450,000Active2 beds 2 baths1,802 sq. ft.
3309 11 Dumaine Street, New Orleans, LA 70119
MLS# 2550040Listed by: REVE, REALTORS $425,000Active2 beds 2 baths2,309 sq. ft.
4705 07 Iberville Street, New Orleans, LA 70119
MLS# 2558084Listed by: CRANE REALTORS $425,000Active-- beds -- baths2,309 sq. ft.
4705-07 Iberville Street, New Orleans, LA 70119
MLS# NO2558084Listed by: CRANE REALTORS $349,900Active10 beds 6 baths3,368 sq. ft.
2080/82 N Rocheblave Street, New Orleans, LA 70119
MLS# 2553796Listed by: SUNSHINE BROKERS $349,900Active10 beds 6 baths3,368 sq. ft.
2080/82 N Rocheblave Street, New Orleans, LA 70119
MLS# NO2553796Listed by: SUNSHINE BROKERS $98,000Active0 Acres
2535 Saint Phillip Street, New Orleans, LA 70119
MLS# NO2557555Listed by: KELLER WILLIAMS REALTY 455-0100 $275,000Pending3 beds 2 baths1,231 sq. ft.
2531 Aubry Street, New Orleans, LA 70119
MLS# NO2557667Listed by: UNITED REAL ESTATE PARTNERS, LLC $635,000Active3 beds 3 baths1,830 sq. ft.
709-15 N Salcedo Street, New Orleans, LA 70119
MLS# NO2557437Listed by: REVE, REALTORS $230,000Active2 beds 2 baths924 sq. ft.
2331 Lapeyrouse Street, New Orleans, LA 70119
MLS# NO2557452Listed by: THE O.W.N. LIFE $629,000Active5 beds 4 baths3,035 sq. ft.
875 Taft Place, New Orleans, LA 70119
MLS# 2556810Listed by: HOMESMART REALTY SOUTH $375,000Active-- beds -- baths3,340 sq. ft.
211 S Olympia Street, New Orleans, LA 70119
MLS# NO2556130Listed by: WURTH REAL ESTATE SERVICES $1,200,000Pending3 beds 4 baths2,990 sq. ft.
3018 Desoto Street, New Orleans, LA 70119
MLS# NO2554096Listed by: CRESCENT SOTHEBY'S INTERNATIONAL
 $175,000Active2 beds 2 baths1,472 sq. ft.
2820 Annettee Street, New Orleans, LA 70119
MLS# 2557186Listed by: CENTURY 21 ACTION REALTY, INC. $269,000Active4 beds 2 baths1,633 sq. ft.
2544 46 St Philip Street, New Orleans, LA 70119
MLS# 2557151Listed by: CRANE REALTORS $269,000Active-- beds -- baths1,633 sq. ft.
2544-46 St Philip Street, New Orleans, LA 70119
MLS# NO2557151Listed by: CRANE REALTORS $839,500Active-- beds -- baths3,056 sq. ft.
2921 Lepage Street, New Orleans, LA 70116
MLS# NO2557123Listed by: KELLER WILLIAMS REALTY NEW ORLEANS $485,000Active2 beds 2 baths1,050 sq. ft.
2871 Ponce De Leon Street, New Orleans, LA 70119
MLS# 2556662Listed by: COMPASS MANDEVILLE (COMP15) $639,000Active-- beds -- baths3,102 sq. ft.
907-909 Wilson Drive, New Orleans, LA 70119
MLS# NO2556851Listed by: CORPORATE REALTY REALTY LEASING COMPANY, INC. $479,000Active6 beds 2 baths2,720 sq. ft.
2645 45 Saint Ann Street, New Orleans, LA 70119
MLS# 2556620Listed by: NORF REALTY LLC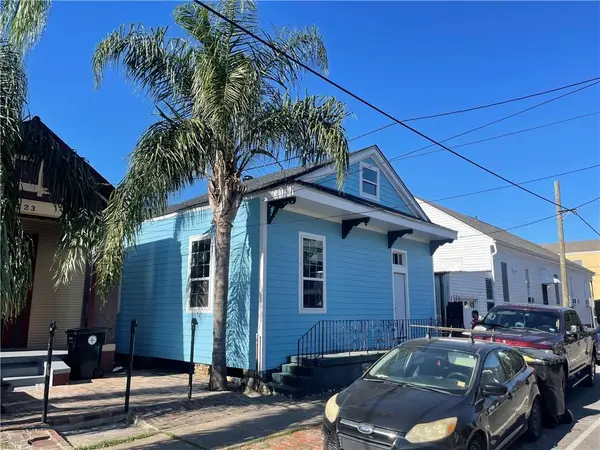 $260,000Active2 beds 1 baths560 sq. ft.
1227 N Miro Street, New Orleans, LA 70119
MLS# 2556647Listed by: SELL SAINT TAMMANY HOMES, LLC DBA HEAUXM PROS $479,000Active6 beds 4 baths2,720 sq. ft.
2645-45 Saint Ann Street, New Orleans, LA 70119
MLS# NO2556620Listed by: NORF REALTY LLC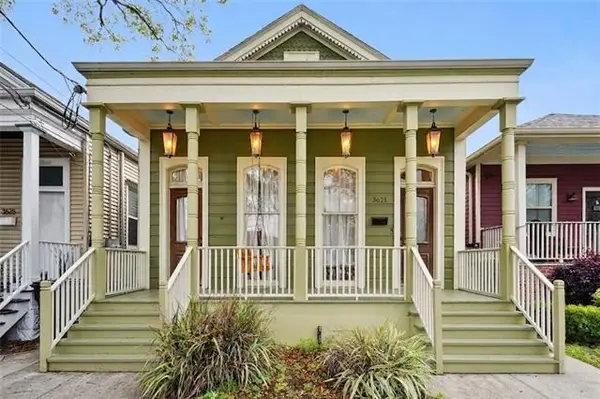 $489,000Active3 beds 3 baths1,822 sq. ft.
3621 Banks Street, New Orleans, LA 70119
MLS# NO2556488Listed by: BURK BROKERAGE, LLC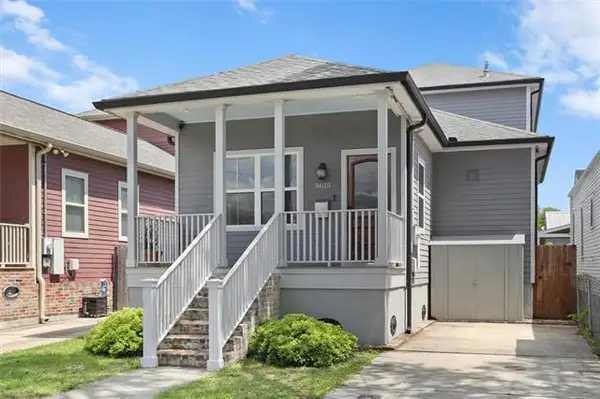 $585,000Active3 beds 3 baths2,357 sq. ft.
3615 Banks Street, New Orleans, LA 70119
MLS# NO2556525Listed by: REMAX N.O. PROPERTIES $525,000Active16 beds 8 baths8,600 sq. ft.
1863 N Rocheblave Street, New Orleans, LA 70119
MLS# NO2555750Listed by: KELLER WILLIAMS REALTY 455-0100 $405,000Pending-- beds -- baths2,064 sq. ft.
4143-45 Ulloa Street, New Orleans, LA 70119
MLS# NO2556436Listed by: SRSA RESIDENTIAL, INC. $138,000Active4 beds 2 baths1,768 sq. ft.
3217 19 Gravier Street, New Orleans, LA 70119
MLS# 2532270Listed by: COMMUNITY REALESTATE LLC $405,000Active4 beds 4 baths2,064 sq. ft.
4143 45 Ulloa Street, New Orleans, LA 70119
MLS# 2556436Listed by: SRSA RESIDENTIAL, INC.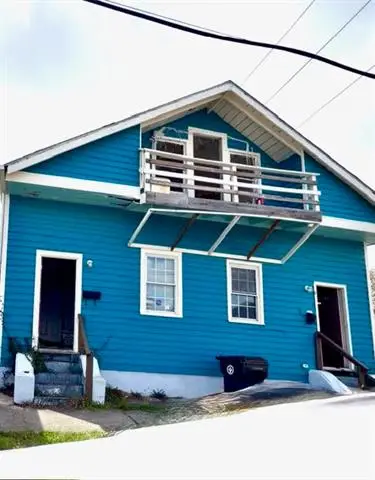 $99,000Active-- beds -- baths1,215 sq. ft.
2336-38 Lapeyrouse Street, New Orleans, LA 70119
MLS# NO2556329Listed by: THE W GROUP REAL ESTATE LLC $565,000Active-- beds -- baths2,522 sq. ft.
3107 Toulouse Street, New Orleans, LA 70119
MLS# NO2556121Listed by: CHRISTIAN SHANE PROPERTIES $649,000Active4 beds 2 baths1,920 sq. ft.
115 N Scott Street, New Orleans, LA 70119
MLS# NO2556037Listed by: AMANDA MILLER REALTY, LLC $298,000Active-- beds -- baths1,742 sq. ft.
2705 Bruxelles Street, New Orleans, LA 70119
MLS# NO2555871Listed by: REESE & COMPANY REAL ESTATE, LLC $539,500Active3 beds 3 baths1,530 sq. ft.
1620 Gentilly Boulevard, New Orleans, LA 70119
MLS# 2554230Listed by: CRESCENT SOTHEBY'S INTERNATIONAL $965,000Active-- beds -- baths3,851 sq. ft.
2820-22 Desoto Street, New Orleans, LA 70119
MLS# NO2555723Listed by: LALLA REAL ESTATE, LLC $599,000Pending3 beds 2 baths1,756 sq. ft.
2623 Lepage Street, New Orleans, LA 70119
MLS# NO2555573Listed by: REVE, REALTORS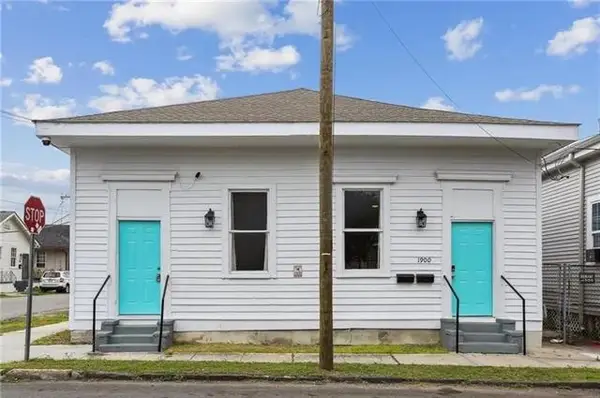 $292,500Active4 beds 3 baths2,100 sq. ft.
1900 St Philip Street, New Orleans, LA 70119
MLS# NO2555731Listed by: WITRY COLLECTIVE, L.L.C. $629,000Active0 Acres
121 S Rocheblave Street, New Orleans, LA 70119
MLS# NO2555637Listed by: NOLA LIVING REALTY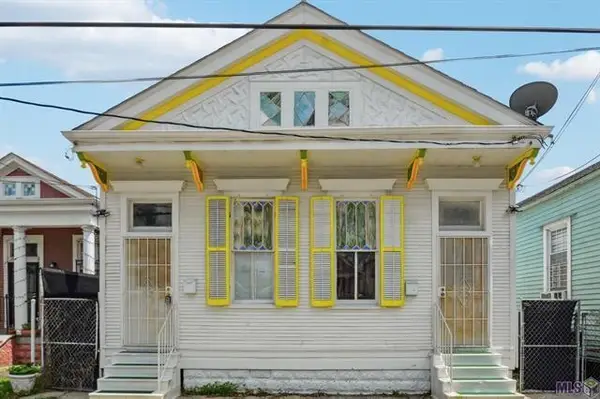 $290,000Active4 beds 2 baths1,980 sq. ft.
1668 Paul Morphy Street, New Orleans, LA 70119
MLS# 2555390Listed by: COMPASS WESTBANK (COMP10)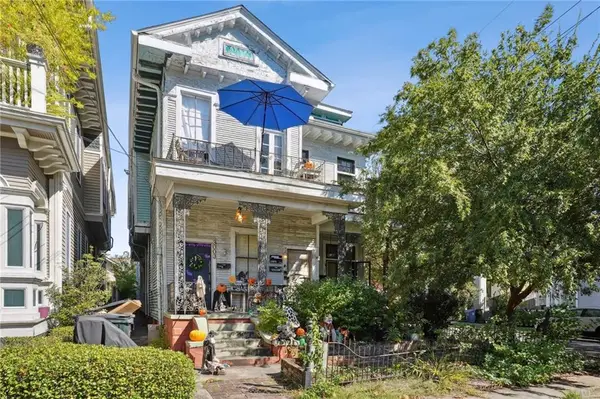 $675,000Active10 beds 4 baths4,515 sq. ft.
3001 03 Desoto Street, New Orleans, LA 70119
MLS# 2555565Listed by: BERKSHIRE HATHAWAY HOMESERVICES PREFERRED, REALTOR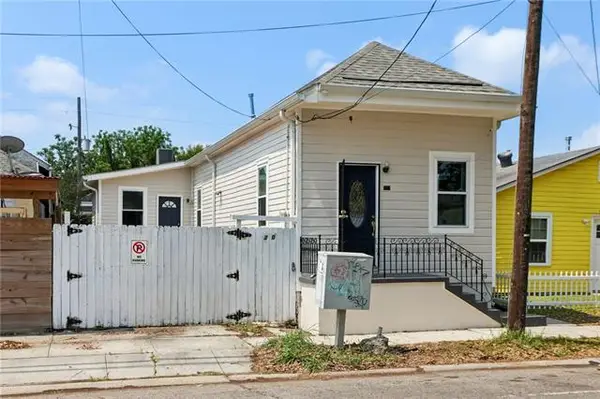 $215,000Pending3 beds 1 baths1,007 sq. ft.
3014 Orleans Avenue, New Orleans, LA 70119
MLS# NO2555578Listed by: REVE, REALTORS $675,000Active-- beds -- baths4,515 sq. ft.
3001-03 Desoto Street, New Orleans, LA 70119
MLS# NO2555565Listed by: BERKSHIRE HATHAWAY HOMESERVICES PREFERRED, REALTOR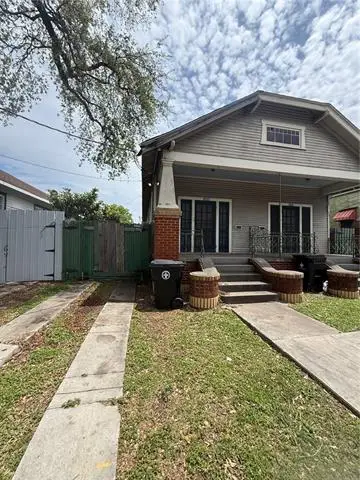 $215,000Active-- beds -- baths1,638 sq. ft.
1831-33 Elysian Fields Avenue, New Orleans, LA 70117
MLS# NO2554284Listed by: REMAX N.O. PROPERTIES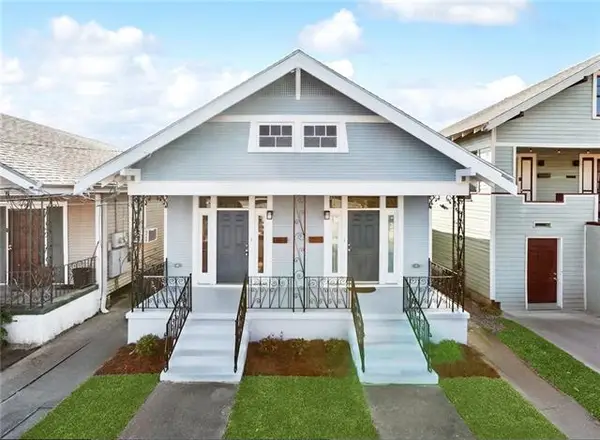 $338,000Active-- beds -- baths1,716 sq. ft.
616-618-S Hennessey Street, New Orleans, LA 70119
MLS# NO2549978Listed by: KELLER WILLIAMS REALTY 455-0100 $175,000Active-- beds -- baths1,600 sq. ft.
2424-26 A.p Tureaud Avenue, New Orleans, LA 70119
MLS# NO2552472Listed by: SNAP REALTY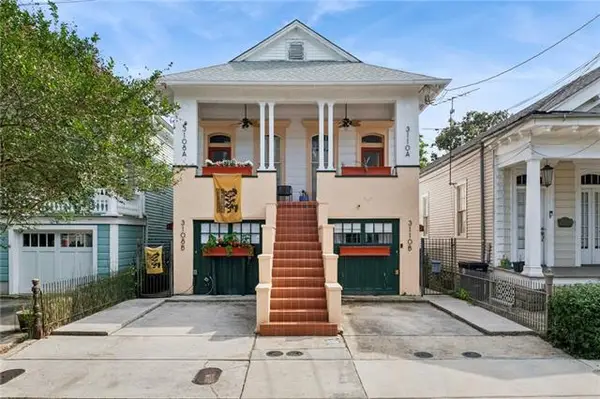 $249,000Active2 beds 1 baths1,009 sq. ft.
3110 Desoto Street #B, New Orleans, LA 70119
MLS# NO2555336Listed by: FQR REALTORS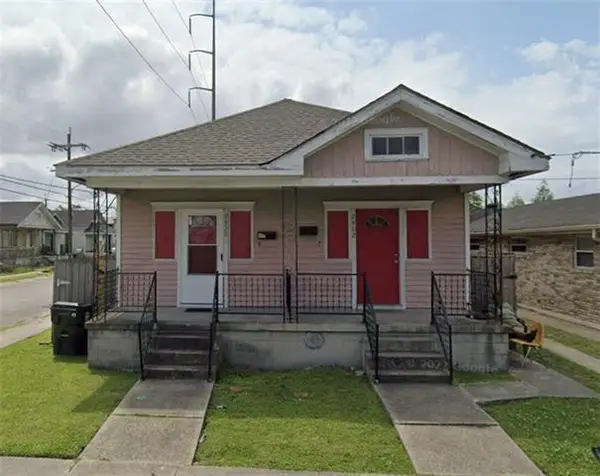 $198,900Active4 beds 2 baths1,392 sq. ft.
2400-02 New Orleans Street, New Orleans, LA 70119
MLS# NO2555368Listed by: TALBOT REALTY GROUP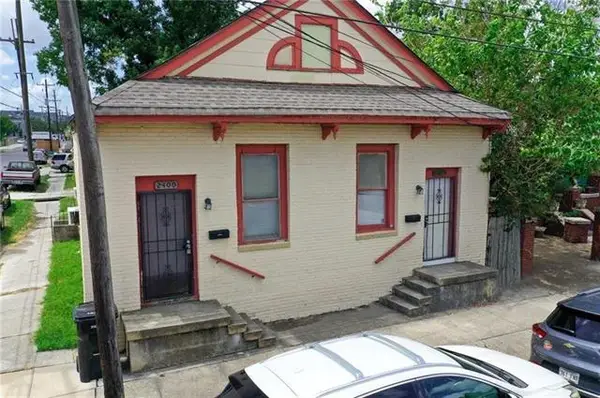 $198,900Active-- beds -- baths1,917 sq. ft.
2400-02 Dumaine Street, New Orleans, LA 70119
MLS# NO2555377Listed by: TALBOT REALTY GROUP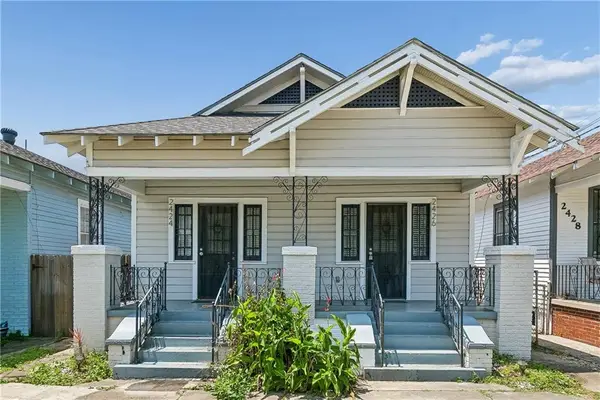 $175,000Active4 beds 2 baths1,600 sq. ft.
2424 26 A.p Tureaud Avenue, New Orleans, LA 70119
MLS# 2552472Listed by: SNAP REALTY $198,900Active4 beds 2 baths1,392 sq. ft.
2400 02 New Orleans Street, New Orleans, LA 70119
MLS# 2555368Listed by: TALBOT REALTY GROUP $198,900Active4 beds 2 baths1,917 sq. ft.
2400 02 Dumaine Street, New Orleans, LA 70119
MLS# 2555377Listed by: TALBOT REALTY GROUP $349,000Pending2 beds 2 baths1,450 sq. ft.
2333 Iberville Street, New Orleans, LA 70119
MLS# NO2554565Listed by: COLLAB REALTY, LLC $203,000Active6 beds 2 baths2,100 sq. ft.
2338-40 Annette Street, New Orleans, LA 70119
MLS# NO2552876Listed by: RED DOOR REALTY, INC. $349,900Active3 beds 2 baths1,459 sq. ft.
1655 N Dupre Street, New Orleans, LA 70119
MLS# NO2555041Listed by: COMPASS UPTOWN $240,000Active3 beds 2 baths1,432 sq. ft.
3149 St. Bernard Avenue, New Orleans, LA 70119
MLS# NO2554973Listed by: SERVICE 1ST REAL ESTATE $450,000Pending-- beds -- baths1,802 sq. ft.
3309-11 Dumaine Street, New Orleans, LA 70119
MLS# NO2550040Listed by: REVE, REALTORS $435,000Active3 beds 2 baths2,137 sq. ft.
1215 N Galvez Street, New Orleans, LA 70119
MLS# NO2554920Listed by: SATSUMA REAL ESTATE LLC $245,000Active2 beds 3 baths1,058 sq. ft.
1948 N Dorgenois Street, New Orleans, LA 70119
MLS# NO2554885Listed by: REAL BROKER, LLC $539,900Pending3 beds 3 baths1,836 sq. ft.
2730 Saint Ann Street, New Orleans, LA 70119
MLS# NO2553863Listed by: MARCOTTE & CO. REAL ESTATE $229,999Active3 beds 2 baths1,200 sq. ft.
2414 Ursuline Avenue, New Orleans, LA 70119
MLS# NO2554571Listed by: KELLER WILLIAMS REALTY 455-0100 $399,000Active0 Acres
2646 Lepage Street, New Orleans, LA 70119
MLS# NO2554775Listed by: RICCI REAL ESTATE $315,000Active3 beds 2 baths1,798 sq. ft.
2733 D'abadie Street, New Orleans, LA 70119
MLS# NO2554716Listed by: KELLER WILLIAMS REALTY NEW ORLEANS $370,000Active4 beds 2 baths1,925 sq. ft.
3500 35 Baudin Street, New Orleans, LA 70119
MLS# 2553418Listed by: CRESCENT SOTHEBY'S INTL REALTY $425,000Active-- beds -- baths2,500 sq. ft.
2630-32 New Orleans Street, New Orleans, LA 70119
MLS# NO2554336Listed by: HOMESMART REALTY SOUTH $425,000Active6 beds 4 baths2,500 sq. ft.
2630 32 New Orleans Street, New Orleans, LA 70119
MLS# 2554336Listed by: HOMESMART REALTY SOUTH $798,500Active3 beds 4 baths2,460 sq. ft.
3040 Esplanade Avenue, New Orleans, LA 70119
MLS# NO2553853Listed by: OAK TREE REALTY, LLC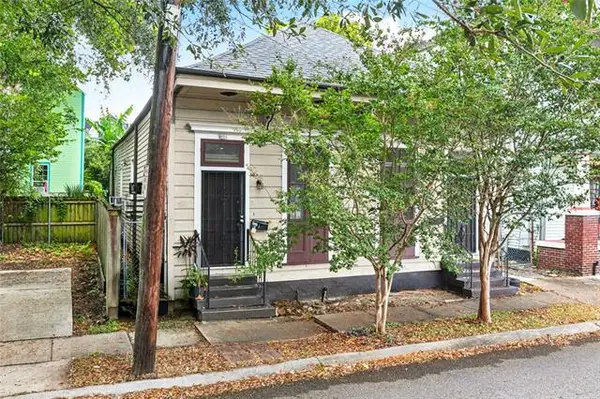 $215,000Active-- beds -- baths2,000 sq. ft.
1022 N Miro Street, New Orleans, LA 70119
MLS# NO2554208Listed by: REDFIN CORPORATION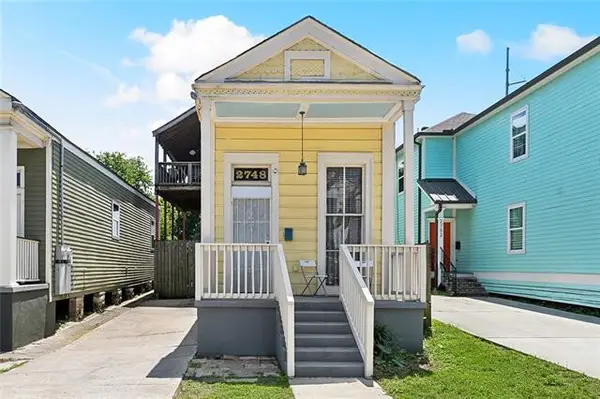 $289,500Active3 beds 3 baths1,450 sq. ft.
2748 Bienville Street, New Orleans, LA 70119
MLS# NO2554029Listed by: KELLER WILLIAMS REALTY 455-0100 $425,000Active3 beds 2 baths1,250 sq. ft.
3210 St Peter Street, New Orleans, LA 70119
MLS# 2554220Listed by: KELLER WILLIAMS REALTY 455-0100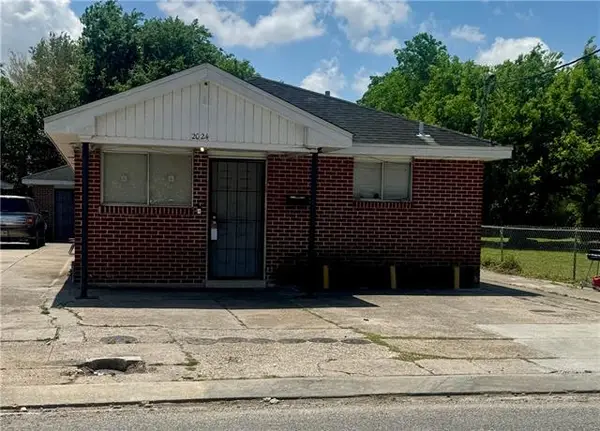 $250,000Active-- beds -- baths2,370 sq. ft.
2024 N Miro Street, New Orleans, LA 70119
MLS# NO2554134Listed by: MIRAMBELL REALTY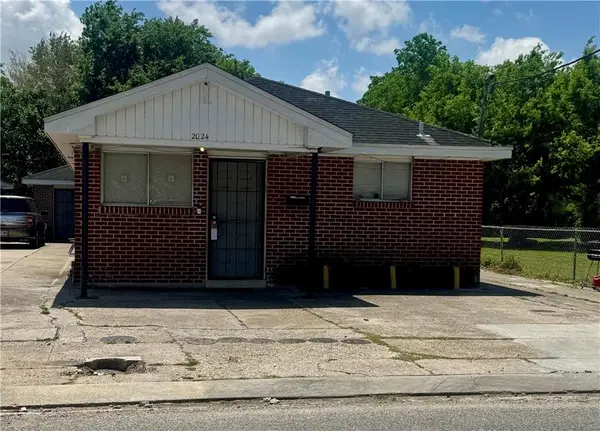 $250,000Active6 beds 4 baths2,370 sq. ft.
2028 N Miro Street, New Orleans, LA 70119
MLS# 2554146Listed by: MIRAMBELL REALTY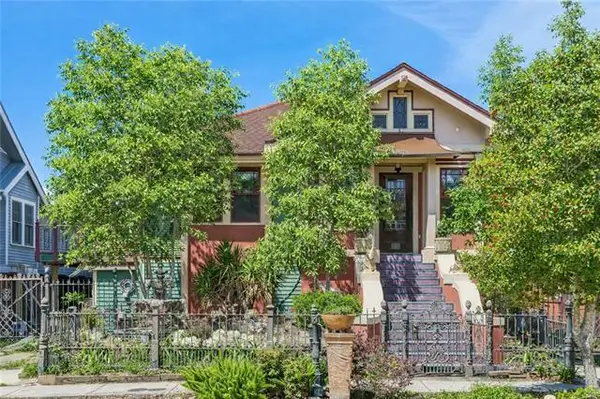 $1,045,000Active6 beds 4 baths4,300 sq. ft.
965 Taft Place, New Orleans, LA 70119
MLS# NO2553065Listed by: COMPASS UPTOWN-MAPLE ST $299,000Active2 beds 2 baths1,067 sq. ft.
2622 Bayou Road Road, New Orleans, LA 70119
MLS# NO2552744Listed by: KELLER WILLIAMS REALTY NEW ORLEANS $399,000Active-- beds -- baths1,662 sq. ft.
2744-46 Dumaine Street, New Orleans, LA 70119
MLS# NO2553969Listed by: REVE, REALTORS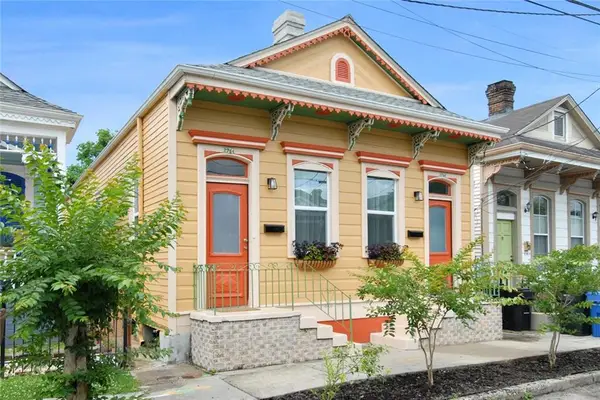 $399,000Active4 beds 2 baths1,662 sq. ft.
2744 46 Dumaine Street, New Orleans, LA 70119
MLS# 2553969Listed by: REVE, REALTORS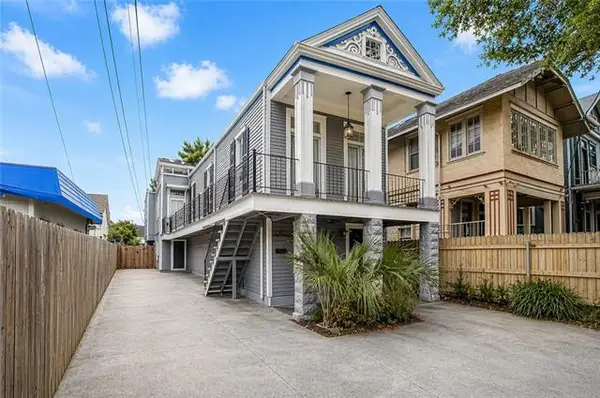 $475,000Active-- beds -- baths2,436 sq. ft.
4426 S Carrollton Avenue, New Orleans, LA 70119
MLS# NO2553265Listed by: BRIDGEWATER REALTY ADVISORS, LLC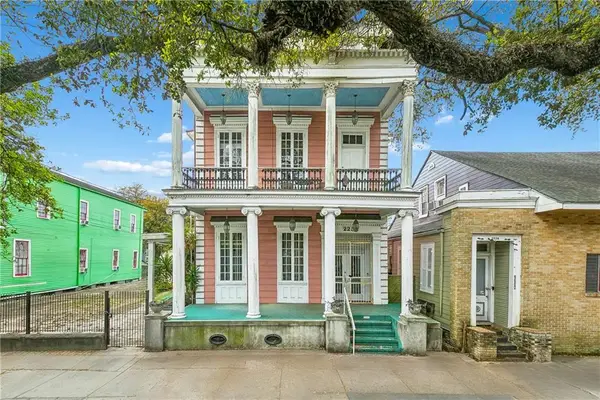 $865,000Active6 beds 6 baths4,245 sq. ft.
2232 Esplanade Avenue, New Orleans, LA 70119
MLS# 2553993Listed by: MCENERY RESIDENTIAL, LLC $370,000Active-- beds -- baths1,925 sq. ft.
3500-35 Baudin Street, New Orleans, LA 70119
MLS# NO2553418Listed by: CRESCENT SOTHEBY'S INTL REALTY $225,000Active3 beds 1 baths1,005 sq. ft.
641 S Salcedo Street, New Orleans, LA 70119
MLS# NO2552365Listed by: KELLER WILLIAMS REALTY 455-0100 $439,900Active-- beds -- baths3,005 sq. ft.
2225 Dumaine Street, New Orleans, LA 70119
MLS# NO2552668Listed by: NOLA LIVING REALTY $81,000Active-- beds -- baths1,863 sq. ft.
2055 Duels Street, New Orleans, LA 70119
MLS# NO2552932Listed by: COMPASS WESTBANK $359,900Active2 beds 2 baths1,240 sq. ft.
1024 Crete Street, New Orleans, LA 70119
MLS# NO2552940Listed by: NEW ORLEANS REAL ESTATE BOUTIQUE, LLC $150,000Active2 beds 1 baths1,000 sq. ft.
438 S Murat Street, New Orleans, LA 70119
MLS# NO2552911Listed by: REVE, REALTORS- Open Sun, 11am to 1pm
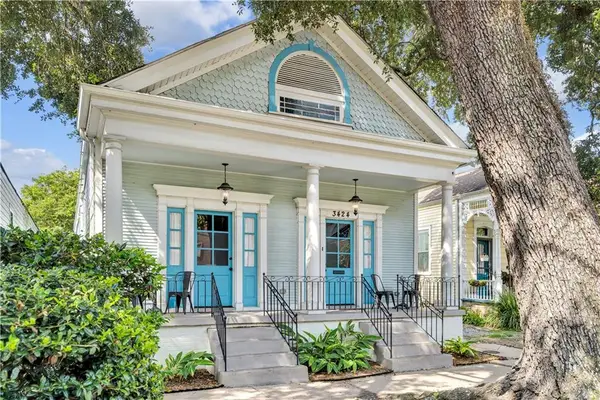 $695,000Active3 beds 3 baths1,882 sq. ft.
3424 Bienville Street, New Orleans, LA 70119
MLS# 2551039Listed by: REVE, REALTORS 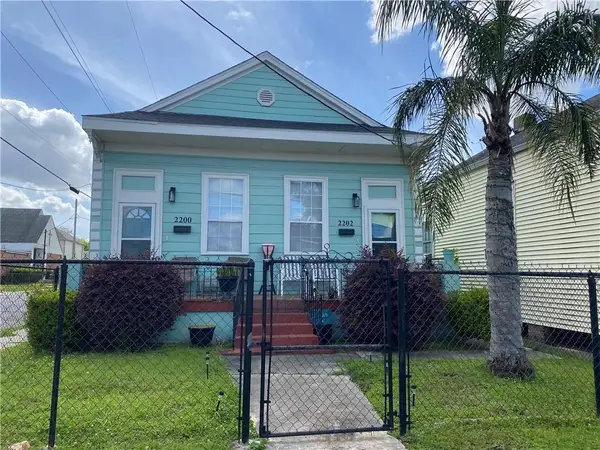 $235,000Active3 beds 2 baths1,542 sq. ft.
2200 02 Annette Street, New Orleans, LA 70119
MLS# 2552466Listed by: COMPASS HISTORIC (LATT09) $235,000Active-- beds -- baths1,542 sq. ft.
2200-02 Annette Street, New Orleans, LA 70119
MLS# NO2552466Listed by: COMPASS HISTORIC (LATT09) $565,000Active-- beds -- baths3,654 sq. ft.
3100-02 Saint Philip Street, New Orleans, LA 70119
MLS# NO2551657Listed by: FQR REALTORS $565,000Active4 beds 4 baths3,654 sq. ft.
3100 02 Saint Philip Street, New Orleans, LA 70119
MLS# 2551657Listed by: FQR REALTORS $365,000Active2 beds 2 baths1,545 sq. ft.
2836 Aubry Street, New Orleans, LA 70119
MLS# 2549579Listed by: NOLA LIVING REALTY $425,000Active0 Acres
4147 Cleveland Avenue, New Orleans, LA 70119
MLS# 2551512Listed by: CRESCENT SOTHEBY'S INTERNATIONAL $459,999Active5 beds 3 baths1,627 sq. ft.
2614 Banks Street, New Orleans, LA 70119
MLS# NO2550563Listed by: COLLAB REALTY, LLC $1,095,000Active4 beds 4 baths3,244 sq. ft.
1124 City Park Avenue, New Orleans, LA 70119
MLS# NO2551854Listed by: COMPASS GARDEN DISTRICT $469,500Active-- beds -- baths2,710 sq. ft.
2722-24 New Orleans Street, New Orleans, LA 70119
MLS# NO2550721Listed by: COMPASS UPTOWN $469,500Active6 beds 6 baths2,710 sq. ft.
2722 24 New Orleans Street, New Orleans, LA 70119
MLS# 2550721Listed by: COMPASS UPTOWN (LATT07) $899,000Active-- beds -- baths2,957 sq. ft.
1021-23 N Lopez Street, New Orleans, LA 70119
MLS# NO2551397Listed by: CRESCENT SOTHEBY'S INTERNATIONAL $249,900Active4 beds 2 baths1,580 sq. ft.
111 Alden Place, New Orleans, LA 70119
MLS# NO2551467Listed by: KERNER REALTY LLC $275,000Active-- beds -- baths2,239 sq. ft.
3010-12 Baudin Street, New Orleans, LA 70119
MLS# NO2551604Listed by: KELLER WILLIAMS REALTY NEW ORLEANS $275,000Active4 beds 2 baths2,239 sq. ft.
3010 12 Baudin Street, New Orleans, LA 70119
MLS# 2551604Listed by: KELLER WILLIAMS REALTY NEW ORLEANS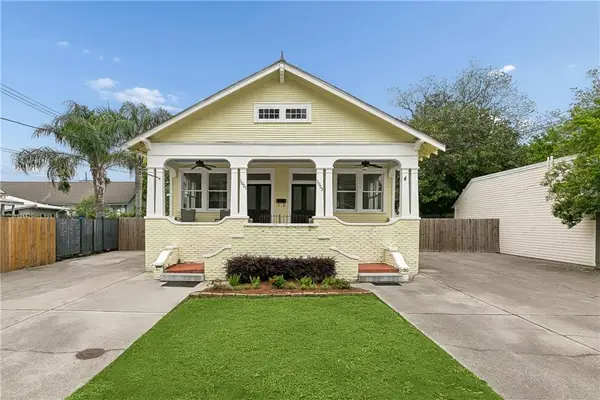 $899,000Active4 beds 3 baths2,957 sq. ft.
1021 23 N Lopez Street, New Orleans, LA 70119
MLS# 2551397Listed by: CRESCENT SOTHEBY'S INTERNATIONAL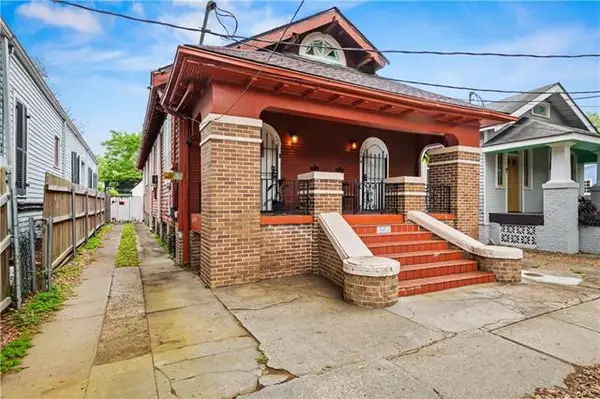 $299,000Active-- beds -- baths1,412 sq. ft.
1562 N Dorgenois Street, New Orleans, LA 70119
MLS# NO2551159Listed by: COOL MURPHY, LLC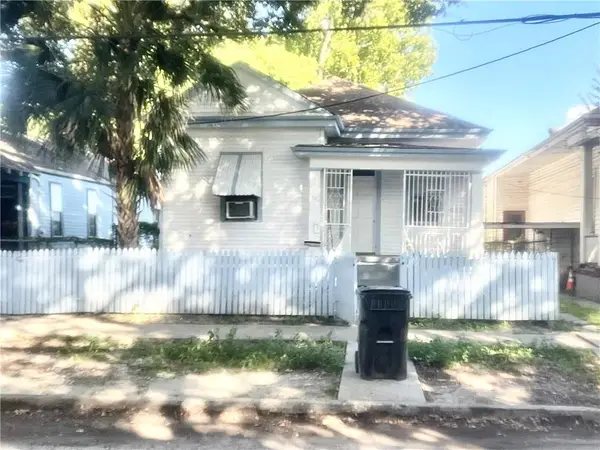 $179,000Active3 beds 1 baths1,258 sq. ft.
1520 N. Dorgenois Street, New Orleans, LA 70119
MLS# 2543258Listed by: FORTUNE 500 REAL ESTATE PROFESSIONALS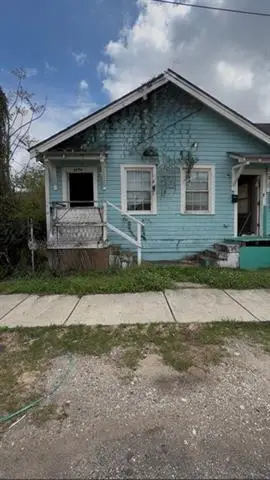 $125,000Active-- beds -- baths900 sq. ft.
1572-74 N Rocheblave Street, New Orleans, LA 70119
MLS# NO2551194Listed by: THE W GROUP REAL ESTATE LLC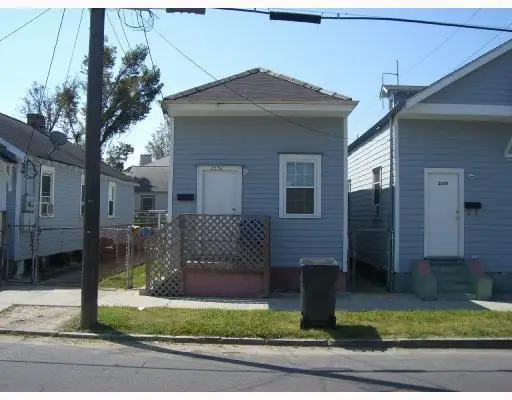 $89,000Active1 beds 1 baths600 sq. ft.
2332 Lapeyrouse Street, New Orleans, LA 70119
MLS# NO2551204Listed by: THE W GROUP REAL ESTATE LLC $125,000Active2 beds 2 baths900 sq. ft.
1572 74 N Rocheblave Street, New Orleans, LA 70119
MLS# 2551194Listed by: THE W GROUP REAL ESTATE LLC $230,000Active4 beds 2 baths1,800 sq. ft.
922 N Tonti Street, New Orleans, LA 70119
MLS# NO2550406Listed by: NOLA LIVING REALTY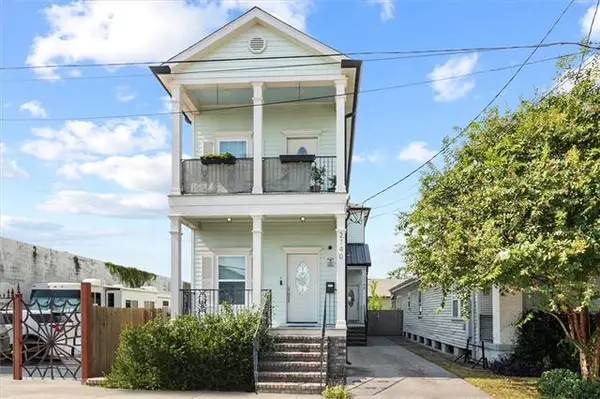 $480,000Active6 beds 6 baths2,709 sq. ft.
2740-42 Conti Street, New Orleans, LA 70119
MLS# NO2550931Listed by: FQR REALTORS $480,000Active6 beds 6 baths2,709 sq. ft.
2740 42 Conti Street, New Orleans, LA 70119
MLS# 2550931Listed by: FQR REALTORS $298,000Active-- beds -- baths1,832 sq. ft.
2312-14 Aubry Street, New Orleans, LA 70119
MLS# NO2550515Listed by: GALIANO REALTY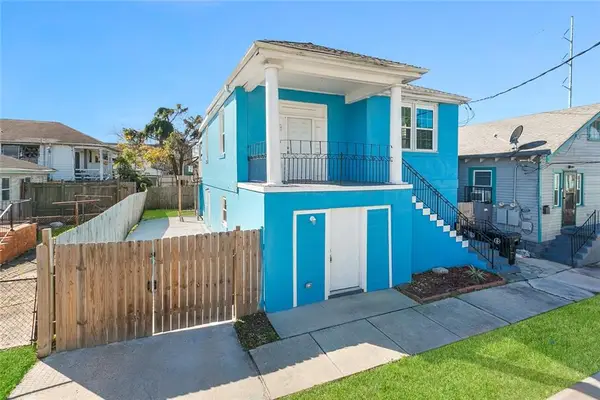 $298,000Active4 beds 2 baths1,832 sq. ft.
2312 14 Aubry Street, New Orleans, LA 70119
MLS# 2550515Listed by: GALIANO REALTY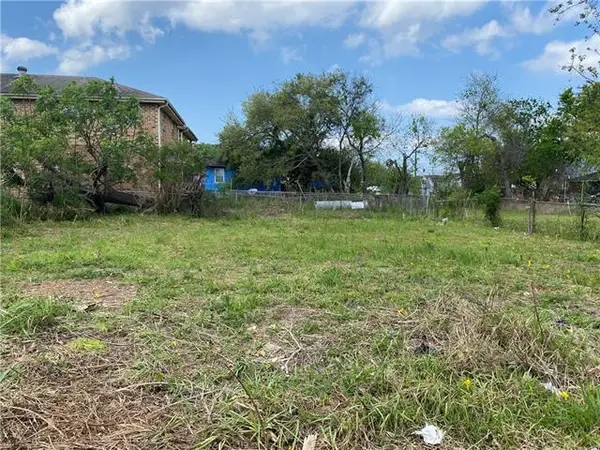 $19,000Active0 Acres
2013 N Miro Street, New Orleans, LA 70117
MLS# NO2547611Listed by: COMPASS HISTORIC (LATT09) $150,000Active2 beds 1 baths1,430 sq. ft.
1850 Industry Street, New Orleans, LA 70119
MLS# 2550492Listed by: ENGEL & VLKERS NEW ORLEANS $250,000Active0.11 Acres
224 N Norman C Francis Parkway, New Orleans, LA 70119
MLS# NO2549559Listed by: RE/MAX N.O. PROPERTIES $195,000Active-- beds -- baths3,600 sq. ft.
2323-21 N D'abadie Street, New Orleans, LA 70119
MLS# NO2550284Listed by: KEYHOLE BROKERAGE, LLC $195,000Active4 beds 2 baths3,600 sq. ft.
2323 21 N D'abadie Street, New Orleans, LA 70119
MLS# 2550284Listed by: KEYHOLE BROKERAGE, LLC $279,000Active3 beds 2 baths1,100 sq. ft.
531 S Cortez Street, New Orleans, LA 70119
MLS# NO2550146Listed by: NEW ORLEANS PROPERTY SERVICES, LLC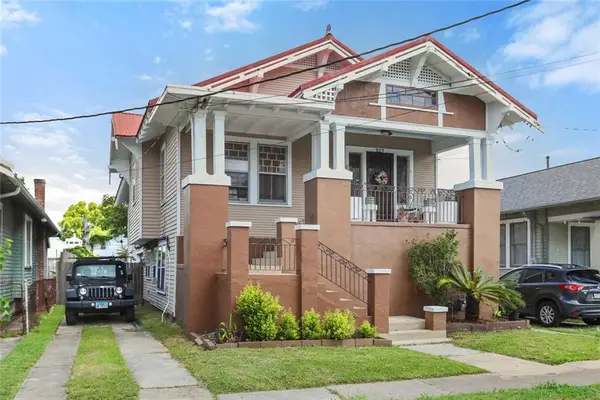 $525,000Active3 beds 2 baths3,484 sq. ft.
217 S Murat Street, New Orleans, LA 70119
MLS# RANO2521889Listed by: NEW ORLEANS PROPERTY SERVICES, LLC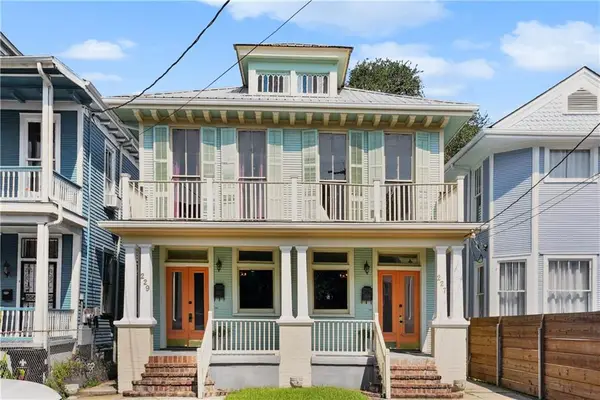 $449,000Active6 beds 4 baths3,928 sq. ft.
227 S Gayoso Street, New Orleans, LA 70119
MLS# 2550126Listed by: HOMESMART REALTY SOUTH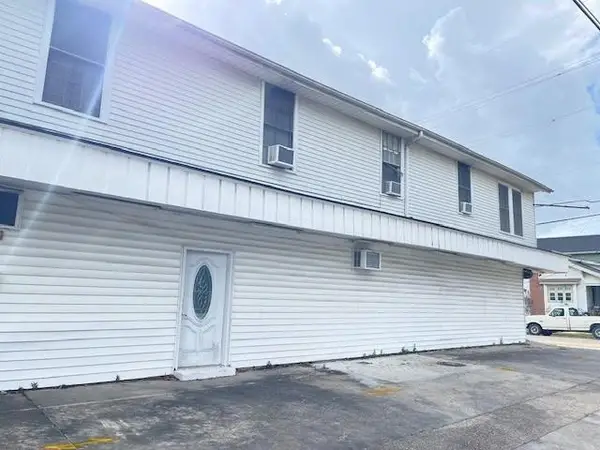 $475,000Active-- beds -- baths4,916 sq. ft.
4440 Banks Street, New Orleans, LA 70119
MLS# NO2550067Listed by: PEOPLE'S REALTY, INC.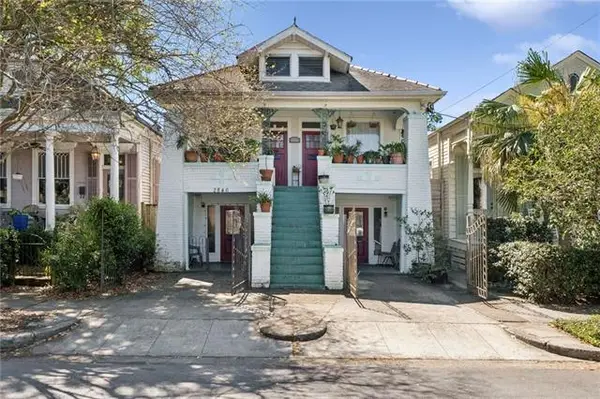 $595,000Active-- beds -- baths4,069 sq. ft.
2846 Grand Route Saint John Street, New Orleans, LA 70119
MLS# NO2549101Listed by: CRANE REALTORS $200,000Active3 beds 1 baths1,358 sq. ft.
719 S Salcedo Street, New Orleans, LA 70119
MLS# NO2550034Listed by: EXP REALTY, LLC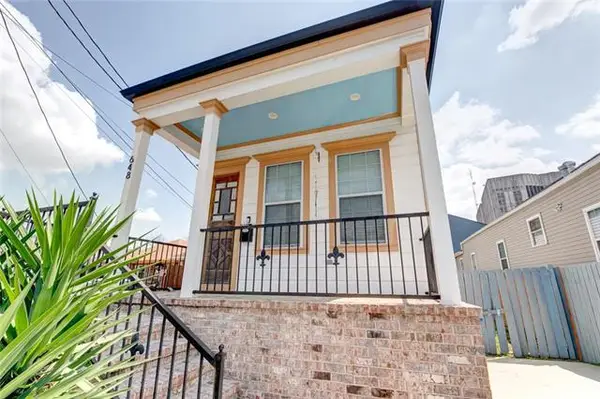 $279,000Active2 beds 1 baths869 sq. ft.
648 S Gayoso Street, New Orleans, LA 70119
MLS# NO2549707Listed by: NEXTHOME INNOVATIVE REALTY $480,000Active4 beds 3 baths2,045 sq. ft.
2630 Cleveland Avenue, New Orleans, LA 70119
MLS# 2549184Listed by: SAMANTHA BUSH REAL ESTATE SERVICES LLC $385,000Active2 beds 1 baths973 sq. ft.
2936 Fortin Street, New Orleans, LA 70119
MLS# 2549122Listed by: COMPASS UPTOWN-MAPLE ST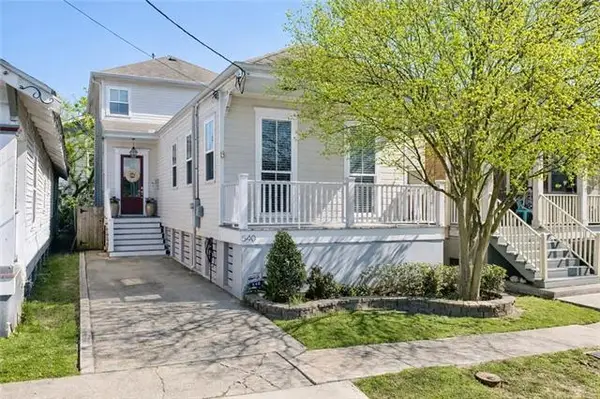 $475,000Active3 beds 3 baths1,981 sq. ft.
540 S Hennessey Street, New Orleans, LA 70119
MLS# NO2549372Listed by: REVE, REALTORS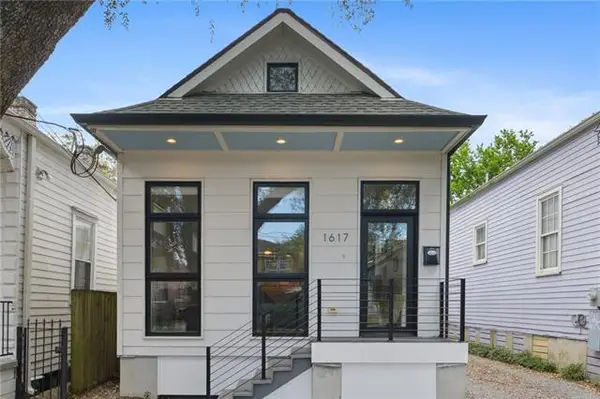 $497,000Active4 beds 5 baths1,658 sq. ft.
1617 N Dorgenois Street, New Orleans, LA 70119
MLS# NO2549773Listed by: REVE, REALTORS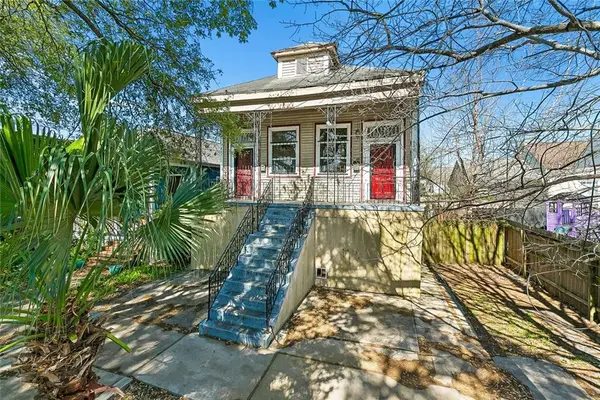 $199,000Active9 beds 4 baths3,456 sq. ft.
827 N Dorgenois Street, New Orleans, LA 70119
MLS# 2548570Listed by: NOLA LIVING REALTY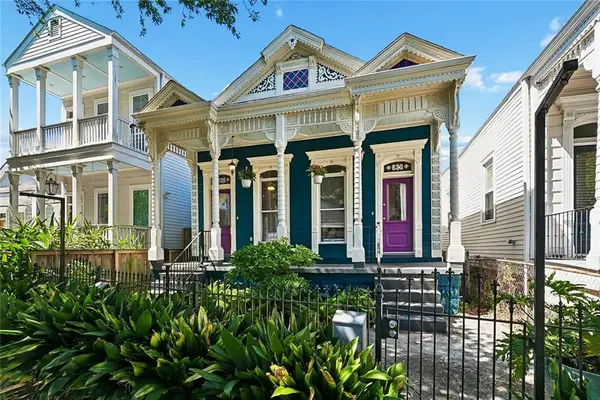 $475,000Pending4 beds 4 baths2,000 sq. ft.
633 35 S Dupre Street, New Orleans, LA 70119
MLS# 2547310Listed by: REVE, REALTORS $475,000Pending-- beds -- baths2,000 sq. ft.
633-35 S Dupre Street, New Orleans, LA 70119
MLS# NO2547310Listed by: REVE, REALTORS $865,000Active2 beds 2 baths4,245 sq. ft.
2232 Esplanade Avenue, New Orleans, LA 70119
MLS# 2549601Listed by: MCENERY RESIDENTIAL, LLC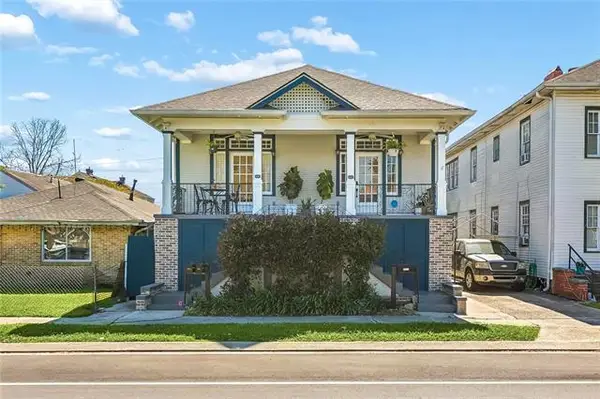 $799,000Active-- beds 3 baths4,488 sq. ft.
4532-34 Orleans Avenue, New Orleans, LA 70119
MLS# NO2548420Listed by: COMPASS GARDEN DISTRICT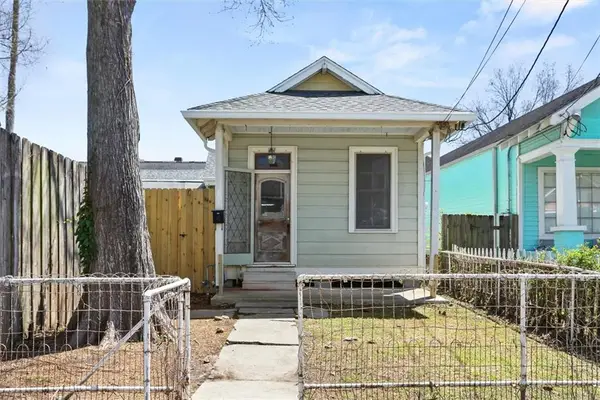 $325,000Active2 beds 2 baths1,496 sq. ft.
938 N Gayoso Street, New Orleans, LA 70119
MLS# 2548863Listed by: EXP REALTY, LLC $155,000Active0 Acres
3264 Frey Place, New Orleans, LA 70119
MLS# 2520171Listed by: WELCOME HOME NOLA, LLC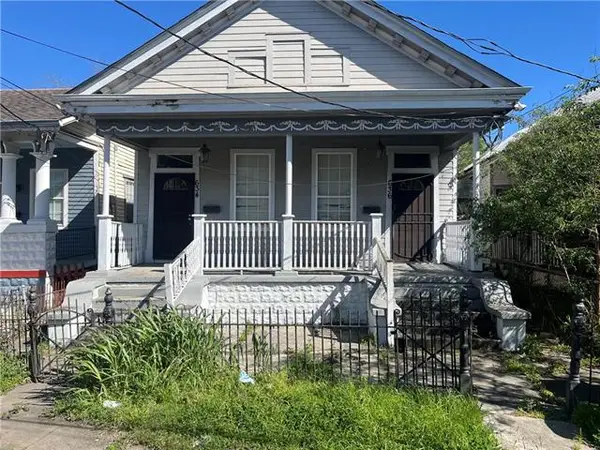 $135,000Active-- beds -- baths1,250 sq. ft.
634-63 S Rendon Street, New Orleans, LA 70119
MLS# NO2548369Listed by: KELLER WILLIAMS REALTY NEW ORLEANS $135,000Active6 beds 2 baths1,250 sq. ft.
634 63 S Rendon Street, New Orleans, LA 70119
MLS# 2548369Listed by: KELLER WILLIAMS REALTY NEW ORLEANS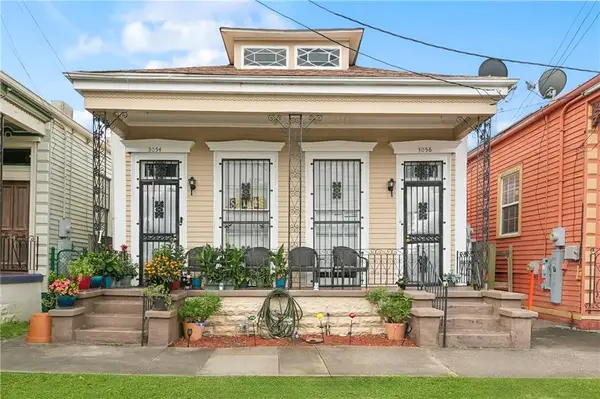 $260,000Active5 beds 2 baths1,800 sq. ft.
3054-56 St Ann Drive, New Orleans, LA 70119
MLS# 2549040Listed by: ZMD REALTY $310,000Active-- beds -- baths1,950 sq. ft.
Address Withheld By Seller, New Orleans, LA 70119
MLS# NO2548816Listed by: COMPASS METRO (LATT01) $539,000Active4 beds 4 baths3,274 sq. ft.
4501 Canal Street, New Orleans, LA 70119
MLS# NO2548565Listed by: FQR REALTORS $275,000Active-- beds -- baths1,716 sq. ft.
4125-27 D'hemecourt Street, New Orleans, LA 70119
MLS# NO2548187Listed by: REVE, REALTORS $399,000Active-- beds -- baths1,804 sq. ft.
4520 Baudin Street, New Orleans, LA 70119
MLS# NO2548748Listed by: COLLAB REALTY, LLC $275,000Active4 beds 2 baths1,716 sq. ft.
4125 27 D'hemecourt Street, New Orleans, LA 70119
MLS# 2548187Listed by: REVE, REALTORS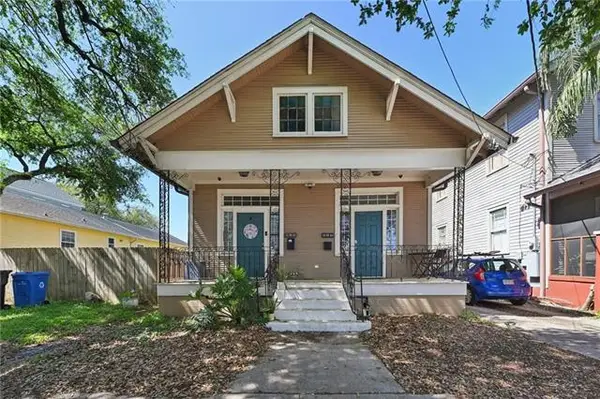 $385,000Active-- beds -- baths1,984 sq. ft.
627-29 S Alexander Street, New Orleans, LA 70119
MLS# NO2545885Listed by: EXP REALTY, LLC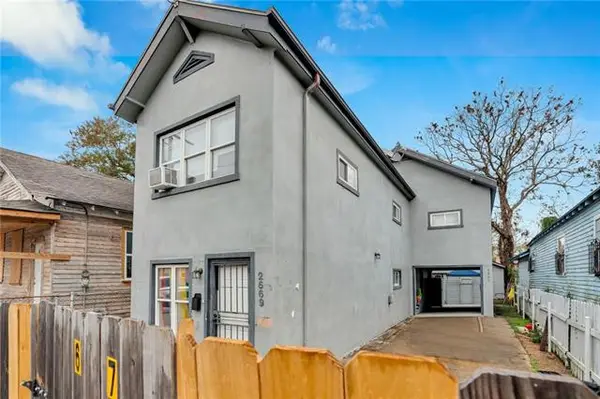 $293,000Active3 beds 3 baths2,469 sq. ft.
2669 New Orleans Street, New Orleans, LA 70119
MLS# NO2548600Listed by: TALBOT REALTY GROUP $293,000Active3 beds 2 baths2,469 sq. ft.
2669 New Orleans Street, New Orleans, LA 70119
MLS# 2548600Listed by: TALBOT REALTY GROUP $385,000Active6 beds 2 baths1,984 sq. ft.
627 29 S Alexander Street, New Orleans, LA 70119
MLS# 2545885Listed by: EXP REALTY, LLC $519,900Active-- beds -- baths2,832 sq. ft.
2226 Barracks Street, New Orleans, LA 70119
MLS# NO2548541Listed by: TALBOT REALTY GROUP $345,000Active-- beds -- baths1,836 sq. ft.
2912-14 Banks Street, New Orleans, LA 70119
MLS# NO2535240Listed by: EXP REALTY, LLC $215,000Active3 beds 2 baths1,485 sq. ft.
3219 Gibson Avenue, New Orleans, LA 70119
MLS# NO2548505Listed by: KELLER WILLIAMS REALTY 455-0100 $345,000Active4 beds 2 baths1,836 sq. ft.
2912 14 Banks Street, New Orleans, LA 70119
MLS# 2535240Listed by: EXP REALTY, LLC $184,824Active3 beds 2 baths1,420 sq. ft.
1824 N Tonti Street, New Orleans, LA 70119
MLS# 2548258Listed by: GULF SOUTH INTERNATIONAL, REALTORS, LLC $469,000Active6 beds 6 baths2,462 sq. ft.
2732 34 Iberville Street, New Orleans, LA 70119
MLS# 2545666Listed by: CHRISTIAN SHANE PROPERTIES $469,000Active-- beds -- baths2,462 sq. ft.
2732-34 Iberville Street, New Orleans, LA 70119
MLS# NO2545666Listed by: CHRISTIAN SHANE PROPERTIES $735,000Active6 beds 4 baths3,828 sq. ft.
4227-29 Saint Ann Street, New Orleans, LA 70119
MLS# 2548259Listed by: FRERET REALTY $475,000Active-- beds -- baths2,572 sq. ft.
2109-11 Columbus Street, New Orleans, LA 70119
MLS# NO2545454Listed by: EXP REALTY, LLC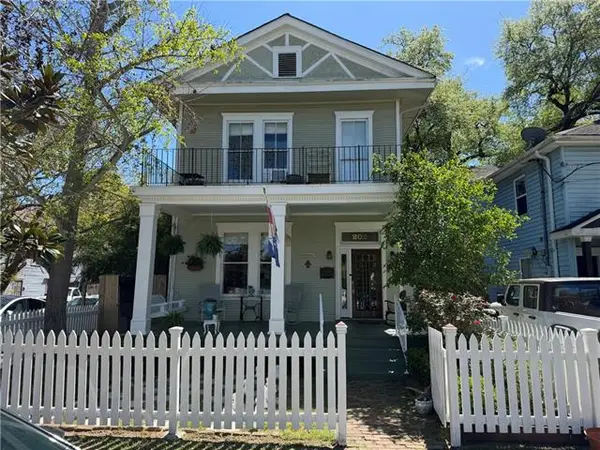 $599,000Active3 beds 3 baths2,206 sq. ft.
202 S Hennessey Street, New Orleans, LA 70119
MLS# NO2548186Listed by: HOMESMART REALTY SOUTH $549,000Pending-- beds -- baths4,465 sq. ft.
4728-30 St. Peter Street, New Orleans, LA 70119
MLS# NO2547104Listed by: RE/MAX SYNERGY $549,000Pending7 beds 4 baths4,465 sq. ft.
4728 30 St. Peter Street, New Orleans, LA 70119
MLS# 2547104Listed by: RE/MAX SYNERGY $459,000Active3 beds 2 baths1,515 sq. ft.
1729 N Dupre Street, New Orleans, LA 70119
MLS# 2544550Listed by: EXP REALTY, LLC $309,900Active3 beds 2 baths1,429 sq. ft.
1937 Hope Street, New Orleans, LA 70119
MLS# NO2545986Listed by: DONALD JULIEN & ASSOCIATES, INC. $680,000Active-- beds -- baths4,623 sq. ft.
3101 Palmyra Street, New Orleans, LA 70119
MLS# NO2547394Listed by: REDFIN CORPORATION $475,000Active-- beds -- baths4,916 sq. ft.
400 S Murat Street, New Orleans, LA 70119
MLS# NO2546759Listed by: PEOPLE'S REALTY, INC. $169,900Active1 beds 1 baths634 sq. ft.
1530 Rousselin Drive, New Orleans, LA 70119
MLS# NO2547262Listed by: TALBOT REALTY GROUP $359,000Active7 beds 3 baths3,752 sq. ft.
2421 23 Onzaga Street, New Orleans, LA 70119
MLS# 2546828Listed by: SNAP REALTY $359,000Active-- beds -- baths3,752 sq. ft.
2421-23 Onzaga Street, New Orleans, LA 70119
MLS# NO2546828Listed by: SNAP REALTY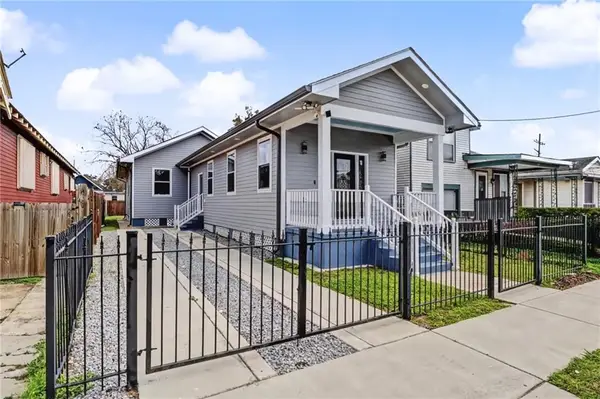 $275,000Active4 beds 2 baths1,600 sq. ft.
2321 Annette Street, New Orleans, LA 70119
MLS# 2544683Listed by: REALTY ONE GROUP IMMOBILIA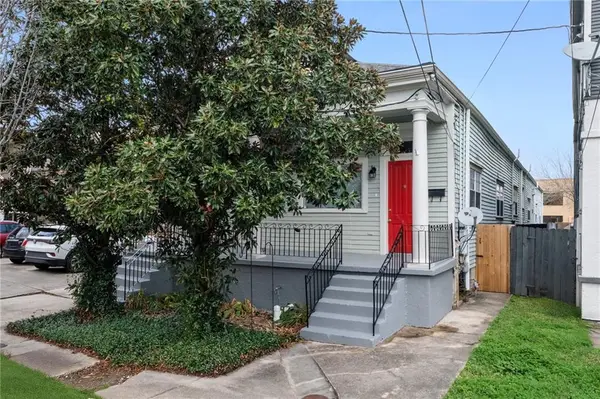 $450,000Active6 beds 2 baths3,070 sq. ft.
4033 35 Palmyra Street, New Orleans, LA 70119
MLS# 2547003Listed by: WITRY COLLECTIVE, L.L.C. $450,000Active-- beds -- baths3,070 sq. ft.
4033-35 Palmyra Street, New Orleans, LA 70119
MLS# NO2547003Listed by: WITRY COLLECTIVE, L.L.C. $649,900Pending-- beds -- baths3,000 sq. ft.
4614 - 4616 Orleans Avenue, New Orleans, LA 70119
MLS# NO2543520Listed by: NOLA LIVING REALTY $165,000Active3 beds 2 baths1,242 sq. ft.
2314 Annette Street, New Orleans, LA 70119
MLS# NO2543628Listed by: BERKSHIRE HATHAWAY HOMESERVICES PREFERRED, REALTOR $350,000Active-- beds -- baths2,612 sq. ft.
1617 N Broad Street, New Orleans, LA 70119
MLS# NO2546837Listed by: CRESCENT CITY LIVING, LLC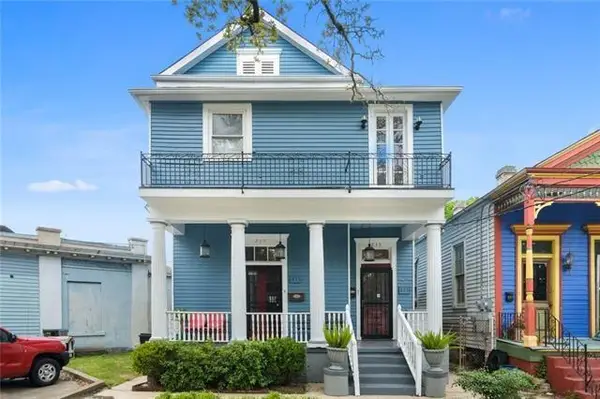 $399,000Active3 beds 3 baths3,008 sq. ft.
233-35 S Norman C Francis Parkway, New Orleans, LA 70119
MLS# 2516507Listed by: KELLER WILLIAMS REALTY NEW ORLEANS $315,000Active-- beds -- baths2,027 sq. ft.
411-13 S Hennessey Street, New Orleans, LA 70119
MLS# NO2544577Listed by: CRANE REALTORS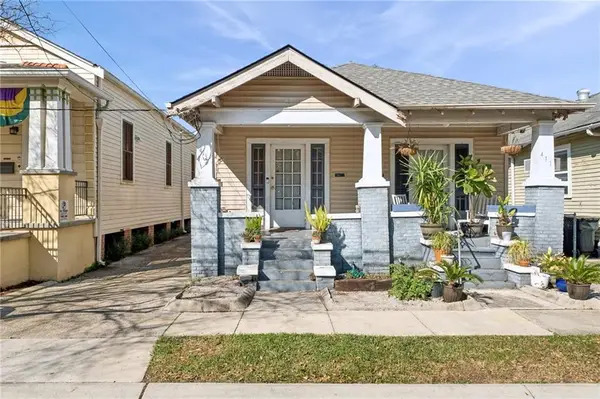 $315,000Active4 beds 2 baths2,027 sq. ft.
411 13 S Hennessey Street, New Orleans, LA 70119
MLS# 2544577Listed by: CRANE REALTORS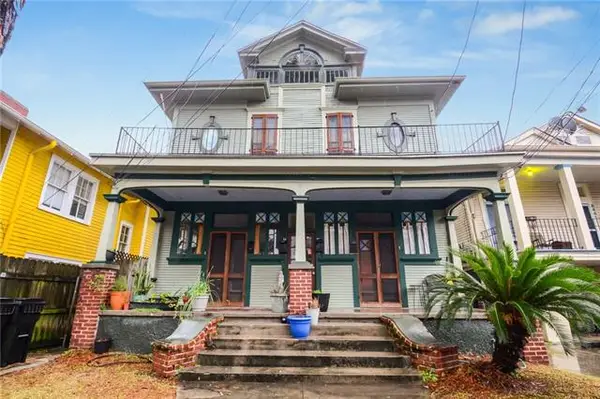 $599,000Active-- beds -- baths3,306 sq. ft.
846-48 Roosevelt Place, New Orleans, LA 70119
MLS# NO2544051Listed by: CRANE REALTORS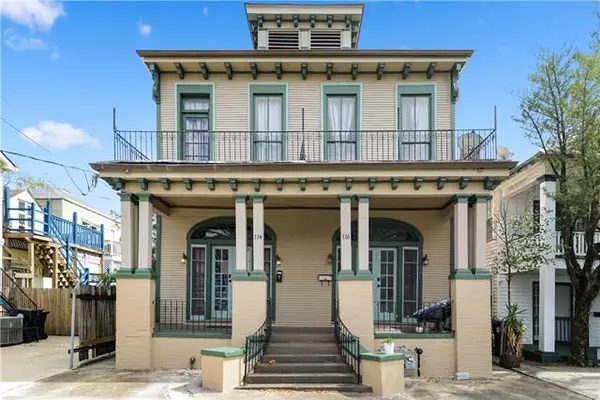 $664,900Active-- beds -- baths3,584 sq. ft.
114-16 S Hennessey Street, New Orleans, LA 70119
MLS# NO2546105Listed by: TALBOT REALTY GROUP $599,000Active6 beds 4 baths3,306 sq. ft.
846 48 Roosevelt Place, New Orleans, LA 70119
MLS# 2544051Listed by: CRANE REALTORS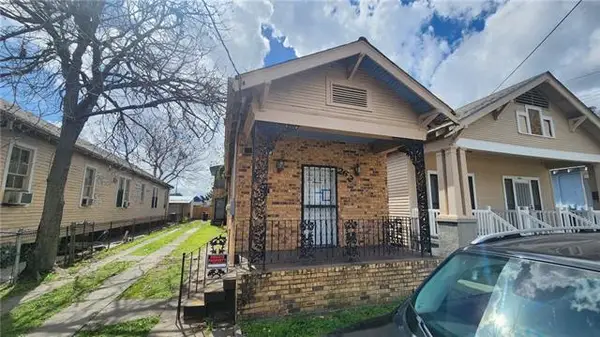 $184,500Active2 beds 1 baths1,600 sq. ft.
2628 O'reilly Street, New Orleans, LA 70119
MLS# NO2546180Listed by: CENTURY 21 ACTION REALTY, INC. $1,285,000Pending-- beds -- baths3,935 sq. ft.
1349-51 Moss Street, New Orleans, LA 70119
MLS# NO2544590Listed by: FQR REALTORS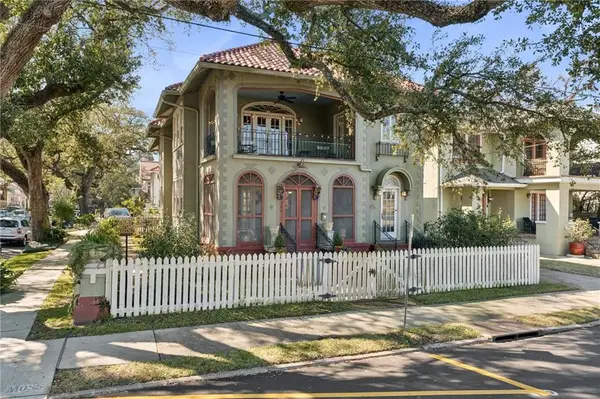 $1,285,000Active6 beds 4 baths3,935 sq. ft.
1349 51 Moss Street, New Orleans, LA 70119
MLS# 2544590Listed by: FQR REALTORS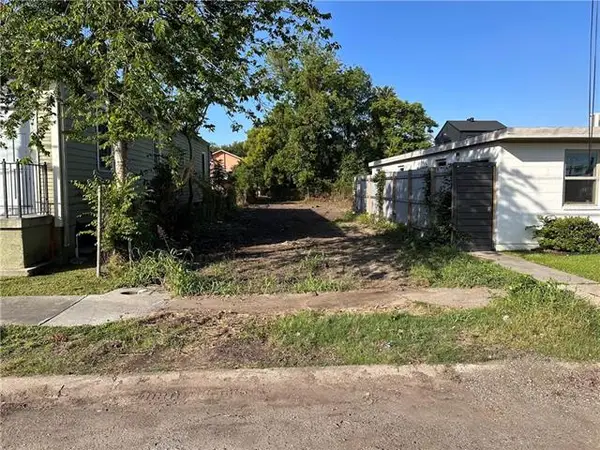 $85,000Pending0.1 Acres
2532 Conti Street, New Orleans, LA 70119
MLS# NO2546126Listed by: REVE, REALTORS $325,000Active6 beds 3 baths2,884 sq. ft.
1616 18 Rousselin Drive, New Orleans, LA 70119
MLS# 2544462Listed by: CRANE REALTORS $325,000Active-- beds -- baths2,884 sq. ft.
1616-18 Rousselin Drive, New Orleans, LA 70119
MLS# NO2544462Listed by: CRANE REALTORS $674,900Active-- beds -- baths3,584 sq. ft.
114-116 S Hennessey Street, New Orleans, LA 70119
MLS# NO2546030Listed by: TALBOT REALTY GROUP $129,000Active1 beds 1 baths523 sq. ft.
2207 St Ann Street, New Orleans, LA 70119
MLS# NO2544959Listed by: COMPASS GARDEN DISTRICT $360,000Active3 beds 4 baths2,349 sq. ft.
4721 Baudin Street, New Orleans, LA 70119
MLS# NO2541898Listed by: REAL BROKER, LLC $1,260,000Active-- beds -- baths4,735 sq. ft.
2101 Esplanade Avenue, New Orleans, LA 70119
MLS# NO2545769Listed by: COMPASS UPTOWN $224,900Pending2 beds 2 baths1,180 sq. ft.
200 Helena Street, New Orleans, LA 70119
MLS# NO2545730Listed by: HERA REALTY $375,000Active4 beds 2 baths2,464 sq. ft.
4418-20 D'hemecourt Street, New Orleans, LA 70119
MLS# NO2545439Listed by: REMAX N.O. PROPERTIES $375,000Active4 beds 2 baths2,464 sq. ft.
4418 20 D'hemecourt Street, New Orleans, LA 70119
MLS# 2545439Listed by: RE/MAX N.O. PROPERTIES $190,000Active3 beds 2 baths1,224 sq. ft.
1573 N Galvez Street, New Orleans, LA 70119
MLS# NO2544984Listed by: BOYD REALTORS, LLC $579,000Active-- beds -- baths2,875 sq. ft.
300/302 S Scott Street, New Orleans, LA 70119
MLS# NO2544782Listed by: FORTUNA REAL ESTATE LLC $175,000Active0.08 Acres
313 S Saint Patrick Street, New Orleans, LA 70119
MLS# NO2543761Listed by: REAL BROKER, LLC $266,000Active4 beds 2 baths1,794 sq. ft.
2415 17 Republic Street, New Orleans, LA 70119
MLS# 2544502Listed by: KELLER WILLIAMS REALTY NEW ORLEANS $266,000Active-- beds -- baths1,794 sq. ft.
2415-17 Republic Street, New Orleans, LA 70119
MLS# NO2544502Listed by: KELLER WILLIAMS REALTY NEW ORLEANS $399,000Active-- beds -- baths1,750 sq. ft.
539-41 S Miro Street, New Orleans, LA 70119
MLS# NO2543181Listed by: CRESCENT SOTHEBY'S INTERNATIONAL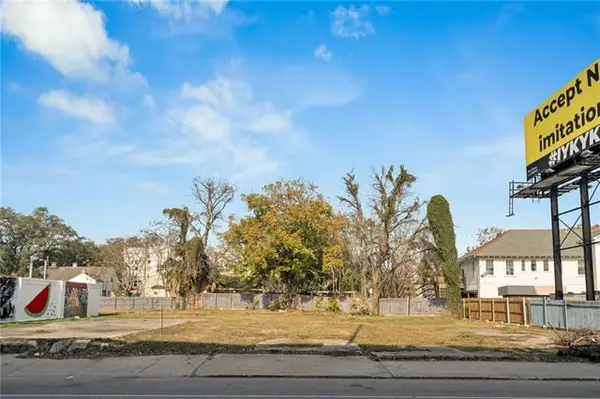 $385,000Active0.39 Acres
1245 N Claiborne Avenue, New Orleans, LA 70119
MLS# NO2544839Listed by: CORPORATE REALTY LEASING COMPANY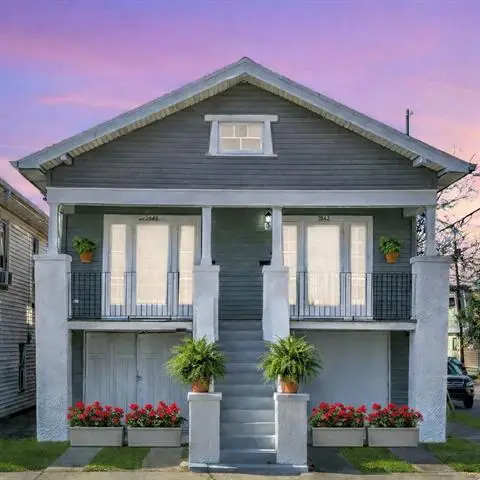 $399,000Pending-- beds -- baths1,500 sq. ft.
3840-42 Orleans Avenue, New Orleans, LA 70119
MLS# NO2544535Listed by: RE/MAX SYNERGY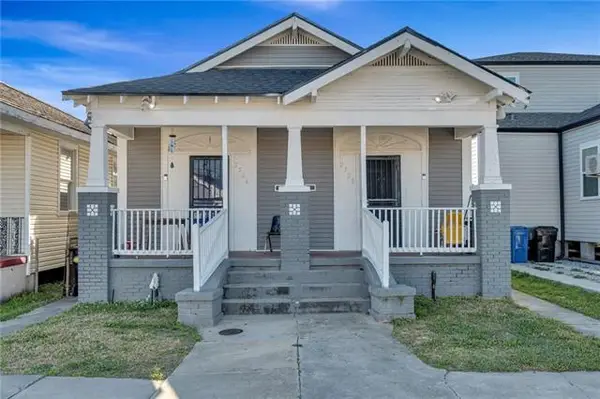 $255,000Active-- beds -- baths1,776 sq. ft.
2526-28 Annette Street, New Orleans, LA 70119
MLS# NO2544573Listed by: TJONES & CO, LLC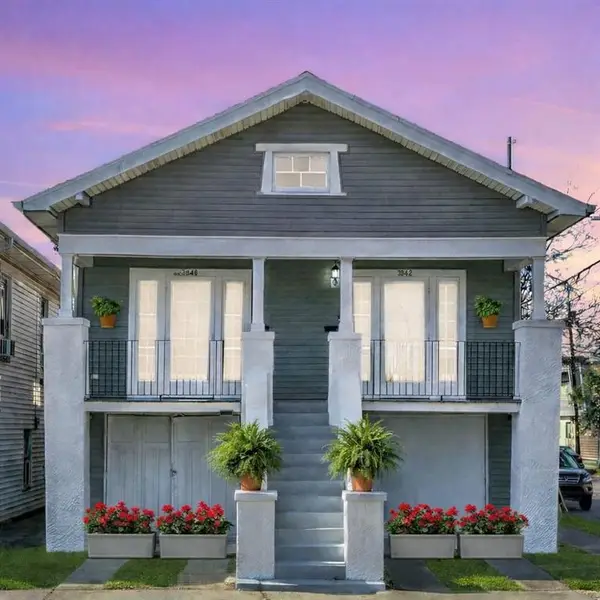 $399,000Active4 beds 2 baths1,500 sq. ft.
3840 42 Orleans Avenue, New Orleans, LA 70119
MLS# 2544535Listed by: RE/MAX SYNERGY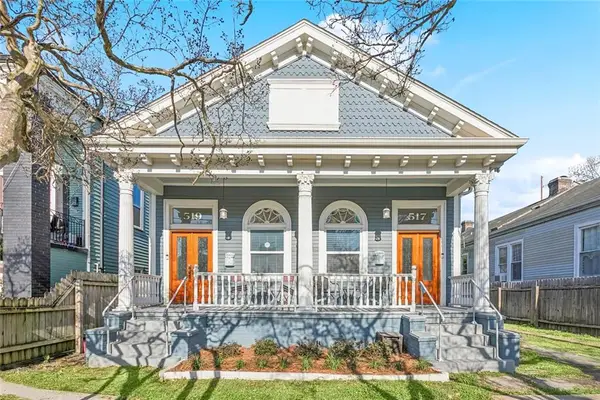 $499,000Pending6 beds 2 baths2,550 sq. ft.
517 19 S Scott Street, New Orleans, LA 70119
MLS# 2544574Listed by: SNAP REALTY $557,000Active3 beds 3 baths2,046 sq. ft.
2322 Saint Louis Street, New Orleans, LA 70119
MLS# NO2540670Listed by: FALAYA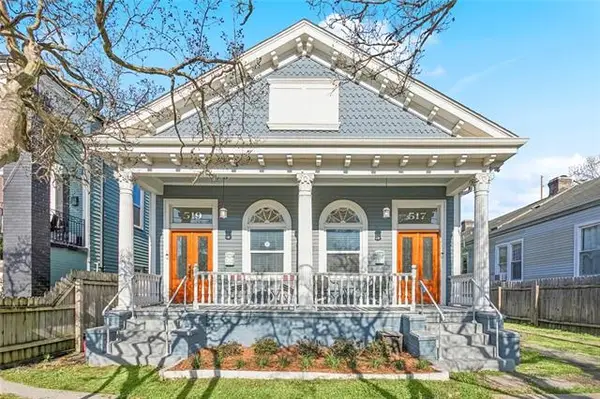 $499,000Pending-- beds -- baths2,550 sq. ft.
517-19 S Scott Street, New Orleans, LA 70119
MLS# NO2544574Listed by: SNAP REALTY $290,000Active3 beds 2 baths1,325 sq. ft.
2718 St Ann Street, New Orleans, LA 70119
MLS# 2544253Listed by: CRESCENT CITY LIVING, LLC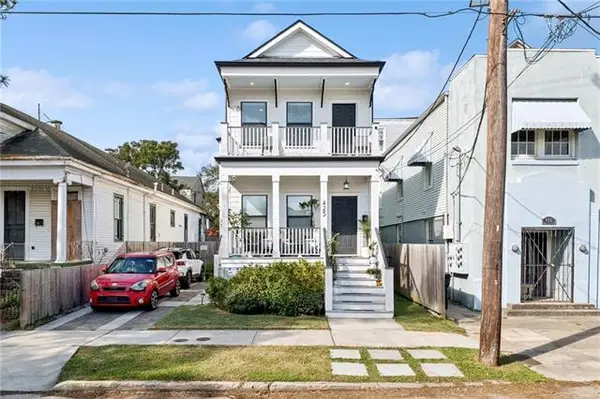 $525,000Pending-- beds -- baths2,197 sq. ft.
425-27 S Lopez Street, New Orleans, LA 70119
MLS# NO2537811Listed by: KELLER WILLIAMS REALTY NEW ORLEANS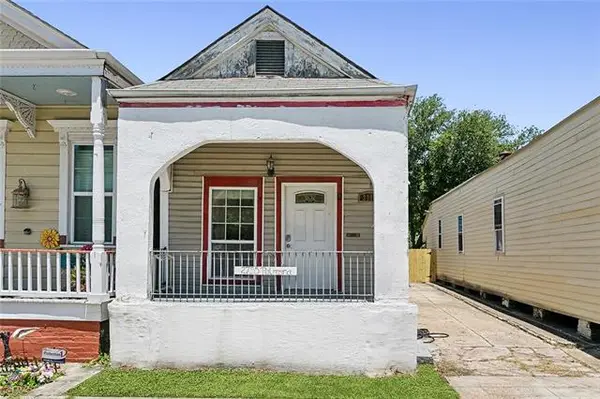 $139,000Active2 beds 2 baths1,305 sq. ft.
2755 Palmyra Street, New Orleans, LA 70119
MLS# NO2543854Listed by: CRESCENT CITY LIVING, LLC $160,000Pending-- beds -- baths1,560 sq. ft.
1710-12 Abundance Street, New Orleans, LA 70119
MLS# NO2542912Listed by: SAINTS CITY REALTY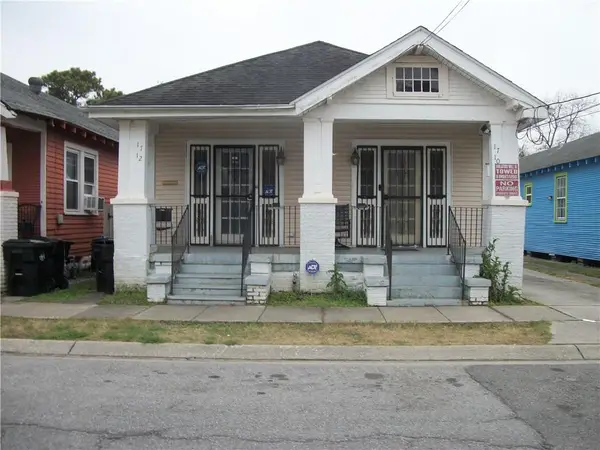 $160,000Pending4 beds 2 baths1,560 sq. ft.
1710 12 Abundance Street, New Orleans, LA 70119
MLS# 2542912Listed by: SAINTS CITY REALTY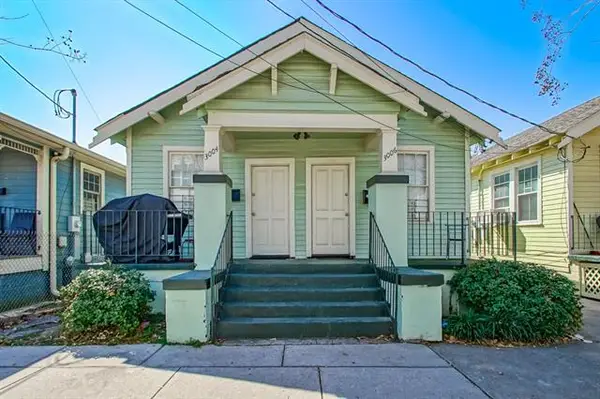 $239,000Pending-- beds -- baths1,297 sq. ft.
3004-06 N Conti Street, New Orleans, LA 70119
MLS# NO2543286Listed by: REALTY ONE GROUP IMMOBILIA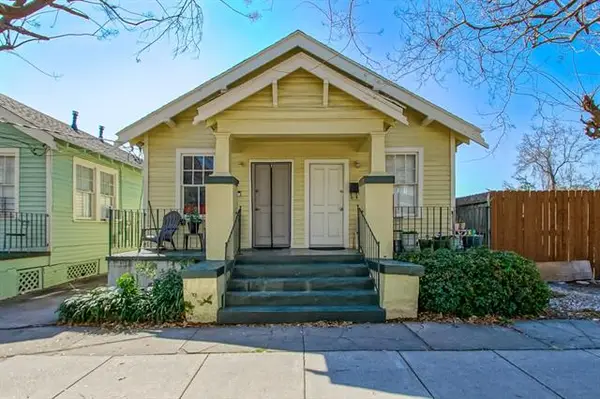 $239,000Active-- beds -- baths1,297 sq. ft.
3008-10 N Conti Street, New Orleans, LA 70119
MLS# NO2543289Listed by: REALTY ONE GROUP IMMOBILIA $239,000Pending2 beds 2 baths1,297 sq. ft.
3004 06 N Conti Street, New Orleans, LA 70119
MLS# 2543286Listed by: REALTY ONE GROUP IMMOBILIA $239,000Active4 beds 2 baths1,297 sq. ft.
3008 10 N Conti Street, New Orleans, LA 70119
MLS# 2543289Listed by: REALTY ONE GROUP IMMOBILIA $289,000Active2 beds 2 baths1,680 sq. ft.
1603 05 Gentilly Boulevard, New Orleans, LA 70119
MLS# 2543214Listed by: VALMONT REALTORS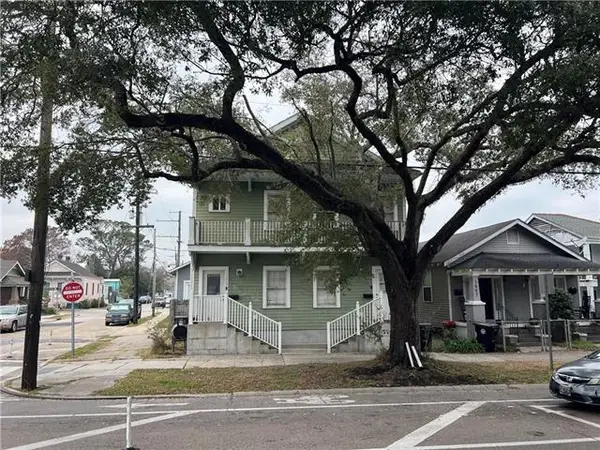 $289,000Active-- beds -- baths1,680 sq. ft.
1603-05 Gentilly Boulevard, New Orleans, LA 70119
MLS# NO2543214Listed by: VALMONT REALTORS $1,399,900Active7 beds 7 baths5,007 sq. ft.
1100 City Park Avenue, New Orleans, LA 70119
MLS# NO2542849Listed by: HISTORIC 504 PROPERTIES $309,900Pending-- beds -- baths1,950 sq. ft.
1707-05 Rousselin Drive, New Orleans, LA 70119
MLS# NO2542073Listed by: ENRG GLOBAL REALTY, LLC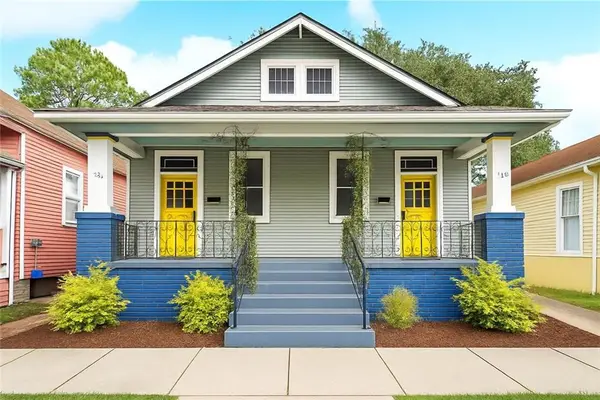 $309,900Active6 beds 2 baths1,950 sq. ft.
1707 05 Rousselin Drive, New Orleans, LA 70119
MLS# 2542073Listed by: ENRG GLOBAL REALTY, LLC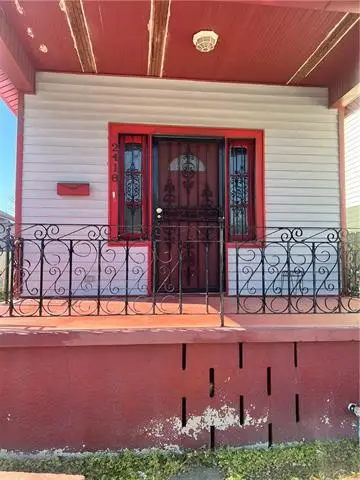 $140,000Active2 beds 1 baths854 sq. ft.
2418 Touro Street, New Orleans, LA 70119
MLS# NO2542536Listed by: WEICHERT, REALTORS - LABRANCH & ASSOCIATES $335,000Active6 beds 2 baths1,974 sq. ft.
4214 16 Ulloa Street, New Orleans, LA 70119
MLS# 2541789Listed by: CEDOR REALTY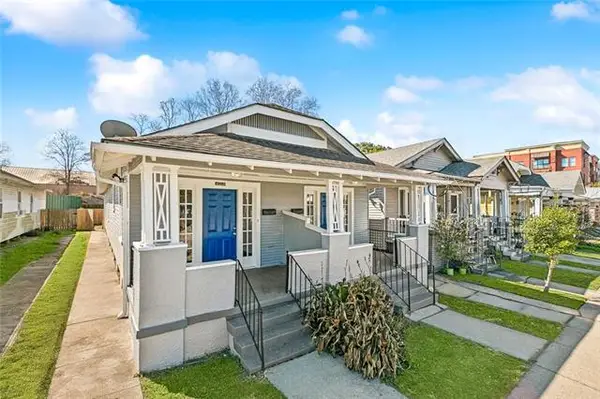 $335,000Active-- beds -- baths1,974 sq. ft.
4214-16 Ulloa Street, New Orleans, LA 70119
MLS# NO2541789Listed by: CEDOR REALTY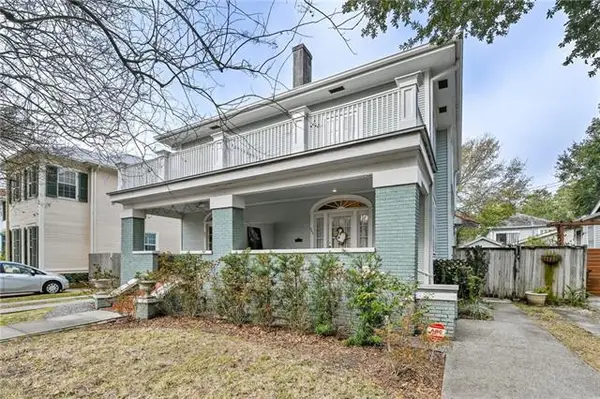 $407,000Active3 beds 2 baths1,437 sq. ft.
943 Wilson Drive #943, New Orleans, LA 70119
MLS# NO2542261Listed by: HOMESMART REALTY SOUTH $159,975Active2 beds 2 baths923 sq. ft.
2444 Aubry Street, New Orleans, LA 70119
MLS# NO2540978Listed by: SHELNUTT REAL ESTATE ENTERPRISES $469,000Active6 beds 6 baths2,462 sq. ft.
736 38 S Genois Street, New Orleans, LA 70119
MLS# 2541829Listed by: CHRISTIAN SHANE PROPERTIES $469,000Active6 beds 6 baths2,430 sq. ft.
622 24 S Pierce Street, New Orleans, LA 70119
MLS# 2541836Listed by: CHRISTIAN SHANE PROPERTIES $469,000Active-- beds -- baths2,430 sq. ft.
622-24 S Pierce Street, New Orleans, LA 70119
MLS# NO2541836Listed by: CHRISTIAN SHANE PROPERTIES $449,000Active6 beds 6 baths2,588 sq. ft.
2304 06 New Orleans Street, New Orleans, LA 70119
MLS# 2541635Listed by: CHRISTIAN SHANE PROPERTIES $760,000Active1 beds 4 baths7,500 sq. ft.
2221 Esplanade Avenue, New Orleans, LA 70119
MLS# NO2541421Listed by: REVOLUTION REALTY $299,999Active5 beds 4 baths2,550 sq. ft.
2604 06 Frenchmen Street, New Orleans, LA 70119
MLS# 2541326Listed by: THE PELLERIN GROUP NOLA LLC $299,999Pending-- beds -- baths2,550 sq. ft.
2604-06 Frenchmen Street, New Orleans, LA 70119
MLS# NO2541326Listed by: THE PELLERIN GROUP NOLA LLC $489,900Active3 beds 2 baths1,820 sq. ft.
2633 Dumaine Street, New Orleans, LA 70119
MLS# NO2541010Listed by: RIVERLANDS REALTY LLC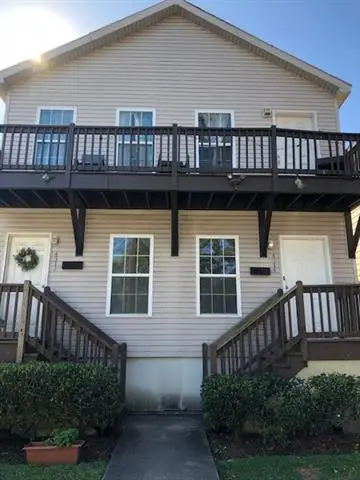 $507,500Active-- beds -- baths2,480 sq. ft.
4312-14 Banks Street, New Orleans, LA 70119
MLS# NO2539840Listed by: KELLER WILLIAMS REALTY NEW ORLEANS $549,000Active5 beds 5 baths2,351 sq. ft.
3809 Ulloa Street, New Orleans, LA 70119
MLS# NO2540850Listed by: KELLER WILLIAMS REALTY 455-0100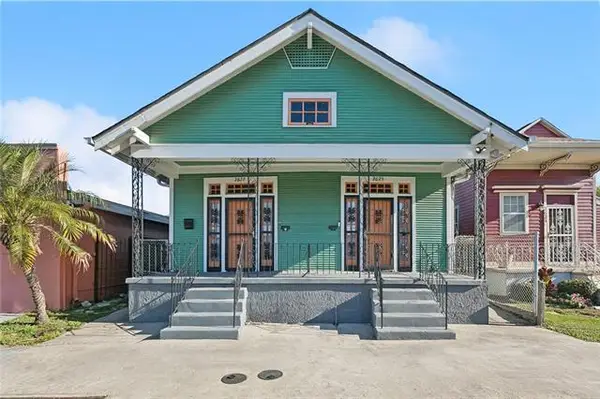 $499,000Active8 beds 4 baths1,725 sq. ft.
2625-27 Orleans Avenue, New Orleans, LA 70119
MLS# NO2541073Listed by: BERKSHIRE HATHAWAY HOMESERVICES PREFERRED, REALTOR $454,900Active2 beds 2 baths1,405 sq. ft.
800 N Rendon Street #206, New Orleans, LA 70119
MLS# 2514748Listed by: TALBOT REALTY GROUP $190,900Active1 beds 1 baths563 sq. ft.
800 N Rendon Street #105, New Orleans, LA 70119
MLS# 2533366Listed by: TALBOT REALTY GROUP $507,500Active6 beds 4 baths2,480 sq. ft.
4312 14 Banks Street, New Orleans, LA 70119
MLS# 2539840Listed by: KELLER WILLIAMS REALTY NEW ORLEANS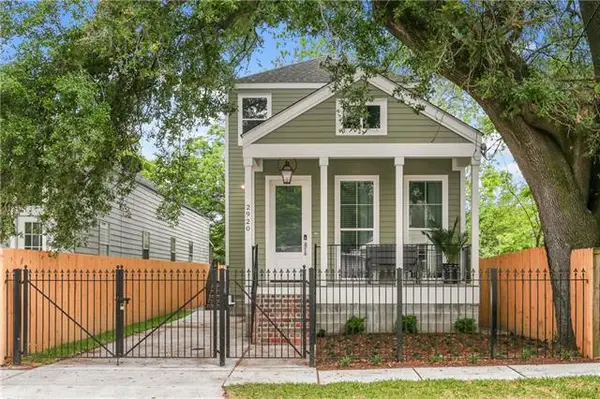 $650,000Active3 beds 3 baths1,706 sq. ft.
2920 Baudin Street, New Orleans, LA 70119
MLS# NO2540015Listed by: LANASA REALTY, INC- $50,000Active0.28 Acres
16717101 Piercest Street, New Orleans, LA 70131
MLS# NO2540750Listed by: COMPASS DESTREHAN (LATT21)  $310,000Active-- beds -- baths2,075 sq. ft.
2215-2217 Dumaine Street, New Orleans, LA 70119
MLS# NO2540190Listed by: UNITED REAL ESTATE PARTNERS LLC $310,000Active-- beds -- baths2,433 sq. ft.
2219-2221 Dumaine Street, New Orleans, LA 70119
MLS# NO2540199Listed by: UNITED REAL ESTATE PARTNERS LLC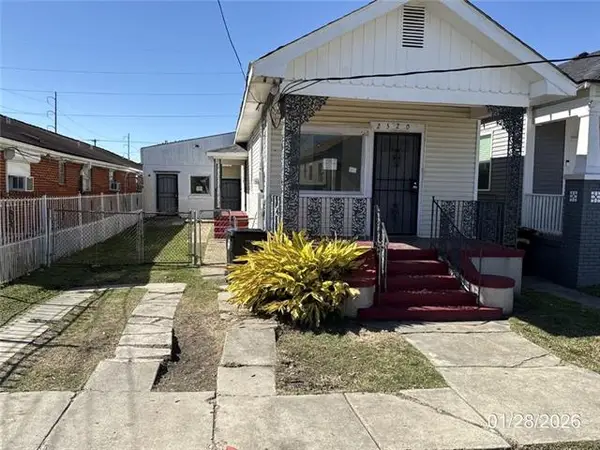 $99,900Active6 beds 2 baths1,700 sq. ft.
2520 Annette Street, New Orleans, LA 70119
MLS# NO2540690Listed by: HOMESMART REALTY SOUTH $649,000Active3 beds 3 baths1,937 sq. ft.
1233 N Robertson Street, New Orleans, LA 70119
MLS# NO2540698Listed by: UNITED REAL ESTATE PARTNERS, LLC $499,000Active5 beds 4 baths2,852 sq. ft.
335 S Murat Street, New Orleans, LA 70119
MLS# 2541357Listed by: COMPASS HISTORIC (LATT09) $965,000Active4 beds 4 baths3,851 sq. ft.
2820 Desoto Street, New Orleans, LA 70119
MLS# NO2495484Listed by: LALLA REAL ESTATE, LLC $985,000Active4 beds 4 baths3,851 sq. ft.
2820 Desoto Street #22, New Orleans, LA 70119
MLS# NO2539222Listed by: LALLA REAL ESTATE, LLC $280,000Active-- beds -- baths1,645 sq. ft.
2920 Gravier Street, New Orleans, LA 70119
MLS# NO2539119Listed by: HUMBLE ABODE REALTORS, LLC $279,900Active1 beds 1 baths899 sq. ft.
800 N Rendon Street #402, New Orleans, LA 70119
MLS# NO2532985Listed by: TALBOT REALTY GROUP $289,900Active1 beds 1 baths966 sq. ft.
800 N Rendon Street #101, New Orleans, LA 70119
MLS# NO2536473Listed by: TALBOT REALTY GROUP $205,000Active1 beds 1 baths611 sq. ft.
3141 Ponce De Leon Street #7, New Orleans, LA 70119
MLS# RANO2506388Listed by: RE/MAX AFFILIATES
Local realty services provided by:CENTURY 21 Action Realty, CENTURY 21 Buelow-Miller Realty
Popular searches near 70119
Popular neighborhoods near 70119
- Bayou St. John, New Orleans homes for sale
- Broadmoor, New Orleans homes for sale
- Burtheville, New Orleans homes for sale
- Central Business District, New Orleans homes for sale
- City Park, New Orleans homes for sale
- Dixon, New Orleans homes for sale
- Fairgrounds, New Orleans homes for sale
- Fountainbleau, New Orleans homes for sale
- French Quarter, New Orleans homes for sale
- Gert Town, New Orleans homes for sale
- Holly Grove, New Orleans homes for sale
- Hurtsville, New Orleans homes for sale
- Lakeview, New Orleans homes for sale
- Lakewood, New Orleans homes for sale
- Mid-City, New Orleans homes for sale
- Navarre, New Orleans homes for sale
- St. Bernard Area, New Orleans homes for sale
- Seventh Ward, New Orleans homes for sale
- Tremé / Lafitte, New Orleans homes for sale
- Tulane, New Orleans homes for sale
Counties near New Orleans, 70119
- Ascension County homes for sale
- Assumption County homes for sale
- East Baton Rouge County homes for sale
- Hancock County homes for sale
- Harrison County homes for sale
- Jefferson County homes for sale
- Lafourche County homes for sale
- Livingston County homes for sale
- Orleans County homes for sale
- Pearl River County homes for sale
- Plaquemines County homes for sale
- St. Bernard County homes for sale
- St. Charles County homes for sale
- St. Helena County homes for sale
- St. James County homes for sale
- St. John the Baptist County homes for sale
- St. Tammany County homes for sale
- Tangipahoa County homes for sale
- Terrebonne County homes for sale
- Washington County homes for sale
Protect your home and budget from life's surprises with an Assurant Home Warranty, backed by a partner that supports you through every step of homeownership. Explore Plans.
©2026 Century 21 Real Estate LLC. All rights reserved. CENTURY 21®, the CENTURY 21 Logo and C21® are service marks owned by Century 21 Real Estate LLC. Century 21 Real Estate LLC fully supports the principles of the Fair Housing Act and the Equal Opportunity Act. Each office is independently owned and operated. Listing information is deemed reliable but not guaranteed accurate.