- Ben Wheeler homes for sale
- Ben Wheeler-Edom homes for sale
- Callender Lake homes for sale
- Canton homes for sale
- Cedar Creek Lake homes for sale
- Cedar Creek Lake homes for sale
- Edgewood homes for sale
- Eustace homes for sale
- Fruitvale homes for sale
- Grand Saline homes for sale
- Gun Barrel City homes for sale
- Kemp homes for sale
- Mabank homes for sale
- Mabank homes for sale
- Murchison homes for sale
- Myrtle Springs homes for sale
- Payne Springs homes for sale
- Terrell South homes for sale
- Van homes for sale
- Wills Point homes for sale
75103, TX - homes for sale
224 of 224 results displayed
- New
 $649,000Active44.41 Acres
2260 Fm 16, Canton, TX 75103
MLS# 21262921Listed by: FRANKLIN REALTY - New
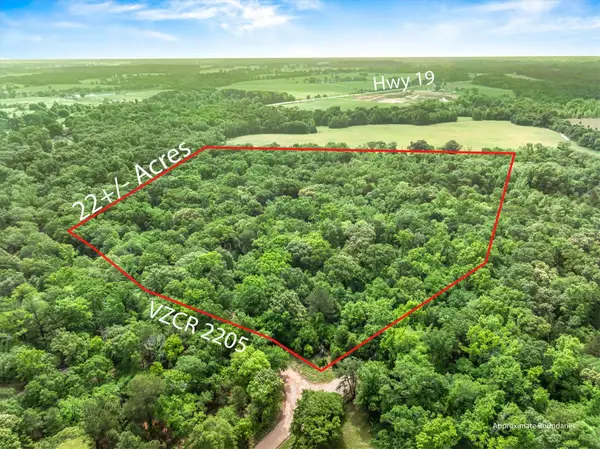 $300,000Active22.32 Acres
TBD Vz County Road 2205, Canton, TX 75103
MLS# 21260687Listed by: RE/MAX LANDMARK ROSE - New
 $385,000Active4 beds 2 baths2,032 sq. ft.
1868 Meadowview, Canton, TX 75103
MLS# 94411515Listed by: EXIT REALTY PRO - New
 $115,000Active5 Acres
TBD Vz County Road 2411, Canton, TX 75103
MLS# 21260196Listed by: RE/MAX LANDMARK ROSE - New
 $350,000Active3 beds 2 baths1,571 sq. ft.
1310 Vz County Road 2135, Canton, TX 75103
MLS# 21259017Listed by: COLDWELL BANKER ANDERSON REALTY - New
 $350,000Active3 beds 2 baths1,571 sq. ft.
350 VZ County Road 2135, Canton, TX 75103
MLS# 26006314Listed by: COLDWELL BANKER ANDERSON REALTORS - New
 $2,750,000Active7 beds 7 baths8,173 sq. ft.
552 Vz County Road 2142, Wills Point, TX 75169
MLS# 21256178Listed by: NORVELL & CO LLC - New
 $350,000Active3 beds 2 baths1,777 sq. ft.
1883 Meadowview, Canton, TX 75103
MLS# 21257542Listed by: PITTS REALTY - New
 $139,000Active8.5 Acres
312 Vz County Road 4114, Canton, TX 75103
MLS# 21257334Listed by: COLDWELL BANKER AMERICAN DREAM - New
 $99,000Active4.3 Acres
261 Vz County Road 4114, Canton, TX 75103
MLS# 21257274Listed by: COLDWELL BANKER AMERICAN DREAM  $315,000Pending2 beds 2 baths2,320 sq. ft.
1136 Vz County Road 2150, Wills Point, TX 75169
MLS# 55773552Listed by: EXP REALTY LLC- New
 $429,000Active3 beds 2 baths1,508 sq. ft.
601 Vz County Road 2512, Canton, TX 75103
MLS# 21253655Listed by: EXIT REALTY PRO - New
 $199,900Active10.01 Acres
0 County Road 4112, Canton, TX 75103
MLS# 21254983Listed by: INC REALTY, LLC - New
 $799,000Active3 beds 3 baths2,534 sq. ft.
323 Vz County Road 2103, Canton, TX 75103
MLS# 21253769Listed by: REAL T TEAM BY EXP - New
 $295,490Active3 beds 2 baths1,412 sq. ft.
148 Willow Branch Lane, Canton, TX 75103
MLS# 21254213Listed by: JEANETTE ANDERSON REAL ESTATE - New
 $308,490Active4 beds 2 baths1,738 sq. ft.
108 Willow Branch Lane, Canton, TX 75103
MLS# 21254294Listed by: JEANETTE ANDERSON REAL ESTATE - New
 $975,000Active3 beds 3 baths2,830 sq. ft.
2489 Fm 2909, Canton, TX 75103
MLS# 112766Listed by: RE/MAX BENCHMARK - New
 $109,990Active1.8 Acres
TBD 1.8 Acres VZ County Road 4105, Canton, TX 75103
MLS# 21252091Listed by: EG REALTY - New
 $299,000Active18.38 Acres
23551 State Highway 19, Canton, TX 75103
MLS# 21251889Listed by: EBBY HALLIDAY, REALTORS - New
 $425,000Active4 beds 2 baths2,200 sq. ft.
2689 Vz County Road 2511, Canton, TX 75103
MLS# 21237812Listed by: PITTS REALTY  $295,000Active7 Acres
1850 Vz County Rd 2502, Canton, TX 75103
MLS# 21249812Listed by: AVERY REALTY GROUP $360,000Active3 beds 2 baths2,249 sq. ft.
464 Vz County Road 2120, Canton, TX 75103
MLS# 21251248Listed by: EXALT REALTY $189,000Active3 beds 2 baths1,503 sq. ft.
661 Sides Circle, Canton, TX 75103
MLS# 21245514Listed by: PIONEER DFW REALTY, LLC $179,900Pending4 beds 2 baths2,040 sq. ft.
410 County Road 2122, Canton, TX 75103
MLS# 21248728Listed by: SEWALT REAL ESTATE $1,099,000Active3 beds 2 baths3,409 sq. ft.
761 Private Road 7005, Edgewood, TX 75117
MLS# 21247788Listed by: WEICHERT REALTORS/PROPERTY PARTNERS $495,000Active5 beds 4 baths3,801 sq. ft.
11571 State Hwy 19, Canton, TX 75103
MLS# 26005728Listed by: RE/MAX LANDMARK $75,000Active0.68 Acres
20132 State Highway 64, Canton, TX 75103
MLS# 21235678Listed by: EXIT REALTY PRO $525,000Active30.3 Acres
TBD Vz County Road 2317 30 Acres, Canton, TX 75103
MLS# 21247685Listed by: RE/MAX LANDMARK EDGEWOOD $190,000Active3 beds 2 baths1,666 sq. ft.
1354 Shady Lane, Canton, TX 75103
MLS# 21245816Listed by: RE/MAX LANDMARK ROSE $150,000Active5 Acres
14612 Fm 858, Athens, TX 75752
MLS# 21245821Listed by: RE/MAX LANDMARK ROSE $215,000Active3 beds 3 baths1,516 sq. ft.
301 Vz County 1320 Road, Canton, TX 75103
MLS# 21245298Listed by: ONLY 1 REALTY GROUP NORTH DALLAS $525,000Active3 beds 2 baths2,632 sq. ft.
584 VZ County Road 4125, Canton, TX 75103
MLS# 26005572Listed by: FATHOM REALTY, LLC $120,000Active1.5 Acres
1.5 acres TBD Lot 31 Lakeview Drive, Canton, TX 75103
MLS# 21216194Listed by: RE/MAX LANDMARK ROSE $2,749,000Active5 beds 5 baths5,600 sq. ft.
1036 Private Road 8905, Canton, TX 75103
MLS# 21241677Listed by: MYERS JACKSON $179,999Active4 beds 2 baths1,344 sq. ft.
528 Vz County Road 1308, Canton, TX 75103
MLS# 21242690Listed by: PIONEER DFW REALTY, LLC $225,000Active2 beds 1 baths
721 Water Crest Circle, Canton, TX 75103
MLS# 66599120Listed by: EXIT REALTY PRO $290,000Active2 beds 1 baths1,000 sq. ft.
12930 Fm 1651, Canton, TX 75103
MLS# 21237408Listed by: MARTIN REALTY GROUP $399,000Pending3 beds 2 baths1,619 sq. ft.
2730 FM 16, Canton, TX 75103
MLS# 26005384Listed by: CENTURY 21 FIRST GROUP - LINDALE $325,000Active2 beds 1 baths792 sq. ft.
951 S Trade Days Boulevard, Canton, TX 75103
MLS# 21238368Listed by: COMPASS RE TEXAS, LLC
 $1,095,000Active4 beds 3 baths3,300 sq. ft.
6969 State Hwy 198, Canton, TX 75103
MLS# 21238961Listed by: CENTURY 21 FIRST GROUP $187,000Active11 Acres
TBD LOT A Vz County Road 2302 #A, Canton, TX 75103
MLS# 21209790Listed by: PITTS REALTY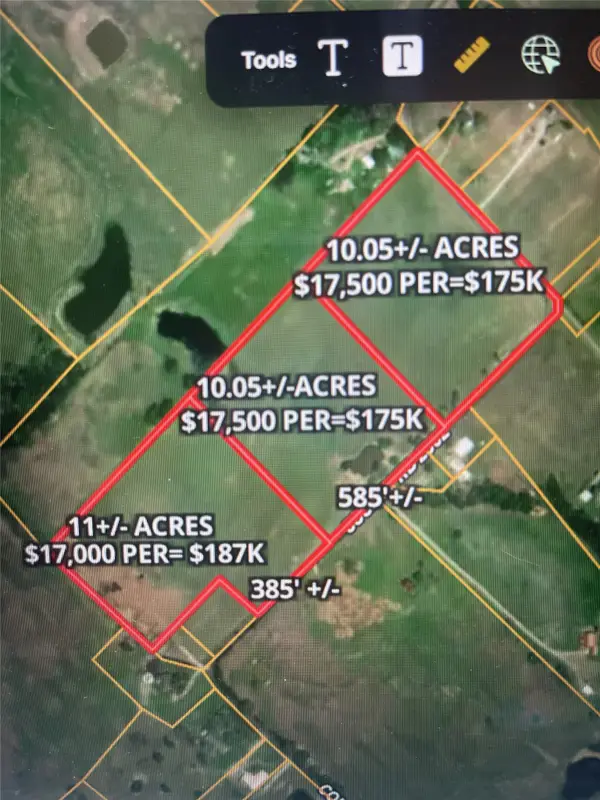 $175,000Active10.05 Acres
TBD LOT B Vz County Road 2302 #B, Canton, TX 75103
MLS# 21209839Listed by: PITTS REALTY $175,000Active10.05 Acres
TBD LOT C Vz County Road 2302 #C, Canton, TX 75103
MLS# 21210006Listed by: PITTS REALTY $1,071,000Active30.6 Acres
TBD Vzcr 2120, Canton, TX 75103
MLS# 21238530Listed by: CENTURY 21 JUDGE FITE CO. $3,750,000Active4 beds 7 baths8,355 sq. ft.
535 Private Road 6404, Canton, TX 75103
MLS# 21236524Listed by: COMPASS RE TEXAS, LLC. $199,900Active4 beds 3 baths1,712 sq. ft.
140 Vz County Road 2153, Canton, TX 75103
MLS# 21225530Listed by: DIAMOND CUT REAL ESTATE $239,000Active4 beds 2 baths1,383 sq. ft.
22330 State Highway 64, Canton, TX 75103
MLS# 21230845Listed by: JPAR - ROCKWALL $529,900Pending3 beds 2 baths2,385 sq. ft.
200 Vz County Road 4124, Canton, TX 75103
MLS# 21233165Listed by: RE/MAX DFW ASSOCIATES IV $205,000Active2 beds 1 baths644 sq. ft.
671 Vz County Road 2503, Canton, TX 75103
MLS# 21234563Listed by: COLDWELL BANKER APEX, REALTORS $265,000Active3 beds 2 baths1,508 sq. ft.
621 Athens, Canton, TX 75103
MLS# 21235336Listed by: COLDWELL BANKER APEX, REALTORS $998,000Active2 beds 2 baths2,108 sq. ft.
1421 Vz County Road 2319, Canton, TX 75103
MLS# 21233217Listed by: DEEN PROPERTY GROUP $485,000Active25.17 Acres
1750 County Rd 2101, Canton, TX 75103
MLS# 21230675Listed by: BRIGGS FREEMAN SOTHEBY'S INT'L $299,900Active3 beds 3 baths2,288 sq. ft.
111 Granada Square, Canton, TX 75103
MLS# 21232796Listed by: EXIT REALTY PRO $212,000Active3 beds 2 baths1,761 sq. ft.
1460 Forrest Drive, Canton, TX 75103
MLS# 21232478Listed by: RE/MAX LANDMARK ROSE $315,490Active5 beds 3 baths2,492 sq. ft.
107 Hunters Way, Canton, TX 75103
MLS# 21231161Listed by: JEANETTE ANDERSON REAL ESTATE $650,000Active4 beds 3 baths2,408 sq. ft.
167 Vz County Road 4202, Canton, TX 75103
MLS# 21223940Listed by: RE/MAX LANDMARK ROSE $325,000Pending3 beds 2 baths1,828 sq. ft.
20625 State Highway 19, Canton, TX 75103
MLS# 21227778Listed by: RE/MAX LANDMARK ROSE $450,000Active3 beds 2 baths2,416 sq. ft.
18541 FM 17, Canton, TX 75103
MLS# 26004661Listed by: RE/MAX LANDMARK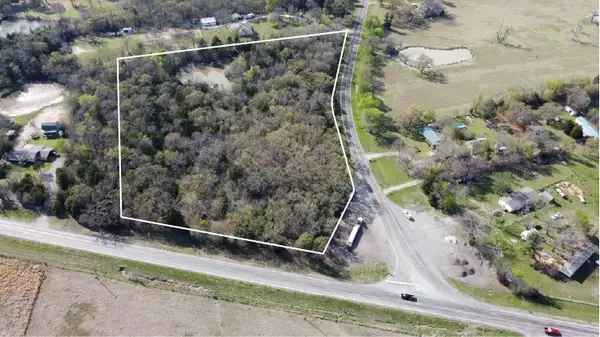 $260,000Active9.73 Acres
TBD Hwy 198, Canton, TX 75103
MLS# 21227375Listed by: TRINITY COUNTRY REAL ESTATE $287,500Pending4 beds 2 baths1,934 sq. ft.
148 Granada Sq, Canton, TX 75103
MLS# 112529Listed by: EXIT REALTY PRO $1,200,000Active4 beds 4 baths3,816 sq. ft.
14740 Fm 1255, Canton, TX 75103
MLS# 21224204Listed by: COLDWELL BANKER ANDERSON REALTY $619,900Active3 beds 4 baths2,600 sq. ft.
800 Vz County Road 2112, Canton, TX 75103
MLS# 21225015Listed by: RE/MAX LANDMARK EDGEWOOD $485,000Active4 beds 2 baths2,561 sq. ft.
4320 State Hwy 198, Canton, TX 75103
MLS# 21223469Listed by: 37:4 PROPERTY COMPANY $300,000Active3 beds 2 baths2,081 sq. ft.
3121 VZ CR 1215, Grand Saline, TX 75140
MLS# 26004498Listed by: MILLER HOMES GROUP $450,000Active3 beds 2 baths2,081 sq. ft.
3121 VZ County Road 1215, Grand Saline, TX 75140
MLS# 26004489Listed by: MILLER HOMES GROUP $360,000Active3 beds 3 baths2,614 sq. ft.
114 Granada Square, Canton, TX 75103
MLS# 21222501Listed by: COLDWELL BANKER ANDERSON REALTY $921,000Active66 Acres
66.00 (+/-) Acres Vz County Road 2145, Canton, TX 75103
MLS# 21134662Listed by: EXIT REALTY PRO $287,800Active16.39 Acres
3012 VZ County Road 2403, Canton, TX 75103
MLS# 26004422Listed by: WEATHEREAD JOHNSON REALTY LLC $440,000Active3 beds 3 baths2,368 sq. ft.
271 VZ County Road 4107, Canton, TX 75103
MLS# 26004415Listed by: RE/MAX LANDMARK $925,000Active4 beds 3 baths2,834 sq. ft.
800 VZ County Road 2135, Canton, TX 75103
MLS# 26004419Listed by: MILLER HOMES GROUP $298,990Pending4 beds 3 baths2,164 sq. ft.
131 Dry Creek Lane, Canton, TX 75103
MLS# 21221046Listed by: JEANETTE ANDERSON REAL ESTATE $467,376Active3 beds 3 baths1,898 sq. ft.
150 Vz County Rd 2118, Canton, TX 75103
MLS# 21219049Listed by: CALL IT CLOSED REALTY $500Active11.75 Acres
0 Tx-19 S, Canton, TX 75103
MLS# 21217482Listed by: M&D CRE, LLC $675,000Active3 beds 3 baths3,038 sq. ft.
1800 Vz County Road 1207, Canton, TX 75103
MLS# 21215637Listed by: RE/MAX LANDMARK ROSE $189,000Active3 beds 2 baths1,140 sq. ft.
700 S Live Oak Street, Canton, TX 75103
MLS# 21214510Listed by: FRANKLIN REALTY $325,000Active3 beds 3 baths3,000 sq. ft.
1307 Big Rock Street, Canton, TX 75103
MLS# 21215316Listed by: RE/MAX LANDMARK ROSE $450,000Active3 beds 2 baths2,416 sq. ft.
18541 Fm 17, Canton, TX 75103
MLS# 21206558Listed by: RE/MAX LANDMARK ROSE $921,000Active66 Acres
66.00 (+/-) Acres Vz County Road 2145, Canton, TX 75103
MLS# 36638733Listed by: EXIT REALTY PRO $879,900Active5 beds 3 baths3,008 sq. ft.
366 Private Road 7005, Edgewood, TX 75117
MLS# 21211573Listed by: WEICHERT REALTORS/PROPERTY PARTNERS $395,000Active2 beds 2 baths1,200 sq. ft.
1744 Vz County Road 2303, Canton, TX 75103
MLS# 21214405Listed by: EXIT REALTY PRO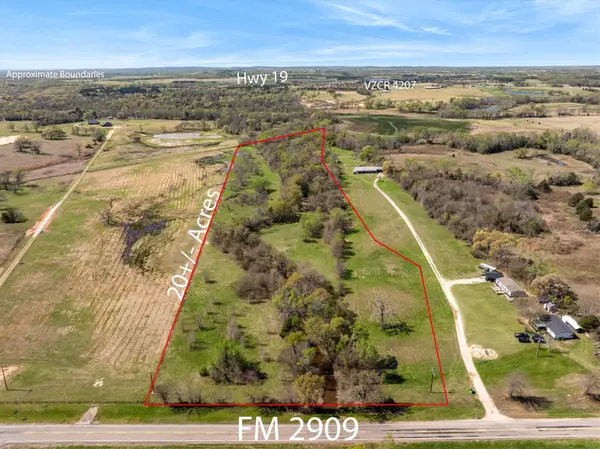 $300,000Active20 Acres
000 Fm 2909, Canton, TX 75103
MLS# 21209960Listed by: RE/MAX LANDMARK ROSE $585,000Active3 beds 2 baths2,418 sq. ft.
800 Vz County Road 4105, Canton, TX 75103
MLS# 21212899Listed by: EXIT REALTY PRO $525,000Active3 beds 3 baths2,950 sq. ft.
2146 Vz County Road 2205, Canton, TX 75103
MLS# 21196797Listed by: CENTURY 21 FIRST GROUP $414,500Active4 beds 2 baths1,884 sq. ft.
178 Private Road 8642, Canton, TX 75103
MLS# 21212379Listed by: LOCAL PRO REALTY LLC $269,000Active16 Acres
TBD Vz County Road 2309, Canton, TX 75103
MLS# 21209189Listed by: CHRISTIE'S LONE STAR $875,000Active6 beds 3 baths4,203 sq. ft.
1211 Vz County Rd 4418 Road, Canton, TX 75103
MLS# 21203774Listed by: KAROLA REALTY $299,000Active3 beds 2 baths1,581 sq. ft.
700 Amy Street, Canton, TX 75103
MLS# 21203449Listed by: EXIT REALTY PRO $410,000Active4 beds 2 baths1,815 sq. ft.
2280 Vz County Road 2501, Canton, TX 75103
MLS# 21202592Listed by: LESLIE CAIN REALTY $99,000Active2.66 Acres
00A Vzcr 3608, Canton, TX 75103
MLS# 21200845Listed by: KW-CEDAR CREEK LAKE PROPERTIES $414,000Active3 beds 2 baths2,098 sq. ft.
112 Lake Meadow, Canton, TX 75103
MLS# 21200900Listed by: COLDWELL BANKER ANDERSON REALTY $740,000Active3 beds 4 baths3,372 sq. ft.
669 Van Zandt County Road 2316, Canton, TX 75103
MLS# 26003196Listed by: RE/MAX LANDMARK $239,000Active4 beds 2 baths2,128 sq. ft.
289 Vzcr 3122, Canton, TX 75103
MLS# 112450Listed by: KELLER WILLIAMS REALTY - CEDAR CREEK LAKE PROPERTIES $239,000Active4 beds 2 baths2,128 sq. ft.
289 Vz County Road 3122, Edgewood, TX 75117
MLS# 21194966Listed by: KW-CEDAR CREEK LAKE PROPERTIES $439,990Active4 beds 4 baths2,445 sq. ft.
179 Norman, Canton, TX 75103
MLS# 20261546Listed by: EXIT REALTY PRO $325,000Active3 beds 2 baths1,689 sq. ft.
24289 State Highway 19, Canton, TX 75103
MLS# 21195796Listed by: PIONEER DFW REALTY, LLC $225,000Pending4 beds 2 baths2,300 sq. ft.
24291 State Highway 19, Canton, TX 75103
MLS# 21195813Listed by: PIONEER DFW REALTY, LLC $750,000Active4 beds 3 baths2,568 sq. ft.
10227 State Highway 198, Canton, TX 75103
MLS# 21194385Listed by: MALONE AND ASSOCIATES RE $287,800Active16.39 Acres
3012 Van Zandt County Road 2403, Canton, TX 75103
MLS# 21198341Listed by: WEATHEREAD JOHNSON REALTY LLC $439,990Pending4 beds 4 baths2,445 sq. ft.
179 Norman Dr., Canton, TX 75103
MLS# 112412Listed by: EXIT REALTY PRO $559,900Active4 beds 3 baths2,688 sq. ft.
360 Dalton Road, Canton, TX 75103
MLS# 21192271Listed by: REAL BROKER, LLC $219,000Active3 beds 2 baths1,367 sq. ft.
1760 Lazy U Drive, Canton, TX 75103
MLS# 21188113Listed by: PITTS REALTY $293,490Active3 beds 2 baths1,412 sq. ft.
539 Burnett Trail, Canton, TX 75103
MLS# 26002772Listed by: JEANETTE ANDERSON REAL ESTATE $553,000Active3 beds 2 baths2,725 sq. ft.
3255 Vz County Road 2120, Canton, TX 75103
MLS# 21188930Listed by: RE/MAX FOUR CORNERS $899,999Active2 beds 2 baths1,645 sq. ft.
459 Vz County Road 2141, Canton, TX 75103
MLS# 21187038Listed by: RE/MAX FOUR CORNERS $999,500Active42.24 Acres
TBD County Road 2141, Canton, TX 75103
MLS# 21188802Listed by: RE/MAX FOUR CORNERS $539,000Active4 beds 5 baths4,216 sq. ft.
18919 State Hwy 64, Canton, TX 75103
MLS# 26002625Listed by: FATHOM REALTY, LLC $279,000Active5 beds 3 baths3,600 sq. ft.
17624 Fm 1255, Canton, TX 75103
MLS# 21188501Listed by: PROVIDENCE REAL ESTATE $65,000Active0.26 Acres
TBD Shady Ln, Canton, TX 75103
MLS# 21188278Listed by: PROMISE REALTY $65,000Active0.27 Acres
1353 Shady Lane, Canton, TX 75103
MLS# 21188336Listed by: PROMISE REALTY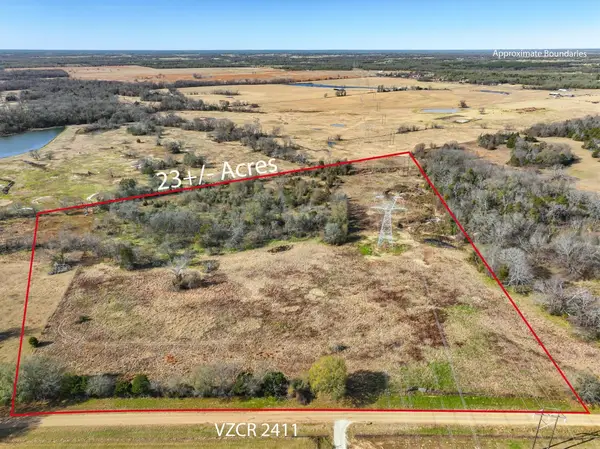 $299,000Active23.94 Acres
000 Vz County Road 2411, Canton, TX 75103
MLS# 21168032Listed by: RE/MAX LANDMARK ROSE $740,000Active3 beds 4 baths3,372 sq. ft.
669 Vz County Road 2316, Canton, TX 75103
MLS# 21169876Listed by: RE/MAX LANDMARK ROSE $214,500Active13 Acres
TBD Vz County Road 2317 Tract 3, Canton, TX 75103
MLS# 21183389Listed by: RE/MAX LANDMARK EDGEWOOD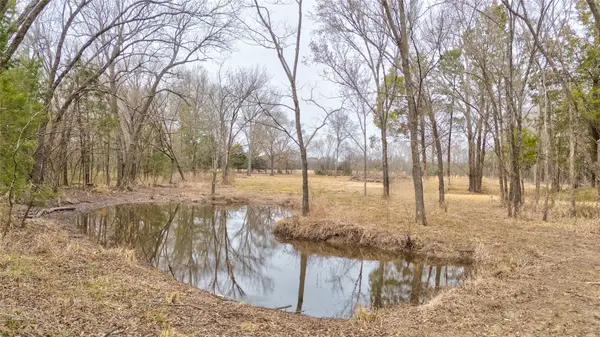 $284,000Active18.69 Acres
1411 Van Zandt County Road 2139, Wills Point, TX 75103
MLS# 21182083Listed by: FLEX GROUP REAL ESTATE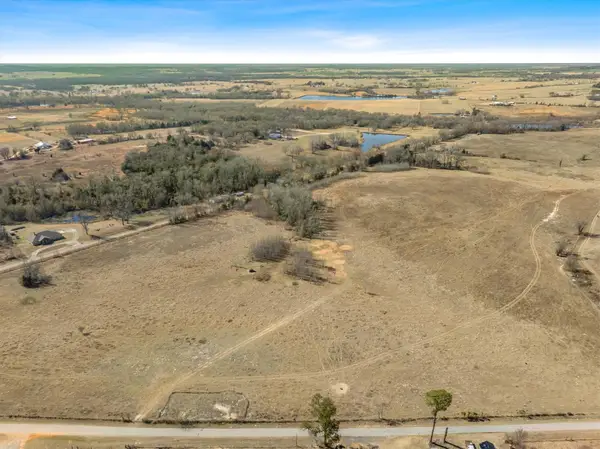 $176,750Active10.1 Acres
TBD Vz County Road 2317 Tract 6, Canton, TX 75103
MLS# 21182007Listed by: RE/MAX LANDMARK EDGEWOOD $299,500Active2 beds 1 baths1,250 sq. ft.
810 Vz County Road 2305, Canton, TX 75103
MLS# 21181268Listed by: EXIT REALTY PRO $189,000Active3 beds 1 baths1,584 sq. ft.
1016 Tower Street, Canton, TX 75103
MLS# 21174866Listed by: OAK & STONE REALTY ADVISORS $375,000Pending2 beds 2 baths1,232 sq. ft.
959 VZ County Road 2209, Canton, TX 75103
MLS# 26002089Listed by: RE/MAX LANDMARK $375,000Active2 beds 2 baths1,232 sq. ft.
959 Vz County Road 2209, Canton, TX 75103
MLS# 21178824Listed by: RE/MAX LANDMARK ROSE $445,000Pending3 beds 2 baths1,775 sq. ft.
2468 Vz County Road 2511 Road, Canton, TX 75103
MLS# 21178628Listed by: ULTIMA REAL ESTATE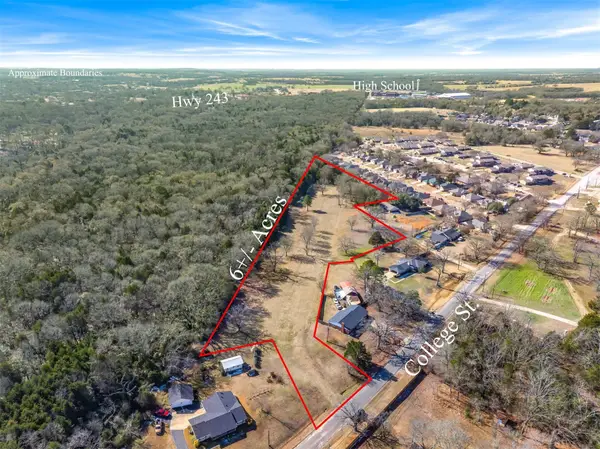 $260,000Active6.28 Acres
TBD E College Street, Canton, TX 75103
MLS# 21173617Listed by: PITTS REALTY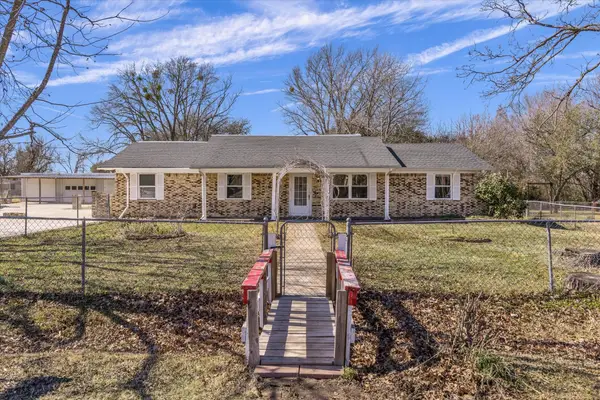 $410,000Active7 beds 3 baths3,952 sq. ft.
1729 Elliot Drive, Canton, TX 75103
MLS# 21178315Listed by: RE/MAX LANDMARK ROSE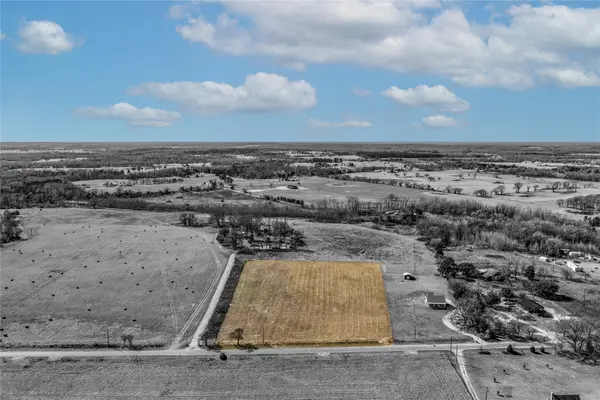 $150,000Active5 Acres
1170 County Road 4106, Canton, TX 75103
MLS# 21173404Listed by: M&D REAL ESTATE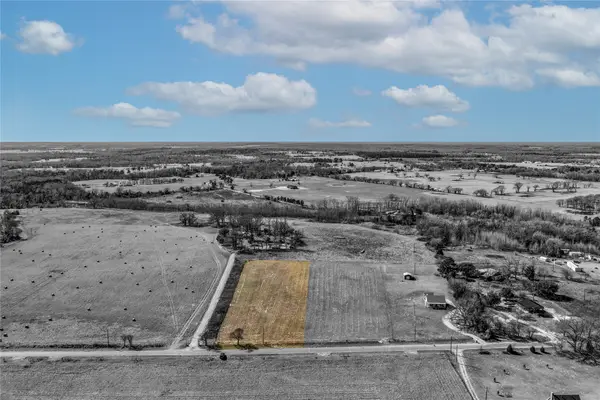 $80,000Active2.5 Acres
0 County Road 4106 #A, Canton, TX 75103
MLS# 21173418Listed by: M&D REAL ESTATE $80,000Active2.5 Acres
0 County Road 4106 #B, Canton, TX 75103
MLS# 21173443Listed by: M&D REAL ESTATE $1,125,800Active86.6 Acres
2852 W 243 Highway W, Canton, TX 75103
MLS# 21176658Listed by: PROVIDENCE REAL ESTATE $300,000Active4 beds 2 baths2,105 sq. ft.
342 Vz County Road 2101, Canton, TX 75103
MLS# 21173917Listed by: PITTS REALTY $229,900Active13.02 Acres
Tract 2 Fm 3227, Canton, TX 75103
MLS# 21175085Listed by: EXIT REALTY PRO $239,000Active4 beds 2 baths1,738 sq. ft.
550 Burnett Trail, Canton, TX 75103
MLS# 21168987Listed by: LOCAL PRO REALTY LLC $439,993Active4 beds 3 baths2,472 sq. ft.
121 Doris Drive, Canton, TX 75103
MLS# 21172735Listed by: HOMESUSA.COM $190,000Active3 beds 2 baths1,832 sq. ft.
6305 W State Highway 243, Canton, TX 75103
MLS# 21149829Listed by: STORYBOOK REALTY LLC $264,990Active3 beds 2 baths1,294 sq. ft.
519 Burnett Trail, Canton, TX 75103
MLS# 26001670Listed by: JEANETTE ANDERSON REAL ESTATE $199,000Pending7.9 Acres
TBD Fm 2909 Trct 8, Canton, TX 75103
MLS# 21147718Listed by: LUGARY, LLC $175,000Active5.56 Acres
12667 Fm 1255, Canton, TX 75103
MLS# 21169976Listed by: EXIT REALTY PRO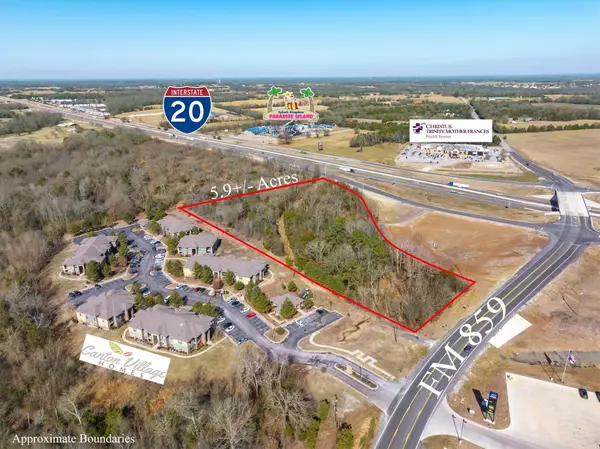 $1,300,000Active5.9 Acres
TBD I-20, Canton, TX 75103
MLS# 21165063Listed by: EBBY HALLIDAY, REALTORS $799,000Active3 beds 2 baths2,564 sq. ft.
2300 Vz County Road 2504, Canton, TX 75103
MLS# 21164149Listed by: MY CASTLE REALTY $1,095,000Active3 beds 1 baths1,896 sq. ft.
5518 State Highway 198, Canton, TX 75103
MLS# 21159549Listed by: EXP REALTY LLC $284,900Active13.83 Acres
TBD VZ County Road 1516, Van, TX 75790
MLS# 26001245Listed by: MILLER HOMES GROUP $153,000Active3 beds 2 baths1,244 sq. ft.
160 Vz County Road 4130, Canton, TX 75103
MLS# 21162781Listed by: EXIT REALTY PRO $130,000Pending3 beds 2 baths1,568 sq. ft.
842 Vz County Road #4414, Canton, TX 75103
MLS# 21162966Listed by: EXP REALTY $1,500,000Active41.85 Acres
41.85 Acres State Highway 64, Canton, TX 75103
MLS# 21161398Listed by: MILLER HOMES GROUP $109,000Pending3.46 Acres
TBD Fm 859, Canton, TX 75103
MLS# 21154652Listed by: EXIT REALTY PRO $450,000Active30 Acres
30 (+/-) Acres Vz County Road 2145, Canton, TX 75103
MLS# 902806Listed by: EXIT REALTY PRO $885,000Pending3 beds 5 baths3,498 sq. ft.
612 Private Road 7005, Edgewood, TX 75117
MLS# 21158354Listed by: WEICHERT REALTORS/PROPERTY PARTNERS $899,900Active3 beds 3 baths2,100 sq. ft.
8640 State Highway 198, Canton, TX 75103
MLS# 21159578Listed by: EBBY HALLIDAY REALTORS $1,081,959Pending3 beds 2 baths1,320 sq. ft.
1133 Vz County Road 2413, Canton, TX 75103
MLS# 21153731Listed by: COLDWELL BANKER APEX, REALTORS $515,000Active4 beds 4 baths2,792 sq. ft.
1807 Mill Creek Road, Canton, TX 75103
MLS# 21154721Listed by: RE/MAX LANDMARK ROSE $168,000Active3 beds 2 baths1,178 sq. ft.
229 Bois D Arc Street, Canton, TX 75103
MLS# 21152880Listed by: CENTURY 21 JUDGE FITE CO. $975,000Active4 beds 3 baths2,624 sq. ft.
370 Vz County Road 4134, Canton, TX 75103
MLS# 21128574Listed by: PITTS REALTY $239,999Active3 beds 2 baths1,836 sq. ft.
334 River Oaks Lane, Canton, TX 75103
MLS# 21151134Listed by: PIPER CREEK REALTY LLC $405,000Active3 beds 2 baths1,920 sq. ft.
1825 Meadowview, Canton, TX 75103
MLS# 21141876Listed by: DEEN PROPERTY GROUP $199,900Active4 beds 3 baths1,036 sq. ft.
1200/1190 Big Rock Street, Canton, TX 75103
MLS# 21132584Listed by: PITTS REALTY $225,000Active9.87 Acres
TBD Lazy U Drive, Canton, TX 75103
MLS# 21134725Listed by: EXIT REALTY PRO $494,900Active4 beds 2 baths1,763 sq. ft.
149 Vz Cr 3121, Edgewood, TX 75117
MLS# 21130524Listed by: RAGLIN REAL ESTATE, LLC $439,000Active3 beds 2 baths1,738 sq. ft.
460 VZ County Road 2402, Canton, TX 75103
MLS# 25017524Listed by: EXIT REALTY PRO $230,000Active3 beds 2 baths1,441 sq. ft.
377 Nichols Drive, Canton, TX 75103
MLS# 21125404Listed by: RE/MAX LANDMARK ROSE $68,460Active3.26 Acres
TBD Lot 1 Vz County Road 4134, Canton, TX 75103
MLS# 21121070Listed by: EXIT REALTY PRO $82,320Active3.92 Acres
TBD Lot 2 Vz County Road 4134, Canton, TX 75103
MLS# 21121085Listed by: EXIT REALTY PRO $129,000Active5 Acres
1064 Vz Co Rd 2413, Canton, TX 75103
MLS# 21114810Listed by: MALONE AND ASSOCIATES RE $199,500Active10.59 Acres
00 Fm 1651, Canton, TX 75103
MLS# 21111593Listed by: EXIT REALTY PRO $795,000Active5 beds 4 baths2,640 sq. ft.
454 Vz County Road 2206, Canton, TX 75103
MLS# 21108334Listed by: RE/MAX LANDMARK ROSE $55,000Active4.61 Acres
TBD Vz County Road 2912, Canton, TX 75147
MLS# 21101242Listed by: BEARY NICE HOMES $90,000Active7.32 Acres
TBD Fm 1256, Canton, TX 75147
MLS# 21101249Listed by: BEARY NICE HOMES $155,000Pending3 beds 2 baths1,407 sq. ft.
1004 Pecan Street, Canton, TX 75103
MLS# 21093026Listed by: CENTURY 21 HARVEY PROPERTIES
 $1,265,000Active5 beds 3 baths3,904 sq. ft.
1210 Vz County Road 2316, Canton, TX 75103
MLS# 21096048Listed by: CENTURY 21 HARVEY PROPERTIES-P $277,900Active4 beds 3 baths1,983 sq. ft.
393 Vz County Road #4125, Canton, TX 75103
MLS# 21093699Listed by: EXP REALTY $269,900Active4 beds 3 baths1,983 sq. ft.
393 VZ County Rd 4125, Canton, TX 75103
MLS# 25015592Listed by: EXP REALTY, LLC-AUSTIN $525,000Active3 beds 2 baths2,069 sq. ft.
510 Vz County Road 2517, Canton, TX 75103
MLS# 21088123Listed by: DHS REALTY $398,900Active4 beds 3 baths3,080 sq. ft.
4469 Etheridge Circle, Canton, TX 75103
MLS# 25014642Listed by: LESLIE CAIN REALTY, LLC $425,800Active10.14 Acres
TBD Vz County Road 2102, Canton, TX 75103
MLS# 21070016Listed by: DEEN PROPERTY GROUP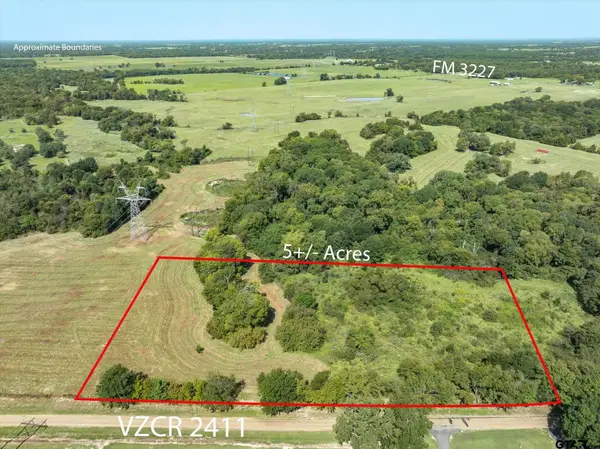 $115,000Active5 Acres
TBD VZ County Road 2411, Canton, TX 75103
MLS# 25014163Listed by: RE/MAX LANDMARK $79,000Active1 Acres
TBD Cr 3121, Canton, TX 75103
MLS# 21060315Listed by: SCREEN DOOR REALTY $799,000Active3 beds 2 baths2,545 sq. ft.
893 Vz County Road 4203, Canton, TX 75103
MLS# 21058308Listed by: RE/MAX LANDMARK ROSE $169,000Active1.2 Acres
TBD Hwy 19, Canton, TX 75103
MLS# 21058535Listed by: SCREEN DOOR REALTY $304,900Active3 beds 2 baths1,984 sq. ft.
401 VZ County Road 2429, Canton, TX 75103
MLS# 25013580Listed by: MOVE HERE REALTY $323,990Active4 beds 3 baths2,164 sq. ft.
158 Willow Branch Lane, Canton, TX 75103
MLS# 25013276Listed by: JEANETTE ANDERSON REAL ESTATE $799,900Active51.39 Acres
0000 Vz County Road 2212, Canton, TX 75103
MLS# 21046940Listed by: EBBY HALLIDAY REALTORS $159,900Pending3 beds 2 baths1,213 sq. ft.
281 VZ County Road 2511, Canton, TX 75103
MLS# 21042736Listed by: EXIT REALTY PRO $555,000Active4 beds 2 baths2,432 sq. ft.
793 Vzcr 2312, Mabank, TX 75147
MLS# 109578Listed by: KELLER WILLIAMS REALTY - ATHENS $555,000Active6 beds 3 baths2,432 sq. ft.
2994 Vz County Road 2313, Canton, TX 75103
MLS# 21045142Listed by: KELLER WILLIAMS REALTY ATHENS $89,999Active3.13 Acres
0000 Fm 2909 & Pr 8905, Canton, TX 75103
MLS# 21043319Listed by: EXIT REALTY PRO $570,000Active3 beds 2 baths2,108 sq. ft.
446 Vz County Road 4108, Canton, TX 75103
MLS# 21168665Listed by: ULTIMA REAL ESTATE $67,900Pending2.03 Acres
TBD Fm 1255, Canton, TX 75103
MLS# 21040172Listed by: EXIT REALTY PRO $175,000Pending2 beds 2 baths973 sq. ft.
1440 Vzcr 2410, Canton, TX 75103
MLS# 109556Listed by: SEWALT REAL ESTATE $660,000Active30.09 Acres
TBD Fm-1651, Canton, TX 75103
MLS# 21039010Listed by: DEEN PROPERTY GROUP $325,000Active19.91 Acres
13488 State Hwy 19, Canton, TX 75103
MLS# 21028471Listed by: CENTURY 21 FIRST GROUP $399,000Active3 beds 2 baths1,881 sq. ft.
473 Vz County Road 2434, Canton, TX 75103
MLS# 20985563Listed by: EBBY HALLIDAY, REALTORS $219,000Active3 beds 2 baths1,169 sq. ft.
230 Dodson Street, Canton, TX 75103
MLS# 21016404Listed by: EXIT REALTY PRO $435,000Active30 Acres
000 County Road 4106, Canton, TX 75103
MLS# 21014489Listed by: EXIT REALTY PRO $577,000Active4 beds 4 baths2,407 sq. ft.
408 County Road 2115, Canton, TX 75103
MLS# 21014226Listed by: EXIT REALTY PRO $700Active0.25 Acres
14474 I-20, Canton, TX 75103
MLS# 21012876Listed by: EXIT REALTY PRO $800,000Active50.03 Acres
1032B Vz County Road 2309, Canton, TX 75103
MLS# 21009590Listed by: CHRISTIE'S LONE STAR $95,000Active0.56 Acres
1106 Woodland Drive, Canton, TX 75103
MLS# 21000323Listed by: EBBY HALLIDAY, REALTORS $465,000Active2 beds 2 baths1,680 sq. ft.
210 Vz County Rd 2139, Canton, TX 75103
MLS# 21005280Listed by: CENTURY 21 FIRST GROUP $685,000Pending4 beds 4 baths3,699 sq. ft.
225 Chester Drive, Canton, TX 75103
MLS# 25009597Listed by: COLDWELL BANKER ANDERSON REALTORS $499,000Active3 beds 3 baths1,965 sq. ft.
965 Vz County Road 2141, Canton, TX 75103
MLS# 20966490Listed by: PITTS REALTY $775,000Active30.84 Acres
TBD St. Hwy 64, Canton, TX 75103
MLS# 21161163Listed by: MILLER HOMES GROUP $60,000Active1.2 Acres
000 Fm 1651, Canton, TX 75103
MLS# 20965434Listed by: EXIT REALTY PINNACLE GROUP $315,490Pending5 beds 3 baths2,492 sq. ft.
195 Hunters Way, Canton, TX 75103
MLS# 20964970Listed by: JEANETTE ANDERSON REAL ESTATE $495,000Active4 beds 4 baths3,249 sq. ft.
336 Maggie Street, Canton, TX 75103
MLS# 20944968Listed by: ONDEMAND REALTY $79,900Active1.38 Acres
2974 Vz County Road 2410, Canton, TX 75103
MLS# 21185603Listed by: TRUE ONE REALTY, LLC $299,000Active20.2 Acres
760 Vzcr 2315, Canton, TX 75103
MLS# 108612Listed by: COLDWELL BANKER AMERICAN DREAM REALTY $199,000Pending3 beds 2 baths1,572 sq. ft.
685 Sides Circle, Canton, TX 75103
MLS# 21055040Listed by: EBBY HALLIDAY REALTORS $259,490Active3 beds 2 baths1,412 sq. ft.
341 Dry Creek, Canton, TX 75103
MLS# 25002815Listed by: JEANETTE ANDERSON REAL ESTATE $375,000Pending26.24 Acres
000 Vz County Road 2304, Canton, TX 75103
MLS# 21166642Listed by: CALL IT CLOSED REALTY $139,900Pending6.14 Acres
34744 Fm 47, Mabank, TX 75103
MLS# 20822794Listed by: M&D REAL ESTATE $85,000Active3 beds 2 baths1,116 sq. ft.
211 Private Road 5308, Canton, TX 75103
MLS# 20821370Listed by: RE/MAX LANDMARK ROSE $330,000Active0.3 Acres
150 E Terrell, Canton, TX 75103
MLS# 20806973Listed by: EXIT REALTY PRO $130,000Active2.87 Acres
TBD Vz County Road 4106 #Lot 14A, Canton, TX 75103
MLS# 20801246Listed by: PITTS REALTY $130,000Active2.87 Acres
TBD Vz County Road 4106 #Lot 14B, Canton, TX 75103
MLS# 20801438Listed by: PITTS REALTY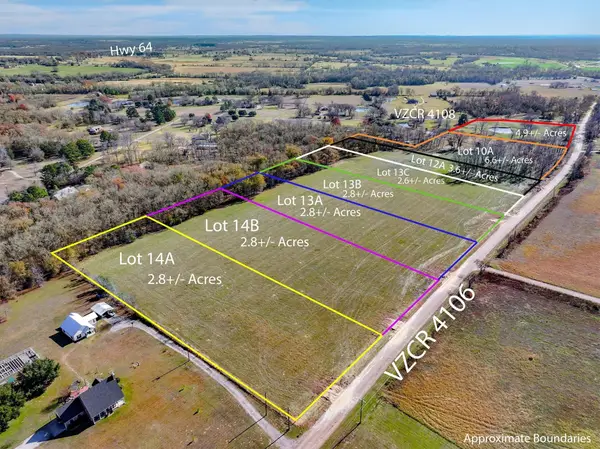 $130,000Active2.87 Acres
TBD Vz County Road 4106 #Lot 13A, Canton, TX 75103
MLS# 20801504Listed by: PITTS REALTY $130,000Active2.87 Acres
TBD Vz County Road 4106 #Lot 13B, Canton, TX 75103
MLS# 20801512Listed by: PITTS REALTY $180,000Active6.68 Acres
TBD Vz County Road 4106 #Lot 10A, Canton, TX 75103
MLS# 20801543Listed by: PITTS REALTY $125,000Active2 beds 1 baths1,148 sq. ft.
1055 Vz County Road 2106, Canton, TX 75103
MLS# 20798103Listed by: BACK 4T LLC $545,000Active67 Acres
11532 Fm 1651, Mabank, TX 75147
MLS# 20744189Listed by: BACK 4T LLC $1,095,000Active51.73 Acres
0 St Hwy 198 Highway, Canton, TX 75103
MLS# 20748389Listed by: TX LAKE & LAND REAL ESTATE $250,000Active3.65 Acres
0000 Fm 17, Canton, TX 75103
MLS# 20658966Listed by: GILDENSON REAL ESTATE, LLC $57,500Active0.65 Acres
TBD Lot 15 Doris Drive, Canton, TX 75103
MLS# 20606969Listed by: RE/MAX LANDMARK ROSE $62,500Active0.67 Acres
TBD Lot 23 Ellis Avenue, Canton, TX 75103
MLS# 20606993Listed by: RE/MAX LANDMARK ROSE $67,500Active0.69 Acres
TBD Lot 30 Lakeview Drive, Canton, TX 75103
MLS# 20606996Listed by: RE/MAX LANDMARK ROSE $550,000Active3 beds 3 baths2,460 sq. ft.
2505 Vz County Road 2511, Canton, TX 75103
MLS# 20548832Listed by: FENNER & NICKLAS ENTERPRISES $340,200Active18.9 Acres
Tract 1 Vz County Road 2304, Canton, TX 75103
MLS# 20525292Listed by: BACK 4T LLC $311,800Active15.59 Acres
Tract 3 Vz County Road 2303, Canton, TX 75103
MLS# 20526317Listed by: BACK 4T LLC $660,000Active40 Acres
TBD Vz County Road 2506, Canton, TX 75103
MLS# 20516991Listed by: BACK 4T LLC $174,000Pending11.6 Acres
Lot 4 Hwy-19, Canton, TX 75103
MLS# 14762370Listed by: FATHOM REALTY
Local realty services provided by:CENTURY 21 Harvey Properties, CENTURY 21 Judge Fite Company, CENTURY 21 A Select Group
Information provided, in part, by North Texas Real Estate Information Systems, Inc. Last Updated May 7, 2026 Listings with the NTREIS logo are listed by brokerages other than CENTURY 21 Harvey Properties.
Copyright 2026, Houston Realtors Information Service, Inc. All information provided is deemed reliable but is not guaranteed and should be independently verified. IDX information is provided exclusively for consumers' personal, non-commercial use, it may not be used for any purpose other than to identify prospective properties consumers may be interested in purchasing, and the data is deemed reliable but is not guaranteed accurate by the MLS.
Popular searches near 75103
Popular neighborhoods near 75103
- Azalea District, Tyler homes for sale
- Brick Streets District, Tyler homes for sale
- Butler College, Tyler homes for sale
- Cambridge, Tyler homes for sale
- Cascades, Tyler homes for sale
- Charnwood District, Tyler homes for sale
- Connally Heights, Tyler homes for sale
- Cumberland Ridge, Bullard homes for sale
- Downtown Tyler, Tyler homes for sale
- Eagle's Bluff, Bullard homes for sale
- Emerald Bay, Bullard homes for sale
- Falcons Lair, Mesquite homes for sale
- Hollytree, Tyler homes for sale
- Lakeway Harbor, Flint homes for sale
- The Cumberland Estates, Tyler homes for sale
- The Highlands, Tyler homes for sale
- The Villages, Flint homes for sale
- The Woods, Tyler homes for sale
- Timber Creek Estates, Rockwall homes for sale
- Windmill Farms, Forney homes for sale
Counties near Canton, 75103
- Anderson County homes for sale
- Camp County homes for sale
- Collin County homes for sale
- Dallas County homes for sale
- Delta County homes for sale
- Ellis County homes for sale
- Franklin County homes for sale
- Freestone County homes for sale
- Gregg County homes for sale
- Henderson County homes for sale
- Hopkins County homes for sale
- Hunt County homes for sale
- Kaufman County homes for sale
- Navarro County homes for sale
- Rains County homes for sale
- Rockwall County homes for sale
- Smith County homes for sale
- Upshur County homes for sale
- Van Zandt County homes for sale
- Wood County homes for sale
Protect your home and budget from life's surprises with an Assurant Home Warranty, backed by a partner that supports you through every step of homeownership. Explore Plans.
©2026 Century 21 Real Estate LLC. All rights reserved. CENTURY 21®, the CENTURY 21 Logo and C21® are service marks owned by Century 21 Real Estate LLC. Century 21 Real Estate LLC fully supports the principles of the Fair Housing Act and the Equal Opportunity Act. Each office is independently owned and operated. Listing information is deemed reliable but not guaranteed accurate.