- Atascosa homes for sale
- Castroville homes for sale
- Castroville-LaCoste homes for sale
- Cross Mountain homes for sale
- Grey Forest homes for sale
- Helotes homes for sale
- Jbsa Lackland homes for sale
- La Coste homes for sale
- Lackland Air Force Base homes for sale
- Lacoste homes for sale
- Lakehills homes for sale
- Leon Valley homes for sale
- Macdona homes for sale
- Mico homes for sale
- Pipe Creek homes for sale
- Rio Medina homes for sale
- San Antonio homes for sale
- San Antonio Northwest homes for sale
- San Antonio West homes for sale
- Von Ormy homes for sale
78253, TX - homes for sale
300 of 1,257 results displayed
- New
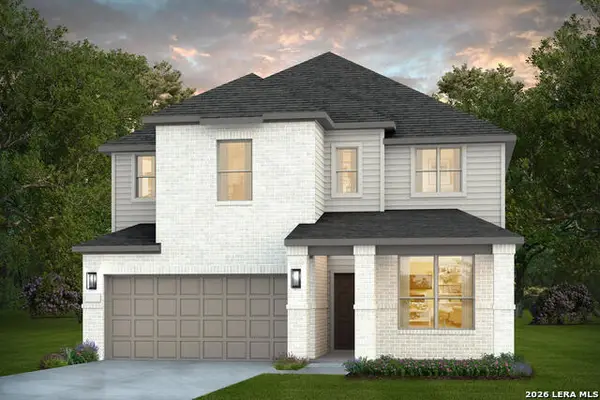
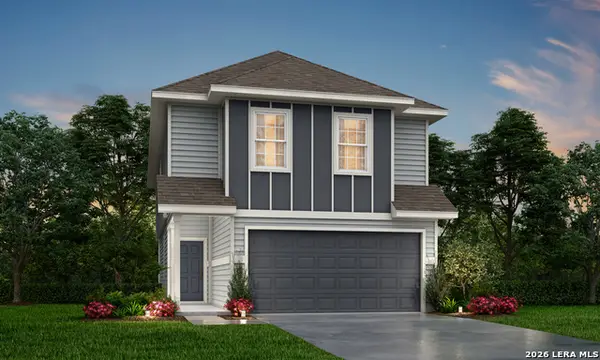
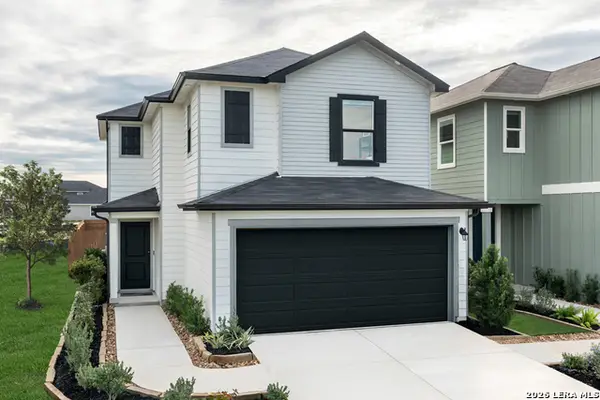
 $360,000Active4 beds 4 baths2,251 sq. ft.
13805 Chester Knoll, San Antonio, TX 78253
MLS# 1990505Listed by: REALTY ONE GROUP EMERALD - New
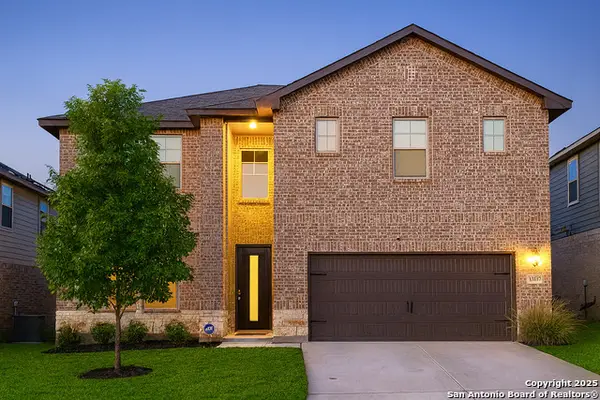
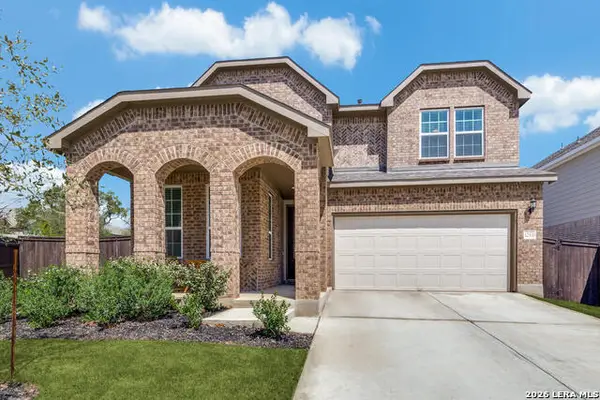
 $396,000Active3 beds 2 baths2,074 sq. ft.
4259 Warm Winds, San Antonio, TX 78253
MLS# 1990479Listed by: COLDWELL BANKER D'ANN HARPER, REALTOR - New
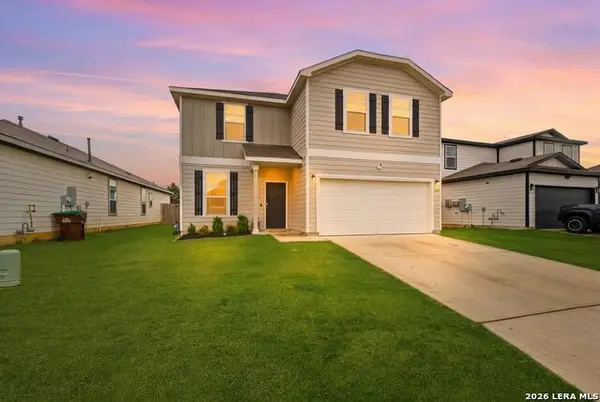
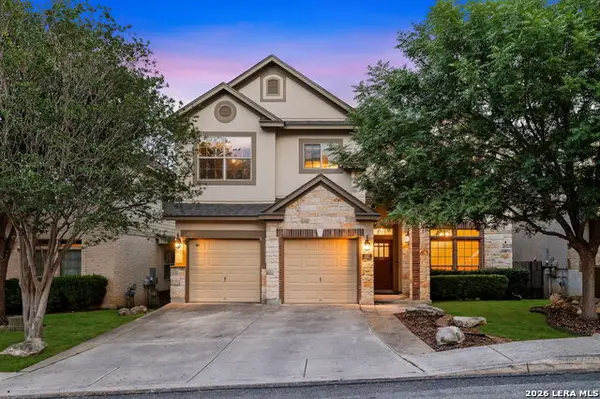
 $299,999Active3 beds 3 baths2,087 sq. ft.
6703 Karnes Leaf, San Antonio, TX 78253
MLS# 1990397Listed by: EXP REALTY - New
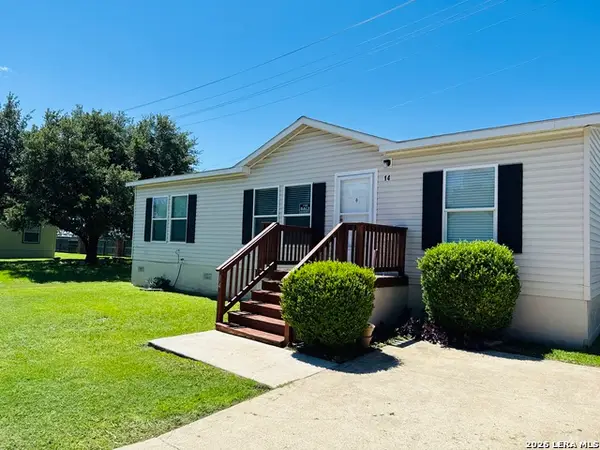
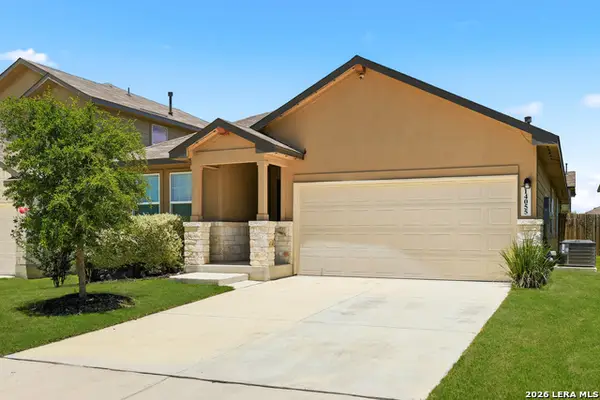
 $414,440Active4 beds 2 baths2,101 sq. ft.
161 Thorny Grv, San Antonio, TX 78253
MLS# 1990413Listed by: MOVE UP AMERICA - New
 $494,190Active4 beds 4 baths2,960 sq. ft.
12437 Nazareth, San Antonio, TX 78253
MLS# 1990359Listed by: MOVE UP AMERICA - New
 $574,120Active4 beds 4 baths3,668 sq. ft.
1324 Hallettsville, San Antonio, TX 78253
MLS# 1990371Listed by: MOVE UP AMERICA - New
 $544,710Active4 beds 4 baths3,154 sq. ft.
12525 Daingerfield, San Antonio, TX 78253
MLS# 1990352Listed by: MOVE UP AMERICA - New
 $259,000Active4 beds 3 baths1,953 sq. ft.
14525 Payton Flts, San Antonio, TX 78253
MLS# 1990320Listed by: VIVID REALTY, LLC - New
 $250,400Active3 beds 2 baths1,568 sq. ft.
116 Mahaffey Way, San Antonio, TX 78264
MLS# 1990329Listed by: TEXAS SIGNATURE REALTY - New
 $435,000Active5 beds 4 baths3,114 sq. ft.
7030 Plains Way, San Antonio, TX 78253
MLS# 1990275Listed by: LISTINGSPARK - New
 $624,900Active4 beds 4 baths3,240 sq. ft.
264 Haby Hill, San Antonio, TX 78253
MLS# 1990268Listed by: HOMESUSA.COM - New
 $347,000Active4 beds 3 baths1,968 sq. ft.
13658 Gunnison Quartz, San Antonio, TX 78253
MLS# 1990257Listed by: KELLER WILLIAMS HERITAGE  $750,000Active2 beds 2 baths964 sq. ft.
15464 Culebra Rd #29, San Antonio, TX 78253
MLS# 1968798Listed by: BHHS DON JOHNSON REALTORS - SA- New
 $202,315Active3 beds 2 baths1,002 sq. ft.
14856 Gold Lace Cactus, San Antonio, TX 78221
MLS# 1990201Listed by: KELLER WILLIAMS HERITAGE - New
 $1,449,000Active6 beds 6 baths6,190 sq. ft.
613 N Rolling Vw, San Antonio, TX 78253
MLS# 1973090Listed by: KELLER WILLIAMS CITY-VIEW - New
 $524,535Active5 beds 4 baths2,819 sq. ft.
12450 Nazareth, San Antonio, TX 78253
MLS# 1990025Listed by: MOVE UP AMERICA - New
 $524,820Active4 beds 3 baths2,571 sq. ft.
12453 Nazareth, San Antonio, TX 78253
MLS# 1990047Listed by: MOVE UP AMERICA - New
 $815,000Active4 beds 3 baths3,006 sq. ft.
419 S Rolling Vw, San Antonio, TX 78253
MLS# 1990084Listed by: EXP REALTY - New
 $630,900Active5 beds 5 baths3,615 sq. ft.
203 Haby Hollow, San Antonio, TX 78253
MLS# 1990089Listed by: HOMESUSA.COM - New
 $296,500Active5 beds 3 baths2,009 sq. ft.
6138 Unakite Trail, San Antonio, TX 78253
MLS# 1974500Listed by: KELLER WILLIAMS HERITAGE - New
 $308,300Active4 beds 3 baths2,243 sq. ft.
6142 Unakite Trail, San Antonio, TX 78253
MLS# 1975710Listed by: KELLER WILLIAMS HERITAGE - New
 $499,190Active5 beds 4 baths2,960 sq. ft.
1422 Knippa, San Antonio, TX 78253
MLS# 1990018Listed by: MOVE UP AMERICA - New
 $263,745Active5 beds 3 baths1,892 sq. ft.
271 Pigeon Green, San Antonio, TX 78253
MLS# 1973787Listed by: KELLER WILLIAMS HERITAGE - New
 $246,110Active3 beds 2 baths1,280 sq. ft.
15406 Ruby Hummingbird, San Antonio, TX 78253
MLS# 1973788Listed by: KELLER WILLIAMS HERITAGE - New
 $261,295Active5 beds 3 baths1,892 sq. ft.
15410 Ruby Hummingbird, San Antonio, TX 78253
MLS# 1973789Listed by: KELLER WILLIAMS HERITAGE - New
 $549,220Active4 beds 3 baths2,571 sq. ft.
1219 Bovina, San Antonio, TX 78253
MLS# 1973791Listed by: MOVE UP AMERICA - New
 $269,000Active3 beds 2 baths1,411 sq. ft.
6134 Unakite Trail, San Antonio, TX 78253
MLS# 1973792Listed by: KELLER WILLIAMS HERITAGE - New
 $489,900Active3 beds 3 baths2,246 sq. ft.
221 Haby Hollow, San Antonio, TX 78253
MLS# 1973704Listed by: HOMESUSA.COM - New
 $460,000Active4 beds 4 baths3,100 sq. ft.
12543 Loving Ml, San Antonio, TX 78253
MLS# 1973652Listed by: LPT REALTY, LLC - New
 $539,900Active5 beds 4 baths3,108 sq. ft.
13107 Braxon Pass, San Antonio, TX 78253
MLS# 1973643Listed by: EXP REALTY - New
 $525,000Active5 beds 4 baths3,640 sq. ft.
12807 Perdido Grove, San Antonio, TX 78253
MLS# 1971225Listed by: COLDWELL BANKER D'ANN HARPER - New
 $324,900Active4 beds 3 baths2,409 sq. ft.
7206 Whipsaw Pt, San Antonio, TX 78253
MLS# 1973576Listed by: TEXAS PREMIER REALTY - New
 $60,000Active3 beds 2 baths1,144 sq. ft.
11555 LOT 14 Culebra, San Antonio, TX 78253
MLS# 1972510Listed by: JOHN BLIG REAL ESTATE BROKER - New
 $255,000Active3 beds 2 baths1,696 sq. ft.
236 Kildeer Crk, San Antonio, TX 78253
MLS# 1973534Listed by: REALTY22 INC - New
 $379,900Active4 beds 4 baths2,599 sq. ft.
5727 Freeport Leaf, San Antonio, TX 78253
MLS# 1973450Listed by: COLDWELL BANKER D'ANN HARPER - New
 $763,900Active5 beds 5 baths2,942 sq. ft.
121 Habys Cove, San Antonio, TX 78253
MLS# 1973468Listed by: PERRY HOMES REALTY, LLC - New
 $389,900Active4 beds 3 baths3,042 sq. ft.
11611 Creek Ash, San Antonio, TX 78253
MLS# 1973316Listed by: EPIQUE REALTY LLC - New
 $290,000Active4 beds 2 baths1,602 sq. ft.
14666 Emerio Dr, San Antonio, TX 78253
MLS# 1973323Listed by: REAL BROKER, LLC - New
 $308,000Active3 beds 3 baths2,306 sq. ft.
13745 Crossbow Rdg, San Antonio, TX 78253
MLS# 1973327Listed by: ORCHARD BROKERAGE - New
 $354,990Active3 beds 2 baths1,929 sq. ft.
5551 Ennis Trce, San Antonio, TX 78253
MLS# 1973328Listed by: MERITAGE HOMES REALTY - New
 $285,000Active3 beds 2 baths1,881 sq. ft.
1618 Firwick, San Antonio, TX 78253
MLS# 1973274Listed by: LPT REALTY, LLC - New
 $250,000Active4 beds 2 baths1,600 sq. ft.
13811 Chital Chase, San Antonio, TX 78253
MLS# 1973221Listed by: MARTI REALTY GROUP - New
 $230,000Active3 beds 2 baths1,266 sq. ft.
13819 Chital Chase, San Antonio, TX 78253
MLS# 1973229Listed by: MARTI REALTY GROUP - New
 $424,499Active4 beds 3 baths2,587 sq. ft.
105 Laurel Hike, San Antonio, TX 78253
MLS# 1973231Listed by: EXP REALTY - New
 $419,900Active3 beds 3 baths2,773 sq. ft.
3311 Cameron Cv, San Antonio, TX 78253
MLS# 1973198Listed by: EXP REALTY - New
 $367,500Active3 beds 2 baths1,924 sq. ft.
6243 Cecilyann, San Antonio, TX 78253
MLS# 1973202Listed by: BETTER HOMES AND GARDENS WINANS - New
 $245,000Active4 beds 2 baths1,575 sq. ft.
13815 Chital Chase, San Antonio, TX 78253
MLS# 1973174Listed by: MARTI REALTY GROUP - New
 $375,000Active3 beds 2 baths1,979 sq. ft.
5307 Azalea Fern, San Antonio, TX 78253
MLS# 1973135Listed by: KELLER WILLIAMS HERITAGE - New
 $250,000Active4 beds 2 baths1,600 sq. ft.
2407 Vireo Way, San Antonio, TX 78253
MLS# 1973060Listed by: MARTI REALTY GROUP - Open Sat, 12 to 5pmNew
 $368,500Active4 beds 2 baths1,901 sq. ft.
7123 Pioneer Rock, San Antonio, TX 78253
MLS# 1973044Listed by: KELLER WILLIAMS CITY-VIEW - New
 $390,000Active4 beds 4 baths3,394 sq. ft.
1112 Creek Cabin, San Antonio, TX 78253
MLS# 1973051Listed by: BETTER HOMES AND GARDENS WINANS - New
 $320,000Active4 beds 3 baths2,680 sq. ft.
5722 Ginger Rise, San Antonio, TX 78253
MLS# 1973056Listed by: REAL BROKER, LLC - New
 $875,000Active4 beds 4 baths3,747 sq. ft.
199 Poe Pkwy, Castroville, TX 78009
MLS# 1972960Listed by: PREMIER REALTY GROUP PLATINUM - New
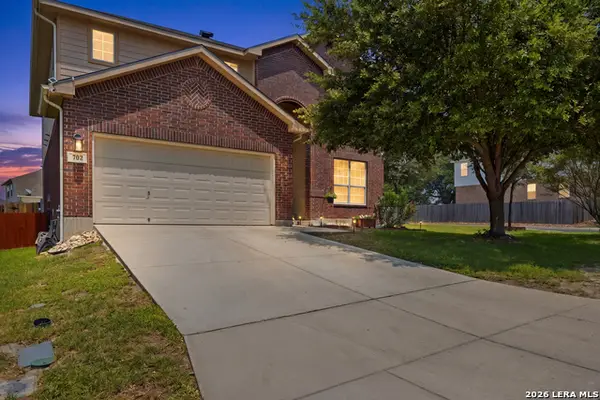 $390,000Active4 beds 3 baths2,754 sq. ft.
702 Point Sunset, San Antonio, TX 78253
MLS# 1972940Listed by: OUR TEXAS REAL ESTATE - New
 $340,000Active4 beds 3 baths3,271 sq. ft.
12642 Point Smt, San Antonio, TX 78253
MLS# 1972952Listed by: E M ELLIS REALTY LLC - New
 $750,000Active4 beds 4 baths3,083 sq. ft.
381 Private Road 3702, San Antonio, TX 78253
MLS# 1972930Listed by: 1ST CHOICE REALTY GROUP - New
 $249,900Active3 beds 3 baths2,044 sq. ft.
127 Palazzo Torre, San Antonio, TX 78253
MLS# 1972896Listed by: KELLER WILLIAMS LEGACY - New
 $493,000Active3 beds 3 baths2,756 sq. ft.
4506 El Bosque, San Antonio, TX 78253
MLS# 1972828Listed by: ORCHARD BROKERAGE - New
 $305,000Active3 beds 3 baths2,088 sq. ft.
13170 Beals, San Antonio, TX 78253
MLS# 1972847Listed by: WEALTH PARTNERS REALTY GROUP, LLC - New
 $354,990Active3 beds 2 baths1,929 sq. ft.
1258 Nikos Holw, San Antonio, TX 78245
MLS# 1972790Listed by: MERITAGE HOMES REALTY - Open Wed, 9am to 7pmNew
 $273,000Active4 beds 2 baths1,703 sq. ft.
928 Red Merganser, San Antonio, TX 78253
MLS# 1972746Listed by: OPENDOOR BROKERAGE, LLC  $291,950Pending3 beds 2 baths1,442 sq. ft.
208 Velvet Coronet, San Antonio, TX 78253
MLS# 1970461Listed by: KELLER WILLIAMS HERITAGE- New
 $304,950Active3 beds 2 baths1,489 sq. ft.
14403 Nolan Garnet, San Antonio, TX 78253
MLS# 1972684Listed by: KELLER WILLIAMS HERITAGE - New
 $355,780Active4 beds 3 baths2,152 sq. ft.
13714 Guajillo Spg, San Antonio, TX 78253
MLS# 1972634Listed by: ESCAPE REALTY - New
 $371,850Active4 beds 4 baths2,233 sq. ft.
13710 Guajillo Spg, San Antonio, TX 78253
MLS# 1972609Listed by: ESCAPE REALTY - New
 $330,751Active3 beds 2 baths1,504 sq. ft.
13718 Guajillo Spg, San Antonio, TX 78253
MLS# 1972603Listed by: ESCAPE REALTY - New
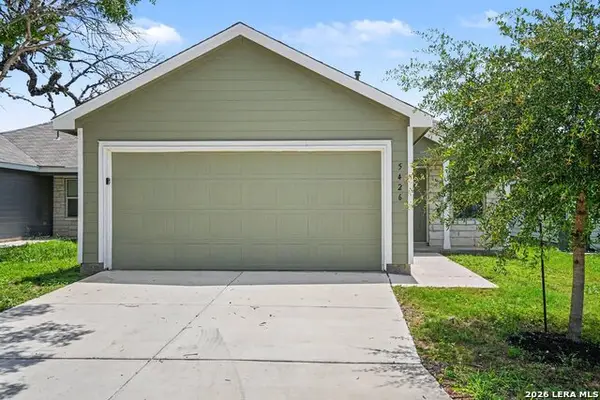 $219,900Active3 beds 2 baths1,450 sq. ft.
5426 Daphne Path, San Antonio, TX 78253
MLS# 1972428Listed by: ENTERA REALTY LLC - New
 $439,900Active4 beds 4 baths2,934 sq. ft.
12114 Carson Cv, San Antonio, TX 78253
MLS# 1972392Listed by: STONEPOINT PROPERTIES INC - New
 $274,110Active3 beds 2 baths1,434 sq. ft.
13854 Garnet Pike Lane, San Antonio, TX 78253
MLS# 1972290Listed by: KELLER WILLIAMS HERITAGE - New
 $584,105Active3 beds 3 baths2,494 sq. ft.
710 Niebla Creek, San Antonio, TX 78263
MLS# 1972323Listed by: CHESMAR HOMES - New
 $313,500Active4 beds 3 baths2,243 sq. ft.
6131 Unakite Trail, San Antonio, TX 78253
MLS# 1972260Listed by: KELLER WILLIAMS HERITAGE - New
 $264,000Active3 beds 2 baths1,411 sq. ft.
6115 Unakite Trail, San Antonio, TX 78253
MLS# 1972263Listed by: KELLER WILLIAMS HERITAGE - New
 $308,300Active4 beds 3 baths2,243 sq. ft.
6111 Unakite Trail, San Antonio, TX 78253
MLS# 1972265Listed by: KELLER WILLIAMS HERITAGE - New
 $397,550Active5 beds 4 baths2,660 sq. ft.
13669 Gunnison Quartz, San Antonio, TX 78253
MLS# 1972268Listed by: KELLER WILLIAMS HERITAGE - New
 $247,900Active3 beds 2 baths1,180 sq. ft.
1138 Barn Swallow Way, San Antonio, TX 78253
MLS# 1972276Listed by: CA & COMPANY, REALTORS - New
 $359,000Active4 beds 2 baths1,703 sq. ft.
13673 Gunnison Quartz, San Antonio, TX 78253
MLS# 1972278Listed by: KELLER WILLIAMS HERITAGE - New
 $392,550Active5 beds 3 baths2,539 sq. ft.
13685 Gunnison Quartz, San Antonio, TX 78253
MLS# 1972280Listed by: KELLER WILLIAMS HERITAGE - New
 $295,295Active5 beds 3 baths2,203 sq. ft.
13858 Garnet Pike Lane, San Antonio, TX 78253
MLS# 1972287Listed by: KELLER WILLIAMS HERITAGE - New
 $320,000Active4 beds 3 baths3,102 sq. ft.
11823 Barkston Dr, San Antonio, TX 78253
MLS# 1972242Listed by: ELIST REO LLC - New
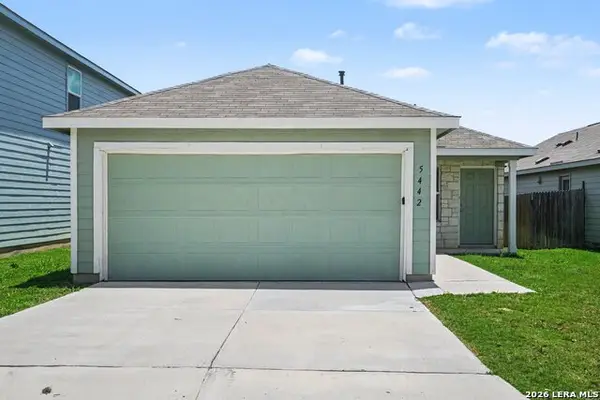 $209,900Active3 beds 2 baths1,276 sq. ft.
5442 Daphne Path, San Antonio, TX 78253
MLS# 1972186Listed by: ENTERA REALTY LLC - New
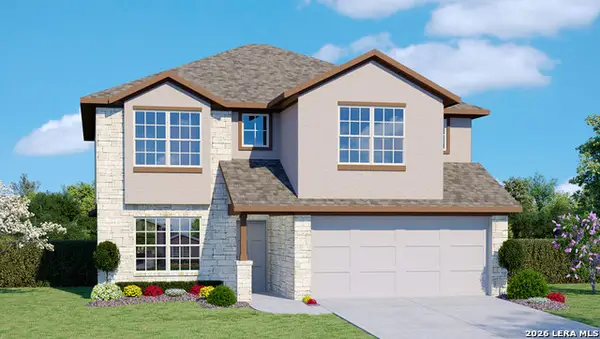
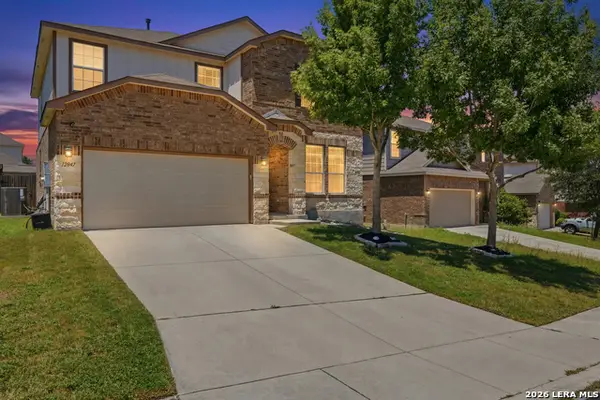 $315,000Active4 beds 3 baths2,142 sq. ft.
12847 Limestone Way, San Antonio, TX 78253
MLS# 1972004Listed by: OUR TEXAS REAL ESTATE - New
 $295,525Active4 beds 3 baths1,745 sq. ft.
14927 Fischer Garden, San Antonio, TX 78253
MLS# 1971972Listed by: LEGEND HOMES - New
 $400,000Active4 beds 3 baths2,287 sq. ft.
12402 Loving Ml, San Antonio, TX 78253
MLS# 1971979Listed by: JT REALTY NETWORK - New
 $400,000Active4 beds 4 baths2,403 sq. ft.
5703 Beths Way, San Antonio, TX 78253
MLS# 1971997Listed by: COLDWELL BANKER D'ANN HARPER, REALTOR - New
 $575,000Active5 beds 4 baths3,640 sq. ft.
12811 Tibetta Grn, San Antonio, TX 78253
MLS# 1971915Listed by: LPT REALTY, LLC - New
 $311,645Active4 beds 3 baths2,191 sq. ft.
14911 Fischer Garden, San Antonio, TX 78253
MLS# 1971953Listed by: LEGEND HOMES - Open Wed, 9am to 7pmNew
 $195,000Active3 beds 3 baths1,187 sq. ft.
7610 Aston Cross, San Antonio, TX 78253
MLS# 1971965Listed by: OPENDOOR BROKERAGE, LLC - New
 $449,000Active4 beds 3 baths2,385 sq. ft.
12531 Yancey, San Antonio, TX 78253
MLS# 1971873Listed by: BEYCOME BROKERAGE REALTY LLC - New
 $228,749Active3 beds 2 baths1,411 sq. ft.
13938 Axis Pass, San Antonio, TX 78253
MLS# 1971846Listed by: MARTI REALTY GROUP - New
 $430,000Active4 beds 4 baths3,448 sq. ft.
342 Chloe Hts, San Antonio, TX 78253
MLS# 1971767Listed by: ORCHARD BROKERAGE - New
 $334,000Active4 beds 2 baths1,902 sq. ft.
14055 Mudstone St, San Antonio, TX 78253
MLS# 1971803Listed by: REALTY EXECUTIVES OF S.A. - Open Sat, 10am to 6pmNew
 $399,190Active4 beds 3 baths2,726 sq. ft.
319 Nopal Ridge, San Antonio, TX 78253
MLS# 1971666Listed by: MARTI REALTY GROUP - Open Sat, 10am to 6pmNew
 $344,190Active3 beds 2 baths1,899 sq. ft.
337 Nopal Ridge, San Antonio, TX 78253
MLS# 1971652Listed by: MARTI REALTY GROUP - New
 $1,500,000Active-- beds -- baths
TBD Flintdale Loop, San Antonio, TX 78253
MLS# 1971560Listed by: NIVA REALTY - New
 $504,990Active4 beds 3 baths2,984 sq. ft.
448 Desert Cactus, San Antonio, TX 78253
MLS# 1971597Listed by: EXP REALTY  $384,999Pending4 beds 4 baths2,790 sq. ft.
15107 S Wingheart, San Antonio, TX 78253
MLS# 1971499Listed by: 1ST CHOICE REALTY GROUP- New
 $220,000Active2.07 Acres
4623 Tamaron Park, San Antonio, TX 78253
MLS# 1971385Listed by: JUSTIN CRISP - New
 $520,000Active4 beds 4 baths3,337 sq. ft.
12315 Lexi Petal, San Antonio, TX 78253
MLS# 1971309Listed by: PREMIER REALTY GROUP PLATINUM - New
 $202,999Active4 beds 2 baths1,600 sq. ft.
14427 Elijah Path, San Antonio, TX 78221
MLS# 1971234Listed by: MARTI REALTY GROUP - New
 $439,000Active3 beds 4 baths2,778 sq. ft.
5815 Cedar Hill Way, San Antonio, TX 78253
MLS# 1971210Listed by: POWER & PEEL REAL ESTATE 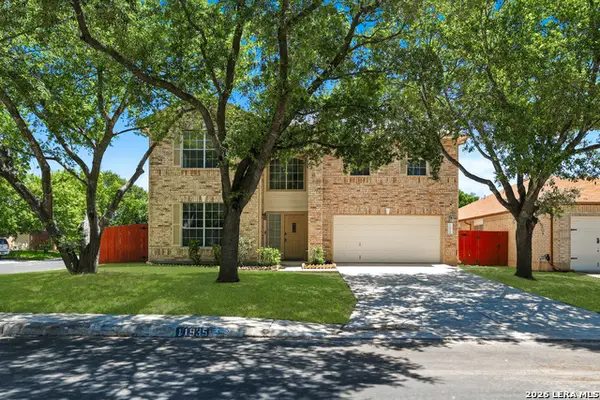 $370,000Active4 beds 3 baths3,048 sq. ft.
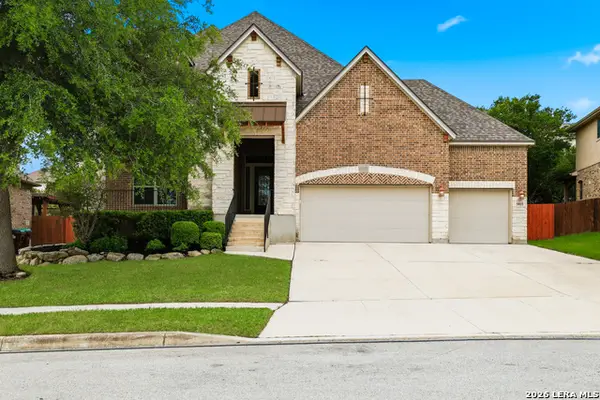
11935 Barkston, San Antonio, TX 78253
MLS# 1971136Listed by: INSPIRED BROKERAGE, LLC $539,000Pending3 beds 3 baths2,539 sq. ft.
3911 Tangled Springs, San Antonio, TX 78253
MLS# 1971141Listed by: KELLER WILLIAMS CITY-VIEW $475,000Active4 beds 2 baths2,589 sq. ft.
12603 Pine Warbler, San Antonio, TX 78253
MLS# 1971153Listed by: REALTY ONE GROUP EMERALD $634,000Active3 beds 3 baths2,450 sq. ft.
3231 Lilly Flower, San Antonio, TX 78253
MLS# 1971160Listed by: EXQUISITE PROPERTIES, LLC $375,000Active5 beds 3 baths2,466 sq. ft.
6103 Briscoe Leaf, San Antonio, TX 78253
MLS# 1971127Listed by: LPT REALTY, LLC $440,000Pending5 beds 4 baths3,443 sq. ft.
12830 Sabinal River, San Antonio, TX 78253
MLS# 1971065Listed by: KELLER WILLIAMS LEGACY $345,000Active3 beds 3 baths2,072 sq. ft.
7602 Wallaby Isle, San Antonio, TX 78253
MLS# 1971079Listed by: LPT REALTY, LLC $499,000Active4 beds 4 baths3,483 sq. ft.
12607 Alstroemeria, San Antonio, TX 78253
MLS# 1970986Listed by: BK REAL ESTATE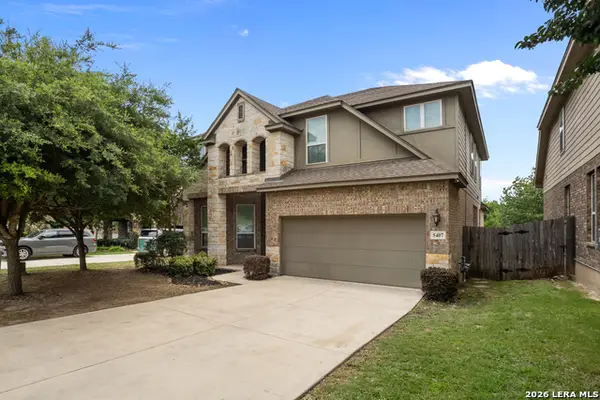 $495,990Active5 beds 4 baths3,245 sq. ft.
5407 Saffron Rose, San Antonio, TX 78253
MLS# 1970950Listed by: EXP REALTY $277,600Pending3 beds 3 baths1,625 sq. ft.
13926 Pease Crossing, San Antonio, TX 78253
MLS# 1962493Listed by: KELLER WILLIAMS HERITAGE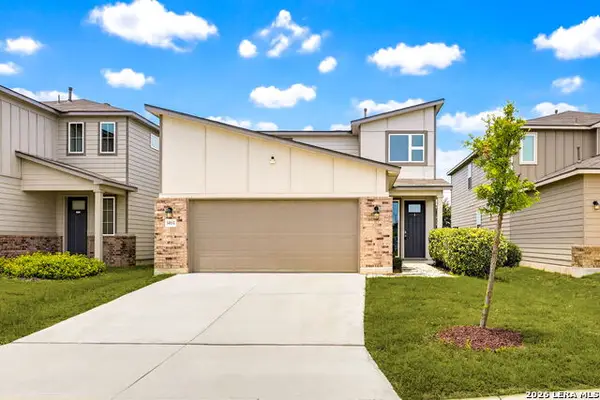 $309,950Active4 beds 3 baths2,193 sq. ft.
14631 Sweet Clover, San Antonio, TX 78253
MLS# 1970922Listed by: REAL BROKER, LLC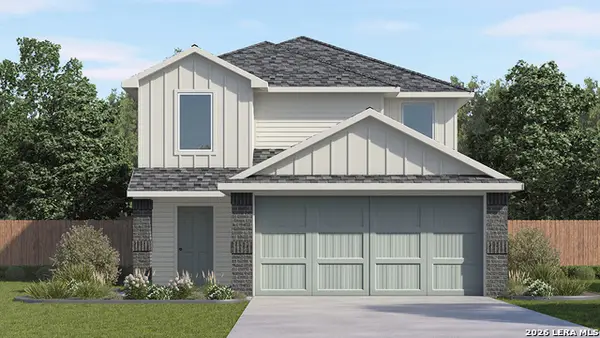 $294,295Active5 beds 3 baths2,203 sq. ft.
13850 Garnet Pike Lane, San Antonio, TX 78253
MLS# 1970926Listed by: KELLER WILLIAMS HERITAGE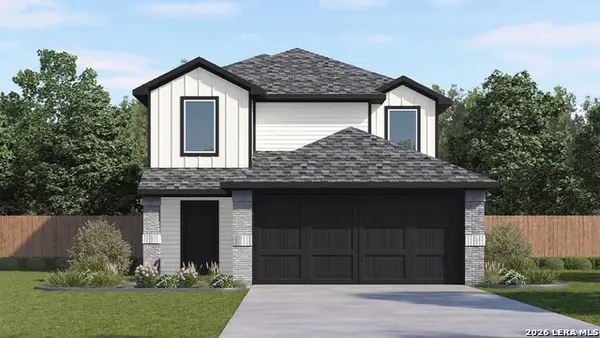 $294,295Active5 beds 3 baths2,203 sq. ft.
13842 Garnet Pike Lane, San Antonio, TX 78253
MLS# 1970927Listed by: KELLER WILLIAMS HERITAGE $294,295Active5 beds 3 baths2,203 sq. ft.
13834 Garnet Pike Lane, San Antonio, TX 78253
MLS# 1970929Listed by: KELLER WILLIAMS HERITAGE $294,295Active5 beds 3 baths2,203 sq. ft.
13826 Garnet Pike Lane, San Antonio, TX 78253
MLS# 1970931Listed by: KELLER WILLIAMS HERITAGE $294,295Active5 beds 3 baths2,203 sq. ft.
13818 Garnet Pike Lane, San Antonio, TX 78253
MLS# 1970933Listed by: KELLER WILLIAMS HERITAGE $401,850Active5 beds 4 baths2,660 sq. ft.
13689 Gunnison Quartz, San Antonio, TX 78253
MLS# 1970938Listed by: KELLER WILLIAMS HERITAGE $487,950Active5 beds 4 baths3,532 sq. ft.
4719 Gypsum Falls, San Antonio, TX 78253
MLS# 1970940Listed by: KELLER WILLIAMS HERITAGE $277,600Active3 beds 3 baths1,625 sq. ft.
6135 Unakite Trail, San Antonio, TX 78253
MLS# 1970944Listed by: KELLER WILLIAMS HERITAGE $462,475Active4 beds 3 baths2,118 sq. ft.
12550 Sylvanite, San Antonio, TX 78254
MLS# 1970876Listed by: EXP REALTY $356,500Active4 beds 3 baths2,223 sq. ft.
13678 Gunnison Quartz, San Antonio, TX 78253
MLS# 1970894Listed by: KELLER WILLIAMS HERITAGE $290,000Active3 beds 2 baths1,635 sq. ft.
952 Brown Thrasher, San Antonio, TX 78253
MLS# 1970864Listed by: POPBY REALTY $355,000Active4 beds 3 baths2,368 sq. ft.
5949 Concho River, San Antonio, TX 78253
MLS# 1970851Listed by: KELLER WILLIAMS HERITAGE $343,490Active5 beds 3 baths2,609 sq. ft.
7515 Cottontail Cliff, San Antonio, TX 78253
MLS# 1970821Listed by: CA & COMPANY, REALTORS $435,990Active4 beds 3 baths3,126 sq. ft.
7715 Robert Mondavi, San Antonio, TX 78253
MLS# 1970728Listed by: RE/MAX NORTH-SAN ANTONIO $295,000Active3 beds 2 baths1,707 sq. ft.
4739 Becker Vine, San Antonio, TX 78253
MLS# 1970741Listed by: ORCHARD BROKERAGE $285,000Active2 beds 2 baths1,449 sq. ft.
3311 Blossom Row, San Antonio, TX 78253
MLS# 1970677Listed by: EXP REALTY $359,540Active4 beds 3 baths2,216 sq. ft.
15603 Doublecreek Drive, San Antonio, TX 78253
MLS# 1970641Listed by: EXP REALTY $269,950Active3 beds 2 baths1,617 sq. ft.
6815 Indian Ldg, San Antonio, TX 78253
MLS# 1970660Listed by: KELLER WILLIAMS HERITAGE $346,465Active5 beds 4 baths2,622 sq. ft.
14951 Fischer Garden, San Antonio, TX 78253
MLS# 1970667Listed by: LEGEND HOMES $289,500Active3 beds 2 baths1,708 sq. ft.
7619 Clos Du Bois, San Antonio, TX 78253
MLS# 1970608Listed by: TRUE VALOR REALTY $510,000Pending4 beds 4 baths3,733 sq. ft.
11439 Wake Robin, San Antonio, TX 78253
MLS# 8437336Listed by: KUPER SOTHEBY'S INT'L REALTY N $295,000Active4 beds 3 baths2,174 sq. ft.
1626 Firwick Dr, San Antonio, TX 78253
MLS# 1970568Listed by: KELLER WILLIAMS HERITAGE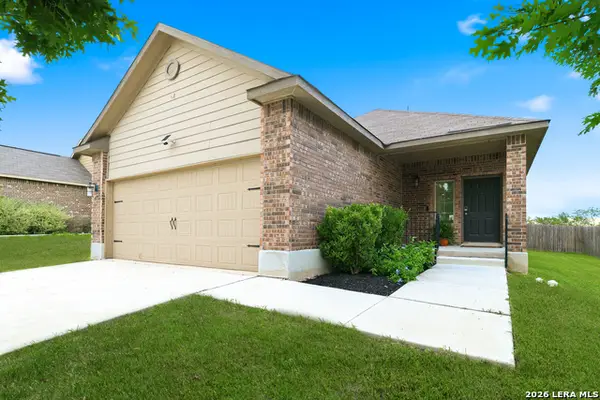 $265,000Active3 beds 2 baths1,541 sq. ft.
435 Hunters Rnch E, San Antonio, TX 78253
MLS# 1970531Listed by: REAL BROKER, LLC $275,110Active3 beds 2 baths1,434 sq. ft.
13814 Garnet Pike Lane, San Antonio, TX 78253
MLS# 1970497Listed by: KELLER WILLIAMS HERITAGE $283,795Active5 beds 3 baths1,892 sq. ft.
13810 Garnet Pike Lane, San Antonio, TX 78253
MLS# 1970507Listed by: KELLER WILLIAMS HERITAGE $275,170Active3 beds 3 baths1,470 sq. ft.
13806 Garnet Pike Lane, San Antonio, TX 78253
MLS# 1970511Listed by: KELLER WILLIAMS HERITAGE $283,295Active5 beds 3 baths1,892 sq. ft.
13802 Garnet Pike Lane, San Antonio, TX 78253
MLS# 1970513Listed by: KELLER WILLIAMS HERITAGE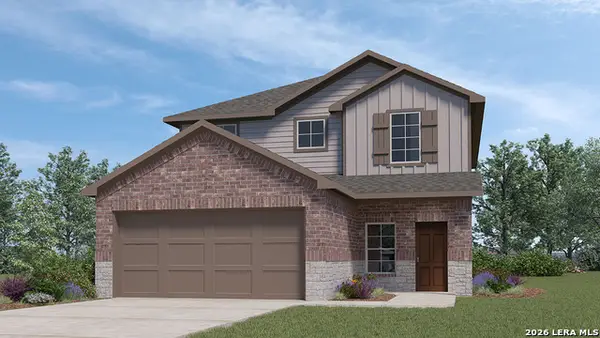 $369,500Active4 beds 3 baths2,473 sq. ft.
13682 Gunnison Quartz, San Antonio, TX 78253
MLS# 1970516Listed by: KELLER WILLIAMS HERITAGE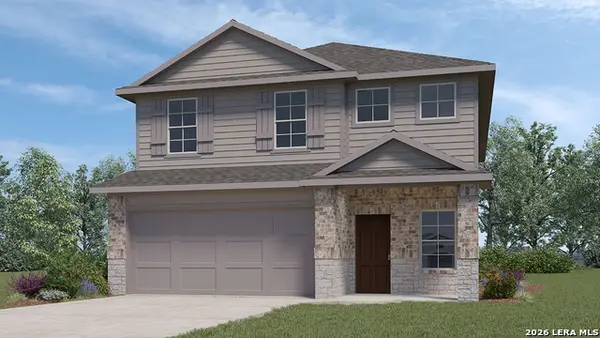 $368,500Active5 beds 3 baths2,498 sq. ft.
13686 Gunnison Quartz, San Antonio, TX 78253
MLS# 1970517Listed by: KELLER WILLIAMS HERITAGE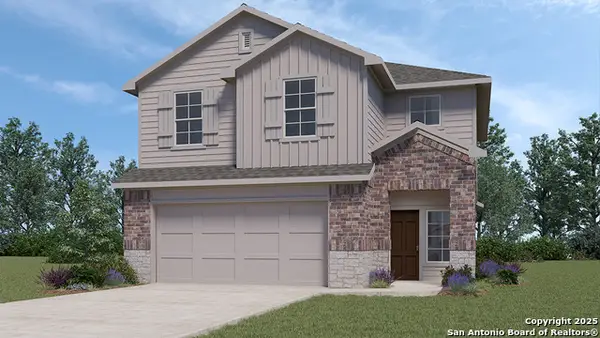 $337,000Active3 beds 3 baths1,696 sq. ft.
13690 Gunnison Quartz, San Antonio, TX 78253
MLS# 1970519Listed by: KELLER WILLIAMS HERITAGE $371,500Active4 beds 3 baths2,473 sq. ft.
13694 Gunnison Quartz, San Antonio, TX 78253
MLS# 1970520Listed by: KELLER WILLIAMS HERITAGE $353,500Active4 beds 3 baths2,042 sq. ft.
13674 Gunnison Quartz, San Antonio, TX 78253
MLS# 1970525Listed by: KELLER WILLIAMS HERITAGE $385,950Active4 beds 3 baths2,034 sq. ft.
4724 Gypsum Falls, San Antonio, TX 78253
MLS# 1970474Listed by: KELLER WILLIAMS HERITAGE $366,050Active4 beds 2 baths1,901 sq. ft.
13677 Gunnison Quartz, San Antonio, TX 78253
MLS# 1970477Listed by: KELLER WILLIAMS HERITAGE $282,795Active5 beds 3 baths1,892 sq. ft.
13830 Garnet Pike Lane, San Antonio, TX 78253
MLS# 1970485Listed by: KELLER WILLIAMS HERITAGE $276,170Active4 beds 2 baths1,572 sq. ft.
13822 Garnet Pike Lane, San Antonio, TX 78253
MLS# 1970495Listed by: KELLER WILLIAMS HERITAGE $265,000Active4 beds 2 baths1,933 sq. ft.
193 Kildeer Crk, San Antonio, TX 78253
MLS# 1970438Listed by: RESI REALTY, LLC $350,000Active4 beds 3 baths2,466 sq. ft.
11823 Elijah Stapp, San Antonio, TX 78253
MLS# 1970444Listed by: FATHOM REALTY $269,000Active3 beds 2 baths1,411 sq. ft.
6127 Unakite Trail, San Antonio, TX 78253
MLS# 1970462Listed by: KELLER WILLIAMS HERITAGE $270,500Active4 beds 2 baths1,503 sq. ft.
6123 Unakite Trail, San Antonio, TX 78253
MLS# 1970463Listed by: KELLER WILLIAMS HERITAGE $290,500Active4 beds 3 baths1,839 sq. ft.
6119 Unakite Trail, San Antonio, TX 78253
MLS# 1970468Listed by: KELLER WILLIAMS HERITAGE $325,000Active4 beds 3 baths2,243 sq. ft.
6139 Unakite Trail, San Antonio, TX 78253
MLS# 1970471Listed by: KELLER WILLIAMS HERITAGE- Open Sun, 2 to 4pm
 $587,500Active4 beds 3 baths3,174 sq. ft.
3318 Calhoun Cove, San Antonio, TX 78253
MLS# 1970416Listed by: REALTY ONE GROUP EMERALD  $520,000Active4 beds 3 baths2,550 sq. ft.
12023 Upton Park, San Antonio, TX 78253
MLS# 1970425Listed by: REALTY ADVANTAGE $339,990Active3 beds 2 baths1,454 sq. ft.
141 Desert Cactus, San Antonio, TX 78253
MLS# 1970246Listed by: EXP REALTY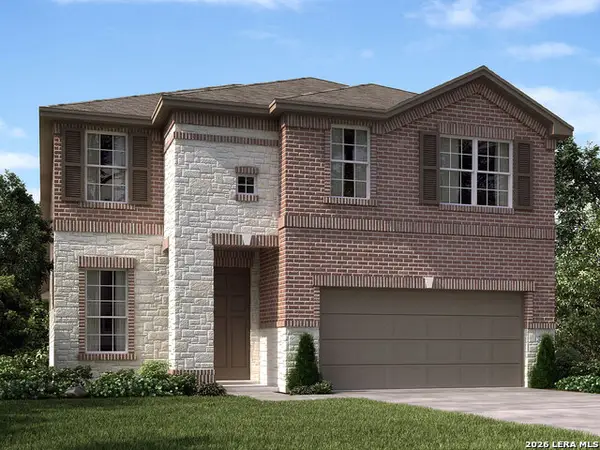 $414,990Active4 beds 3 baths2,833 sq. ft.
5555 Ennis Trace, San Antonio, TX 78253
MLS# 1970258Listed by: MERITAGE HOMES REALTY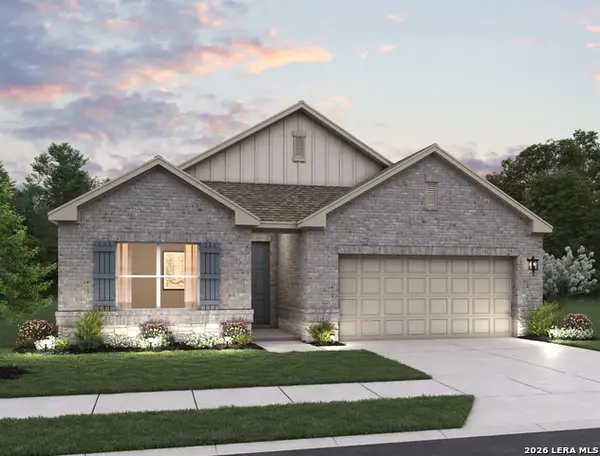 $389,990Active4 beds 3 baths2,096 sq. ft.
131 Desert Cactus, San Antonio, TX 78253
MLS# 1970264Listed by: EXP REALTY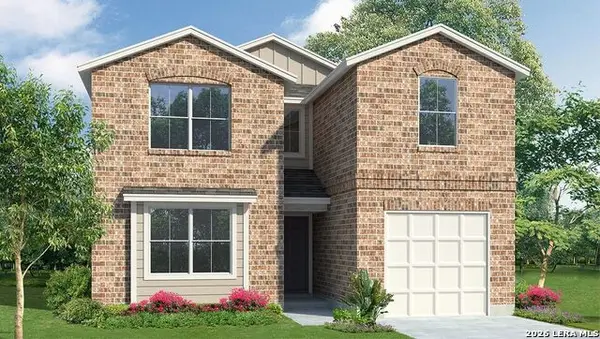 $319,000Active4 beds 3 baths2,530 sq. ft.
109 Purple Carib, San Antonio, TX 78253
MLS# 1970197Listed by: KELLER WILLIAMS HERITAGE $266,000Active3 beds 2 baths1,411 sq. ft.
119 Purple Carib, San Antonio, TX 78253
MLS# 1970200Listed by: KELLER WILLIAMS HERITAGE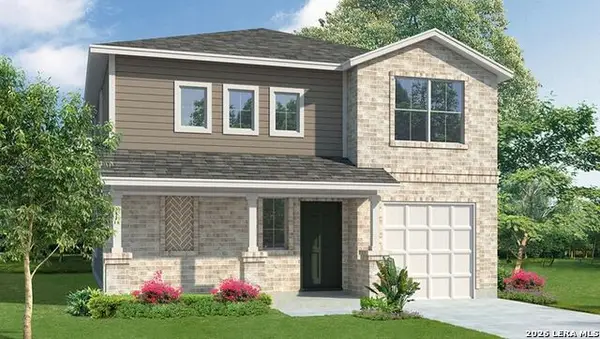 $302,500Active4 beds 3 baths2,243 sq. ft.
141 Purple Carib, San Antonio, TX 78253
MLS# 1970204Listed by: KELLER WILLIAMS HERITAGE $269,795Active5 beds 3 baths1,892 sq. ft.
15402 Ruby Hummingbird, San Antonio, TX 78253
MLS# 1970207Listed by: KELLER WILLIAMS HERITAGE $510,000Active4 beds 4 baths3,731 sq. ft.
13043 Gordons Mott, San Antonio, TX 78253
MLS# 1970169Listed by: BRASWELL REALTY $354,090Active4 beds 3 baths2,012 sq. ft.
15610 Doublecreek Drive, San Antonio, TX 78253
MLS# 1970153Listed by: EXP REALTY $263,950Active3 beds 3 baths1,470 sq. ft.
5311 Fannin Crane, San Antonio, TX 78245
MLS# 1970154Listed by: KELLER WILLIAMS HERITAGE $383,290Active5 beds 3 baths2,563 sq. ft.
15617 Doublecreek Drive, San Antonio, TX 78253
MLS# 1970134Listed by: EXP REALTY $345,290Active4 beds 3 baths1,956 sq. ft.
15569 Doublecreek Drive, San Antonio, TX 78253
MLS# 1970104Listed by: EXP REALTY $351,390Active4 beds 3 baths2,006 sq. ft.
15607 Doublecreek Drive, San Antonio, TX 78253
MLS# 1970109Listed by: EXP REALTY $350,000Active5 beds 2 baths2,538 sq. ft.
4119 Ijolite Ave, San Antonio, TX 78253
MLS# 1970110Listed by: BEYCOME BROKERAGE REALTY LLC $260,749Active4 beds 2 baths1,600 sq. ft.
13926 Axis Pass, San Antonio, TX 78253
MLS# 1970076Listed by: MARTI REALTY GROUP $213,749Pending3 beds 2 baths1,266 sq. ft.
13930 Axis Pass, San Antonio, TX 78253
MLS# 1970077Listed by: MARTI REALTY GROUP $252,749Active4 beds 3 baths1,867 sq. ft.
13934 Axis Pass, San Antonio, TX 78253
MLS# 1970078Listed by: MARTI REALTY GROUP $257,999Active4 beds 2 baths1,575 sq. ft.
6118 Smiley Blvd, San Antonio, TX 78253
MLS# 1970083Listed by: MARTI REALTY GROUP $306,999Active4 beds 3 baths1,802 sq. ft.
6463 Velma Path, San Antonio, TX 78253
MLS# 1970084Listed by: MARTI REALTY GROUP $885,000Active3 beds 5 baths3,943 sq. ft.
13439 Sunnyview Trail, San Antonio, TX 78253
MLS# 1969985Listed by: REAL BROKER, LLC- Open Sat, 9am to 6pm
 $315,000Active4 beds 3 baths2,024 sq. ft.
14963 Taradeau, San Antonio, TX 78254
MLS# 1970012Listed by: MARTI REALTY GROUP - Open Sat, 9am to 6pm
 $310,000Active3 beds 2 baths1,634 sq. ft.
14971 Taradeau, San Antonio, TX 78254
MLS# 1970013Listed by: MARTI REALTY GROUP - Open Sat, 9am to 6pm
 $360,000Active5 beds 3 baths2,552 sq. ft.
14949 Taradeau, San Antonio, TX 78254
MLS# 1970015Listed by: MARTI REALTY GROUP  $310,000Active3 beds 2 baths1,904 sq. ft.
14967 Taradeau, San Antonio, TX 78254
MLS# 1970017Listed by: MARTI REALTY GROUP $437,990Active4 beds 4 baths2,563 sq. ft.
12719 Patras Point, San Antonio, TX 78245
MLS# 1970021Listed by: MERITAGE HOMES REALTY- Open Sat, 11am to 5pm
 $232,465Active3 beds 3 baths1,676 sq. ft.
7526 Fishbowl Lane, San Antonio, TX 78253
MLS# 1969922Listed by: SATEX PROPERTIES, INC.  $270,947Active3 beds 2 baths1,888 sq. ft.
7724 Mountaineer Way, San Antonio, TX 78253
MLS# 1969924Listed by: SATEX PROPERTIES, INC. $349,999Active3 beds 2 baths1,873 sq. ft.
11519 Sangria, San Antonio, TX 78253
MLS# 1969917Listed by: EXP REALTY $214,625Active3 beds 3 baths1,676 sq. ft.
7570 Fishbowl Lane, San Antonio, TX 78253
MLS# 1969918Listed by: SATEX PROPERTIES, INC.- Open Sat, 11am to 5pm
 $219,780Active3 beds 3 baths1,389 sq. ft.
7632 Fishbowl Lane, San Antonio, TX 78253
MLS# 1969883Listed by: SATEX PROPERTIES, INC. 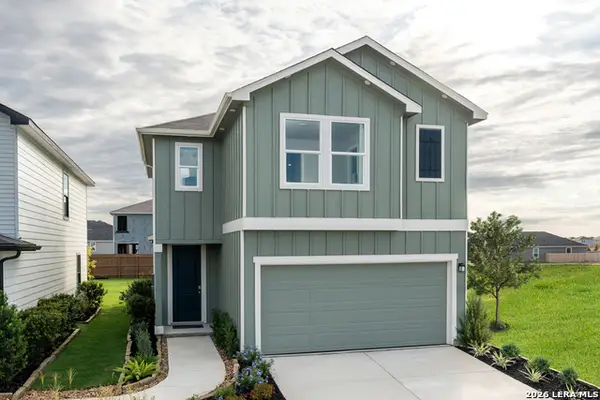 $258,074Pending3 beds 3 baths1,676 sq. ft.
7628 Fishbowl Lane, San Antonio, TX 78253
MLS# 1969886Listed by: SATEX PROPERTIES, INC.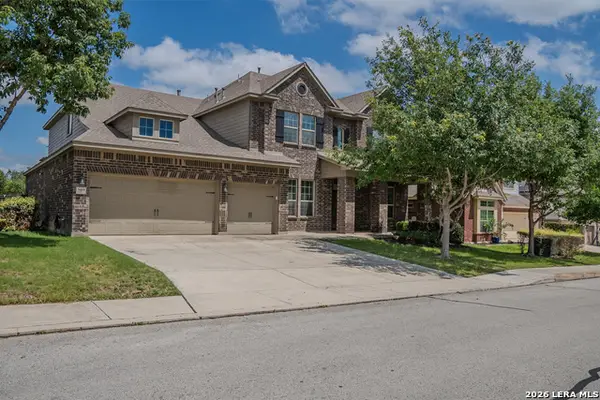 $630,000Active6 beds 4 baths4,339 sq. ft.
3419 Cherokee Cove, San Antonio, TX 78253
MLS# 1969729Listed by: 1ST CHOICE REALTY GROUP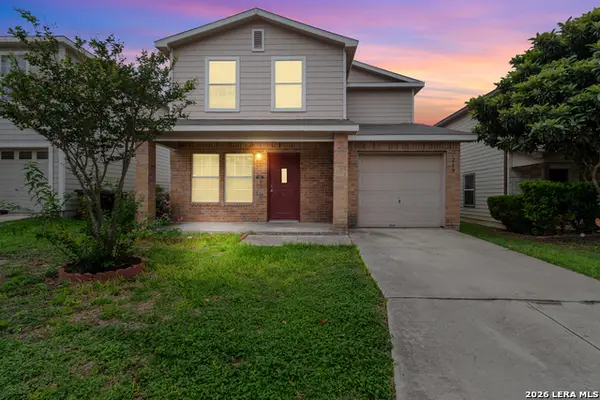 $210,000Pending4 beds 3 baths2,054 sq. ft.
203 Mallow Grove, San Antonio, TX 78253
MLS# 1969743Listed by: EXQUISITE PROPERTIES, LLC $495,900Active4 beds 3 baths2,373 sq. ft.
2043 Dalhart, San Antonio, TX 78253
MLS# 1969618Listed by: BHHS PENFED REALTY $399,000Active4 beds 3 baths2,712 sq. ft.
14002 Bella Donna, San Antonio, TX 78253
MLS# 1961855Listed by: KEEPING IT REALTY $235,000Active3 beds 2 baths1,385 sq. ft.
13263 Frogs Leap, San Antonio, TX 78253
MLS# 1969583Listed by: REAL BROKER, LLC $374,990Active4 beds 3 baths2,701 sq. ft.
5509 Calaveras Way, San Antonio, TX 78253
MLS# 1969526Listed by: REDBIRD REALTY LLC $299,900Active4 beds 3 baths2,032 sq. ft.
14111 Guadalupe, San Antonio, TX 78253
MLS# 1969525Listed by: REAL ESTATE AMIGO
 $425,000Active3 beds 3 baths2,177 sq. ft.
12904 Great Sphinx, San Antonio, TX 78253
MLS# 1969489Listed by: CENTURY 21 SCOTT MYERS, REALTORS $309,990Active3 beds 2 baths1,495 sq. ft.
13722 Guajillo Spring, San Antonio, TX 78253
MLS# 1969291Listed by: ESCAPE REALTY $190,000Pending3 beds 3 baths1,723 sq. ft.
12123 Netherwood Ln, San Antonio, TX 78253
MLS# 1969293Listed by: PROPERTIES BY MAYKIN, INC. $403,400Active4 beds 3 baths3,140 sq. ft.
13103 Cakebread, San Antonio, TX 78253
MLS# 1969326Listed by: XSELLENCE REALTY $339,990Active4 beds 3 baths2,152 sq. ft.
13726 Guajillo Spring, San Antonio, TX 78253
MLS# 1969285Listed by: ESCAPE REALTY $349,955Active4 beds 3 baths3,288 sq. ft.
822 Empresario Dr, San Antonio, TX 78253
MLS# 1969172Listed by: SOMEDAY REALTY & PROPERTY MGMT $425,000Active4 beds 4 baths3,649 sq. ft.
303 Rose Spoonbill, San Antonio, TX 78253
MLS# 1969110Listed by: REAL BROKER, LLC $219,900Active3 beds 2 baths1,450 sq. ft.
5430 Daphne Path, San Antonio, TX 78253
MLS# 1969101Listed by: ENTERA REALTY LLC $290,000Active3 beds 2 baths1,393 sq. ft.
4911 Sky Oaks, San Antonio, TX 78253
MLS# 1969076Listed by: COLDWELL BANKER D'ANN HARPER $345,000Active4 beds 3 baths2,664 sq. ft.
6527 Tulia Way, San Antonio, TX 78253
MLS# 1969078Listed by: 1ST CHOICE REALTY GROUP $260,000Active3 beds 2 baths1,436 sq. ft.
15251 Field Sparrow, San Antonio, TX 78253
MLS# 1969088Listed by: G PARTNERS & REALTY $335,000Active4 beds 3 baths2,537 sq. ft.
8427 Cedar Meadows, San Antonio, TX 78254
MLS# 1968987Listed by: XSELLENCE REALTY $219,900Active3 beds 2 baths1,450 sq. ft.
5446 Daphne Path, San Antonio, TX 78253
MLS# 1969011Listed by: ENTERA REALTY LLC $209,900Active3 beds 2 baths1,276 sq. ft.
5450 Daphne Path, San Antonio, TX 78253
MLS# 1969043Listed by: ENTERA REALTY LLC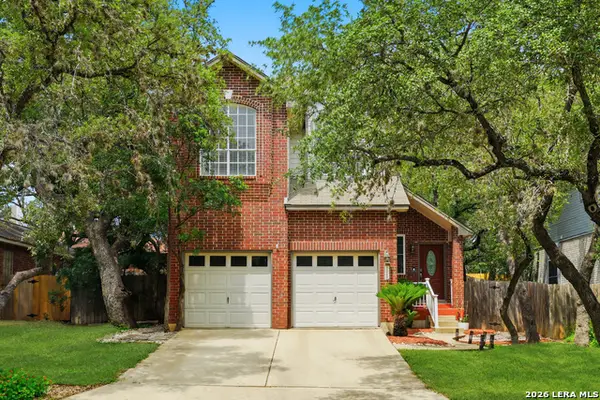 $249,900Pending3 beds 3 baths1,589 sq. ft.
11650 Foxford, San Antonio, TX 78253
MLS# 1969051Listed by: KELLER WILLIAMS HERITAGE $334,888Active4 beds 3 baths2,067 sq. ft.
11842 Adriana Maria, San Antonio, TX 78253
MLS# 1968862Listed by: EXP REALTY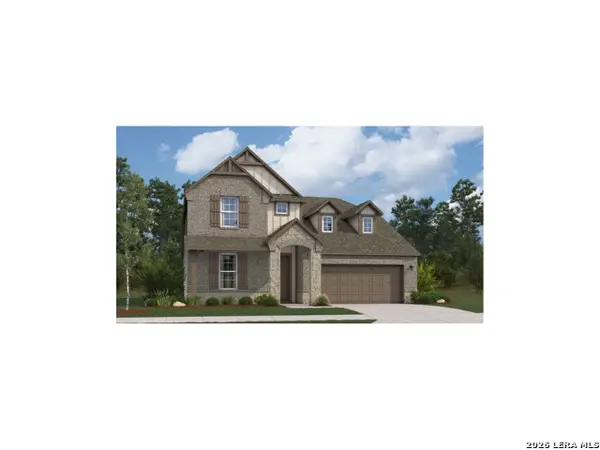 $414,479Active4 beds 3 baths2,563 sq. ft.
6422 Monarch Trace, San Antonio, TX 78253
MLS# 1968889Listed by: EXP REALTY $384,999Active4 beds 3 baths2,249 sq. ft.
6418 Monarch Trace, San Antonio, TX 78253
MLS# 1968942Listed by: EXP REALTY $379,990Active5 beds 4 baths2,511 sq. ft.
15423 Lonehollow Lake, San Antonio, TX 78253
MLS# 1968960Listed by: EXP REALTY $423,900Active5 beds 4 baths2,704 sq. ft.
13926 Westbury Falls, San Antonio, TX 78253
MLS# 1968759Listed by: KELLER WILLIAMS HERITAGE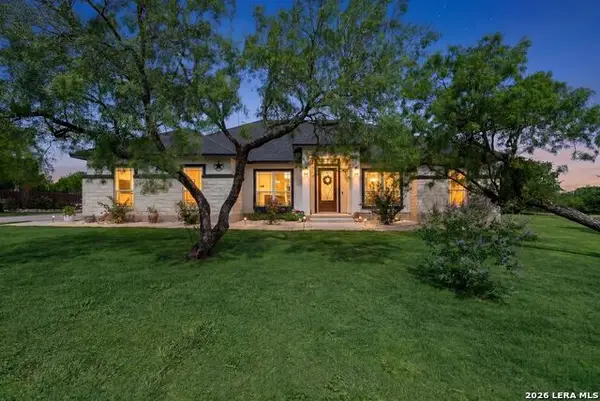 $475,000Pending4 beds 3 baths2,196 sq. ft.
110 Cr 3829, San Antonio, TX 78253
MLS# 1968770Listed by: EXP REALTY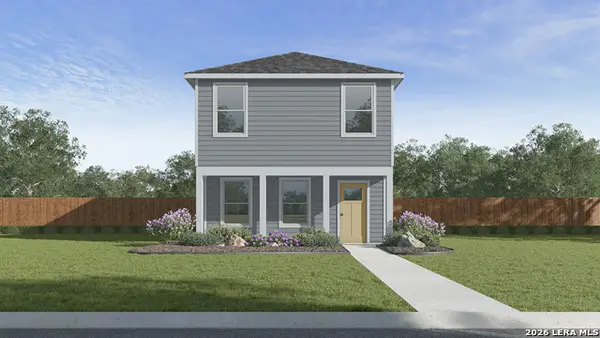 $209,260Active3 beds 2 baths1,206 sq. ft.
15003 Pink Quill, San Antonio, TX 78221
MLS# 1968781Listed by: KELLER WILLIAMS HERITAGE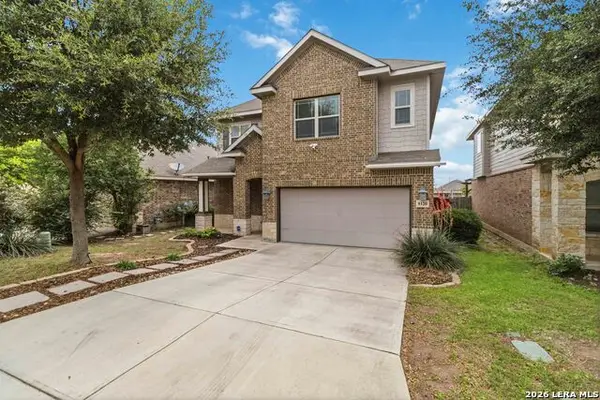 $335,000Active4 beds 3 baths2,163 sq. ft.
8120 Dublin Frst, San Antonio, TX 78253
MLS# 1968787Listed by: BHHS DON JOHNSON REALTORS - SA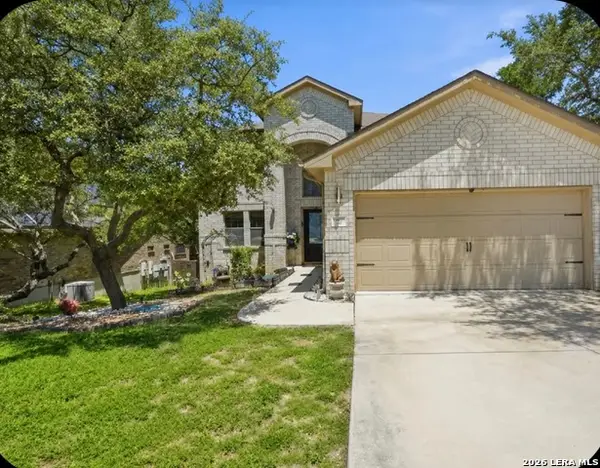 $438,500Active4 beds 3 baths2,795 sq. ft.
11819 Camp Real, San Antonio, TX 78253
MLS# 1968796Listed by: EXP REALTY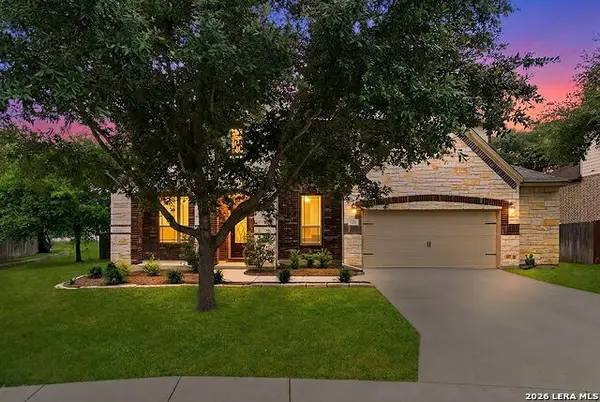 $500,000Pending5 beds 4 baths4,033 sq. ft.
5211 Anemone, San Antonio, TX 78253
MLS# 1956603Listed by: COLDWELL BANKER D'ANN HARPER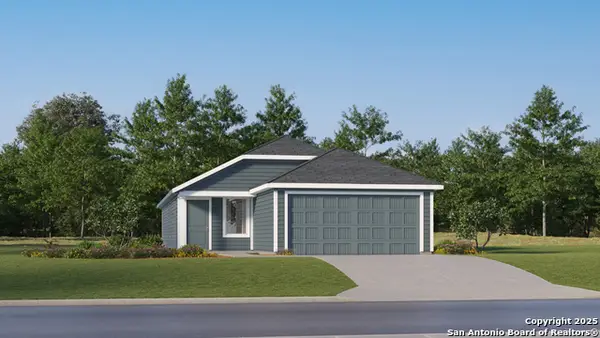 $241,749Active4 beds 2 baths1,575 sq. ft.
13922 Axis Pass, San Antonio, TX 78253
MLS# 1968695Listed by: MARTI REALTY GROUP $232,499Active4 beds 2 baths1,575 sq. ft.
5244 Whirling Place, San Antonio, TX 78253
MLS# 1968697Listed by: MARTI REALTY GROUP $209,499Active3 beds 2 baths1,266 sq. ft.
1011 Landon Ridge, San Antonio, TX 78253
MLS# 1968701Listed by: MARTI REALTY GROUP $269,990Active3 beds 2 baths1,412 sq. ft.
7519 Cottontail Cliff, San Antonio, TX 78253
MLS# 1968647Listed by: CA & COMPANY, REALTORS $325,000Active3 beds 2 baths1,651 sq. ft.
4714 Greywacke Trl, San Antonio, TX 78253
MLS# 1968634Listed by: ROWAN PROPERTIES $435,000Pending3 beds 3 baths2,774 sq. ft.
12531 Lost Maples, San Antonio, TX 78253
MLS# 1968602Listed by: MORNINGSTAR REALTY $298,499Active5 beds 3 baths2,516 sq. ft.
15454 Doublecreek Dr, San Antonio, TX 78253
MLS# 1968613Listed by: MARTI REALTY GROUP $399,960Active4 beds 3 baths2,246 sq. ft.
163 Scott Square, San Antonio, TX 78245
MLS# 1968443Listed by: MOVE UP AMERICA $359,990Active5 beds 4 baths2,511 sq. ft.
12407 Spike Heights, San Antonio, TX 78245
MLS# 1968457Listed by: EXP REALTY $371,440Pending4 beds 4 baths2,271 sq. ft.
14750 Prairie Clover, San Antonio, TX 78253
MLS# 1968382Listed by: MOVE UP AMERICA $320,500Active4 beds 3 baths2,223 sq. ft.
241 Violet Sylph, San Antonio, TX 78253
MLS# 1968383Listed by: KELLER WILLIAMS HERITAGE $276,170Active4 beds 2 baths1,572 sq. ft.
13846 Garnet Pike Lane, San Antonio, TX 78253
MLS# 1968386Listed by: KELLER WILLIAMS HERITAGE $274,110Active3 beds 2 baths1,434 sq. ft.
13838 Garnet Pike Lane, San Antonio, TX 78253
MLS# 1968387Listed by: KELLER WILLIAMS HERITAGE $285,500Active4 beds 2 baths1,544 sq. ft.
289 Violet Sylph, San Antonio, TX 78253
MLS# 1968052Listed by: KELLER WILLIAMS HERITAGE $549,990Active4 beds 4 baths3,754 sq. ft.
12030 Upton Park, San Antonio, TX 78253
MLS# 1968094Listed by: KELLER WILLIAMS CITY-VIEW $280,000Active2 beds 2 baths1,393 sq. ft.
12782 Lazy Dove, San Antonio, TX 78253
MLS# 1968101Listed by: COLDWELL BANKER D'ANN HARPER $310,000Active3 beds 3 baths2,068 sq. ft.
14332 Gila Crossing, San Antonio, TX 78253
MLS# 56665570Listed by: KELLER WILLIAMS REALTY METROPOLITAN $615,000Active3 beds 3 baths2,347 sq. ft.
13445 Rocking D, San Antonio, TX 78253
MLS# 614186Listed by: C4 REAL ESTATE OF TEXAS $254,110Active3 beds 2 baths1,434 sq. ft.
1622 Great Bittern, San Antonio, TX 78253
MLS# 1968039Listed by: KELLER WILLIAMS HERITAGE $330,000Active4 beds 3 baths2,586 sq. ft.
7106 Whipsaw Pt, San Antonio, TX 78253
MLS# 1968040Listed by: EXP REALTY $275,550Active3 beds 2 baths1,411 sq. ft.
14773 Clay Ridge Run, San Antonio, TX 78253
MLS# 1968042Listed by: KELLER WILLIAMS HERITAGE $264,795Pending5 beds 3 baths1,892 sq. ft.
1626 Great Bittern, San Antonio, TX 78253
MLS# 1968029Listed by: KELLER WILLIAMS HERITAGE $310,000Active3 beds 3 baths2,013 sq. ft.
1626 Sixpence, San Antonio, TX 78253
MLS# 1968003Listed by: PREMIER HILL COUNTRY PROPERTIES $599,000Active4 beds 4 baths3,092 sq. ft.
1647 Buckner Pl, San Antonio, TX 78253
MLS# 1967987Listed by: XSELLENCE REALTY $192,999Active3 beds 2 baths1,402 sq. ft.
14423 Elijah Path, San Antonio, TX 78221
MLS# 1967925Listed by: MARTI REALTY GROUP $216,999Active4 beds 3 baths1,867 sq. ft.
14439 Elijah Path, San Antonio, TX 78221
MLS# 1967926Listed by: MARTI REALTY GROUP $228,999Active4 beds 2 baths1,600 sq. ft.
14447 Elijah Path, San Antonio, TX 78221
MLS# 1967927Listed by: MARTI REALTY GROUP $244,499Active4 beds 3 baths1,867 sq. ft.
5240 Whirling Place, San Antonio, TX 78253
MLS# 1967930Listed by: MARTI REALTY GROUP $305,000Active3 beds 3 baths1,753 sq. ft.
8223 Stoeger Path, San Antonio, TX 78253
MLS# 1967160Listed by: M. STAGERS REALTY PARTNERS $199,000Pending2 Acres
510 Ridge View Dr, San Antonio, TX 78253
MLS# 1967905Listed by: TEXAS PREMIER REALTY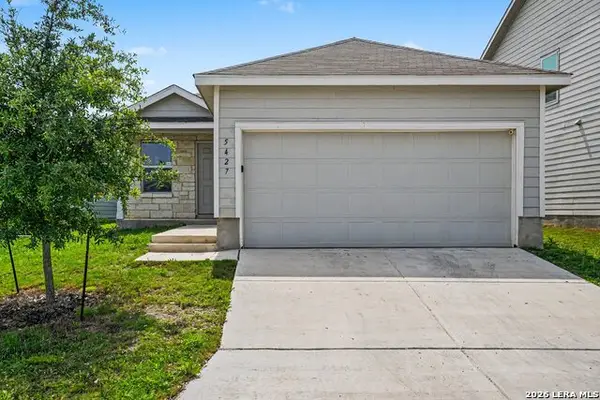 $219,900Active3 beds 2 baths1,450 sq. ft.
5427 Daphne Path, San Antonio, TX 78253
MLS# 1967815Listed by: ENTERA REALTY LLC $294,999Active4 beds 3 baths2,261 sq. ft.
14407 Elkhorn, San Antonio, TX 78253
MLS# 1967673Listed by: EXP REALTY $383,475Active5 beds 3 baths2,440 sq. ft.
13439 St Jerome Place, San Antonio, TX 78253
MLS# 1967659Listed by: LPT REALTY, LLC $929,900Active4 beds 5 baths4,583 sq. ft.
192 Sunrise Hill, Castroville, TX 78009
MLS# 1967642Listed by: KELLER WILLIAMS HERITAGE $239,900Active3 beds 3 baths1,790 sq. ft.
13726 Tramonto Hl, San Antonio, TX 78253
MLS# 1967605Listed by: WEICHERT, REALTORS - SELECT $338,038Active3 beds 3 baths2,515 sq. ft.
13211 Chanute Field Dr, San Antonio, TX 78253
MLS# 1967582Listed by: LPT REALTY, LLC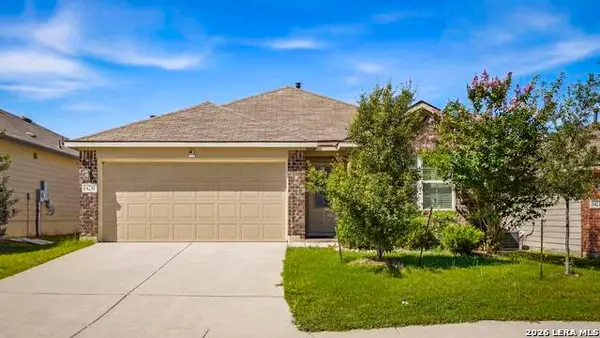 $298,000Active4 beds 2 baths1,707 sq. ft.
14230 Minette Loop, San Antonio, TX 78253
MLS# 1967572Listed by: KELLER WILLIAMS LEGACY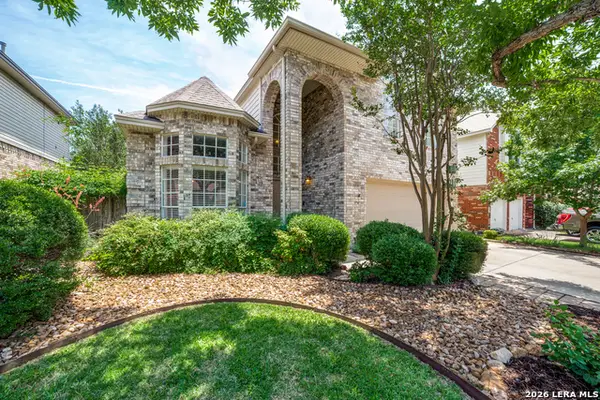 $328,500Pending4 beds 3 baths2,508 sq. ft.
1522 Mooreshill Dr, San Antonio, TX 78253
MLS# 1967512Listed by: KELLER WILLIAMS CITY-VIEW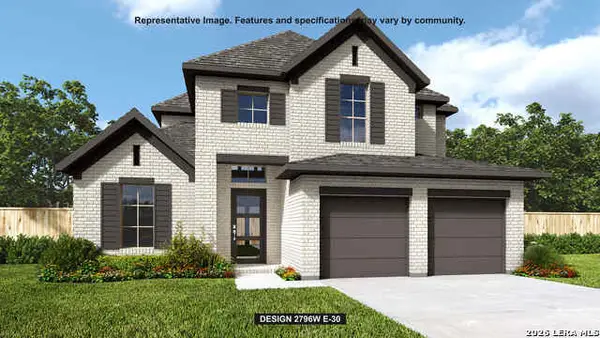 $624,900Active4 beds 5 baths3,067 sq. ft.
199 Hillside Park, San Antonio, TX 78253
MLS# 1967476Listed by: PERRY HOMES REALTY, LLC $529,000Active4 beds 4 baths3,427 sq. ft.
11334 Ivy Cadence, San Antonio, TX 78253
MLS# 1965337Listed by: KELLER WILLIAMS CITY-VIEW $366,421Active5 beds 3 baths2,515 sq. ft.
13214 Fantine Fields, San Antonio, TX 78253
MLS# 1967430Listed by: LPT REALTY, LLC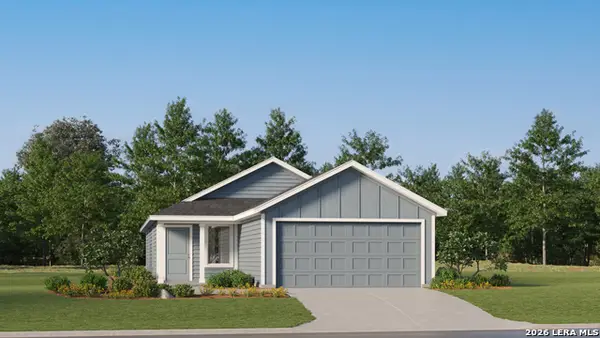 $200,499Pending3 beds 2 baths1,266 sq. ft.
14706 Trent Landing, San Antonio, TX 78253
MLS# 1967364Listed by: MARTI REALTY GROUP $198,999Pending3 beds 2 baths1,266 sq. ft.
14838 Kolbe Junction, San Antonio, TX 78253
MLS# 1967365Listed by: MARTI REALTY GROUP $275,999Active4 beds 3 baths1,788 sq. ft.
6507 Velma Path, San Antonio, TX 78253
MLS# 1967375Listed by: MARTI REALTY GROUP $262,999Active3 beds 3 baths1,650 sq. ft.
6511 Velma Path, San Antonio, TX 78253
MLS# 1967377Listed by: MARTI REALTY GROUP $236,249Pending4 beds 2 baths1,575 sq. ft.
13835 Chital Chase, San Antonio, TX 78253
MLS# 1967344Listed by: MARTI REALTY GROUP $298,500Active4 beds 2 baths2,005 sq. ft.
818 Creek Pebble, San Antonio, TX 78253
MLS# 1967353Listed by: PREMIER REALTY GROUP PLATINUM $329,000Active4 beds 3 baths2,400 sq. ft.
14638 Emerio Dr, San Antonio, TX 78253
MLS# 1967300Listed by: TOPSKY REALTY INC $314,900Active3 beds 2 baths2,069 sq. ft.
7523 Harvest Bay, San Antonio, TX 78253
MLS# 1967259Listed by: KELLER WILLIAMS LEGACY $399,999Active4 beds 3 baths2,249 sq. ft.
6410 Monarch Trace, San Antonio, TX 78253
MLS# 1967199Listed by: EXP REALTY $230,000Pending5 beds 2 baths1,984 sq. ft.
14840 N Michael Loop, San Antonio, TX 78253
MLS# 1967129Listed by: REALTY ADVANTAGE $242,000Active3 beds 2 baths1,393 sq. ft.
12718 Cedar Fly, San Antonio, TX 78253
MLS# 1966992Listed by: BHHS DON JOHNSON REALTORS - SA $389,950Active3 beds 2 baths1,877 sq. ft.
530 County Road 3822, San Antonio, TX 78253
MLS# 1967004Listed by: JOSEPH WALTER REALTY, LLC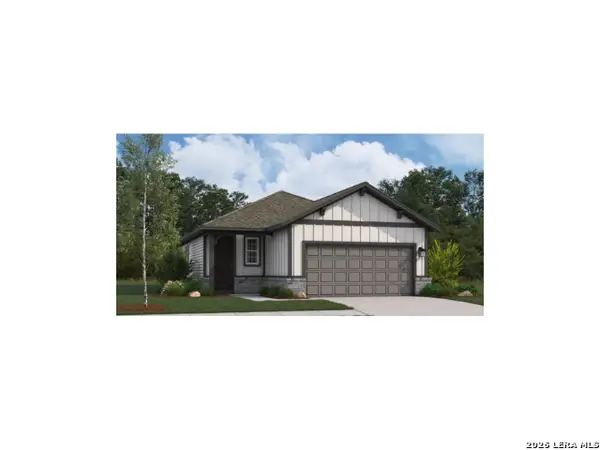 $299,999Active3 beds 3 baths1,599 sq. ft.
1517 Alsatian Ave, San Antonio, TX 78253
MLS# 1967017Listed by: EXP REALTY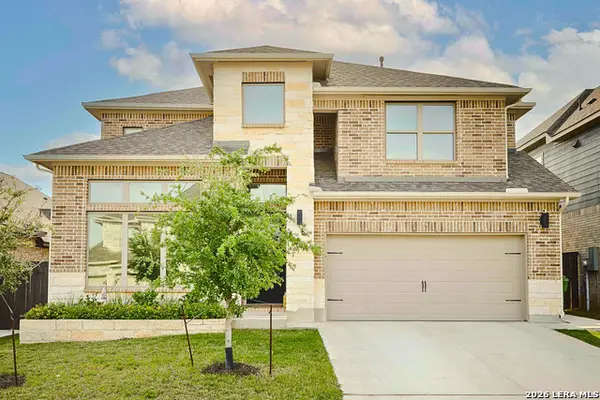 $499,999Active5 beds 5 baths3,048 sq. ft.
2027 Dalhart, San Antonio, TX 78253
MLS# 1967023Listed by: KELLER WILLIAMS HERITAGE $399,555Pending4 beds 3 baths2,019 sq. ft.
13651 Confluence Creek, San Antonio, TX 78253
MLS# 1967035Listed by: EXP REALTY $295,000Active4 beds 2 baths1,707 sq. ft.
4911 Theralite Trl, San Antonio, TX 78253
MLS# 1967044Listed by: LONG NGUYEN REALTY LLC- Open Sat, 11am to 3pm
 $349,900Active3 beds 3 baths1,907 sq. ft.
14419 Gecko Lndg, San Antonio, TX 78253
MLS# 1967053Listed by: CA & COMPANY, REALTORS 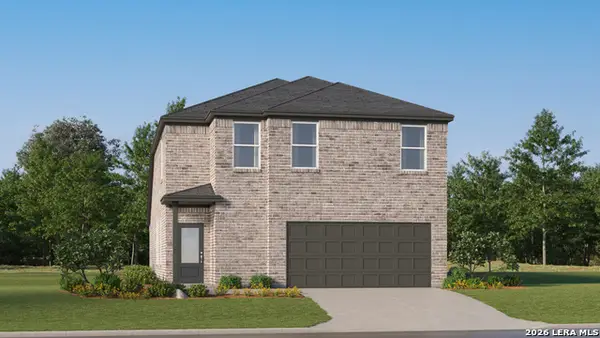 $275,499Active4 beds 4 baths2,149 sq. ft.
15502 Doublecreek Dr, San Antonio, TX 78253
MLS# 1967077Listed by: MARTI REALTY GROUP $689,000Active5 beds 4 baths3,703 sq. ft.
402 Sundance Way, San Antonio, TX 78253
MLS# 1966979Listed by: JB GOODWIN, REALTORS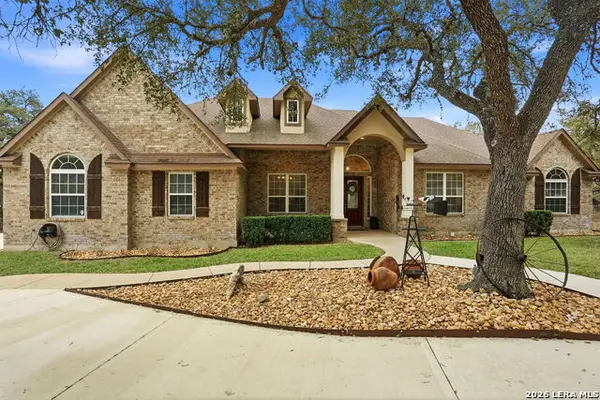 $850,000Active5 beds 3 baths3,372 sq. ft.
813 County Road 375, San Antonio, TX 78253
MLS# 1966926Listed by: KELLER WILLIAMS LEGACY $249,990Active3 beds 2 baths1,200 sq. ft.
7511 Cottontail Cliff, San Antonio, TX 78253
MLS# 1966877Listed by: CA & COMPANY, REALTORS $439,000Active4 beds 3 baths2,504 sq. ft.
6751 Velma Path, San Antonio, TX 78253
MLS# 1966880Listed by: RE-HOMING TEXAS, LLC $275,990Active3 beds 3 baths2,121 sq. ft.
7516 Cottontail Cliff, San Antonio, TX 78253
MLS# 1966881Listed by: CA & COMPANY, REALTORS $268,990Active2 beds 2 baths1,547 sq. ft.
13063 Cache Crk, San Antonio, TX 78253
MLS# 1966905Listed by: EXP REALTY $309,000Active4 beds 3 baths2,703 sq. ft.
7023 Plains Way, San Antonio, TX 78253
MLS# 1966761Listed by: LAUGHY HILGER GROUP REAL ESTATE $750,000Active4 beds 4 baths3,672 sq. ft.
208 Englewood Ln, Castroville, TX 78009
MLS# 1966817Listed by: SELECT PROPERTIES $266,500Active4 beds 2 baths1,503 sq. ft.
126 Purple Carib, San Antonio, TX 78253
MLS# 1966656Listed by: KELLER WILLIAMS HERITAGE $268,000Active3 beds 2 baths1,411 sq. ft.
170 Purple Carib, San Antonio, TX 78253
MLS# 1966661Listed by: KELLER WILLIAMS HERITAGE $261,295Active5 beds 3 baths1,892 sq. ft.
1616 Great Bittern, San Antonio, TX 78253
MLS# 1966667Listed by: KELLER WILLIAMS HERITAGE $257,170Active4 beds 2 baths1,572 sq. ft.
1612 Great Bittern, San Antonio, TX 78253
MLS# 1966669Listed by: KELLER WILLIAMS HERITAGE $500,000Active4 beds 4 baths2,886 sq. ft.
12217 Icon Rdg, San Antonio, TX 78253
MLS# 1966677Listed by: REDFIN CORPORATION $499,000Active4 beds 3 baths2,580 sq. ft.
12540 Liberty Hl, San Antonio, TX 78253
MLS# 1966701Listed by: JUST FOCUS REAL ESTATE $320,000Active4 beds 3 baths2,185 sq. ft.
1210 Reawick, San Antonio, TX 78253
MLS# 1966538Listed by: REAL BROKER, LLC $405,000Active4 beds 3 baths2,504 sq. ft.
6530 Scooby Acres, San Antonio, TX 78253
MLS# 1966461Listed by: REAL BROKER, LLC $213,995Active3 beds 2 baths1,120 sq. ft.
1035 Cozumel Emerald, San Antonio, TX 78253
MLS# 1966415Listed by: TEXAS HOME REALTY $360,000Active4 beds 3 baths2,314 sq. ft.
12418 Red Maple Way, San Antonio, TX 78253
MLS# 1962314Listed by: COLDWELL BANKER D'ANN HARPER $275,000Active3 beds 2 baths1,661 sq. ft.
7618 Asp Pt, San Antonio, TX 78253
MLS# 1966361Listed by: JPAR NEW BRAUNFELS $475,000Active4 beds 4 baths3,337 sq. ft.
12715 Canadian River, San Antonio, TX 78253
MLS# 1966389Listed by: EBBY HALLIDAY REALTORS $899,000Active4 beds 3 baths3,293 sq. ft.
1106 Private Road 3702, San Antonio, TX 78253
MLS# 2308143Listed by: THRIVE REALTY $284,950Active4 beds 3 baths1,839 sq. ft.
13938 Pease Crossing, San Antonio, TX 78253
MLS# 1966245Listed by: KELLER WILLIAMS HERITAGE $271,000Active3 beds 2 baths1,411 sq. ft.
13942 Pease Crossing, San Antonio, TX 78253
MLS# 1966246Listed by: KELLER WILLIAMS HERITAGE
Local realty services provided by:CENTURY 21 Scott Myers Realtors, CENTURY 21 Judge Fite Company, CENTURY 21 Lucky Money Real Estate, CENTURY 21 North East
Copyright 2026, Houston Realtors Information Service, Inc. All information provided is deemed reliable but is not guaranteed and should be independently verified. IDX information is provided exclusively for consumers' personal, non-commercial use, it may not be used for any purpose other than to identify prospective properties consumers may be interested in purchasing, and the data is deemed reliable but is not guaranteed accurate by the MLS.
Some properties that appear for sale on this web site may subsequently have been sold and may no longer be available. The data relating to real estate for sale on this web site comes in part from the FHAAR IDX INFO SHARE PROGRAM. Real estate listings held by brokerage firms other than CENTURY 21 North East include the name of the listing agent. Copyright 2026 FHAAR IDX INFO SHARE PROGRAM. Last Updated June 7, 2026 TX_FRAR Member Broker: Lisa Shaw
Popular searches near 78253
Popular neighborhoods near 78253
- Alamo Ranch, San Antonio homes for sale
- Bridge Wood, San Antonio homes for sale
- Briggs Ranch, San Antonio homes for sale
- Kallison Ranch, San Antonio homes for sale
- Ladera, San Antonio homes for sale
- Landon Ridge, San Antonio homes for sale
- Legacy Trails, San Antonio homes for sale
- Northwest Crossing, San Antonio homes for sale
- Oak Creek, San Antonio homes for sale
- Remuda Ranch, San Antonio homes for sale
- Stevens Ranch, San Antonio homes for sale
- Stoney Creek, San Antonio homes for sale
- Texas Research Park, San Antonio homes for sale
- The Orchard, San Antonio homes for sale
- Valley Ranch, San Antonio homes for sale
- Villages Of Westcreek, San Antonio homes for sale
- Water Wheel, San Antonio homes for sale
- Westover Hills, San Antonio homes for sale
- Westpointe East, San Antonio homes for sale
- Westpointe North, San Antonio homes for sale
Counties near San Antonio, 78253
- Atascosa County homes for sale
- Bandera County homes for sale
- Bexar County homes for sale
- Blanco County homes for sale
- Caldwell County homes for sale
- Comal County homes for sale
- Frio County homes for sale
- Gillespie County homes for sale
- Gonzales County homes for sale
- Guadalupe County homes for sale
- Hays County homes for sale
- Karnes County homes for sale
- Kendall County homes for sale
- Kerr County homes for sale
- McMullen County homes for sale
- Medina County homes for sale
- Real County homes for sale
- Uvalde County homes for sale
- Wilson County homes for sale
- Zavala County homes for sale
Protect your home and budget from life's surprises with an Assurant Home Warranty, backed by a partner that supports you through every step of homeownership. Explore Plans.
©2026 Century 21 Real Estate LLC. All rights reserved. CENTURY 21®, the CENTURY 21 Logo and C21® are service marks owned by Century 21 Real Estate LLC. Century 21 Real Estate LLC fully supports the principles of the Fair Housing Act and the Equal Opportunity Act. Each office is independently owned and operated. Listing information is deemed reliable but not guaranteed accurate.