- Austin homes for sale
- Barton Creek homes for sale
- Bee Cave homes for sale
- Belterra homes for sale
- Buda homes for sale
- Creedmoor homes for sale
- Del Valle homes for sale
- Driftwood homes for sale
- Dripping Springs homes for sale
- Kyle homes for sale
- Kyle-Buda homes for sale
- Lost Creek homes for sale
- Manchaca homes for sale
- Manchaca homes for sale
- Mustang Ridge homes for sale
- Niederwald homes for sale
- Rollingwood homes for sale
- San Leanna homes for sale
- Shady Hollow homes for sale
- West Lake Hills homes for sale
78748, TX - homes for sale
219 of 219 results displayed
- New
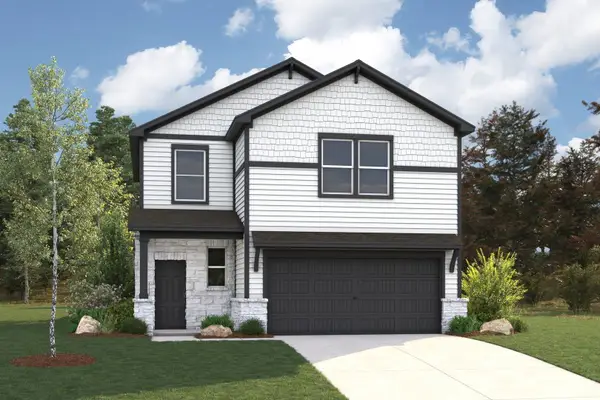
 $339,990Active4 beds 3 baths2,338 sq. ft.
12812 Kentucky Warbler Dr, Buda, TX 78610
MLS# 5397131Listed by: ERA EXPERTS - Open Sun, 12 to 2:30pmNew
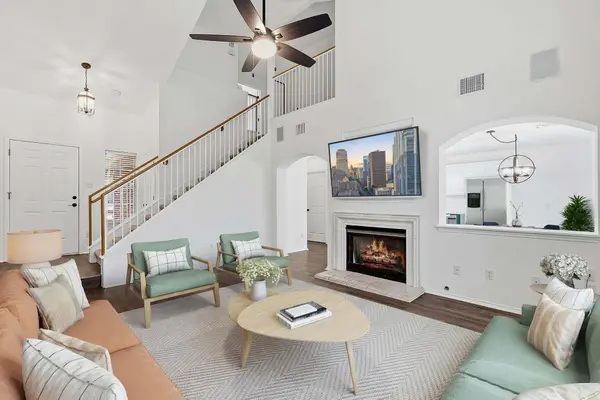
 $485,000Active4 beds 3 baths2,073 sq. ft.
1132 Brecon Ln, Austin, TX 78748
MLS# 5003161Listed by: DOUGLAS ELLIMAN REAL ESTATE - New
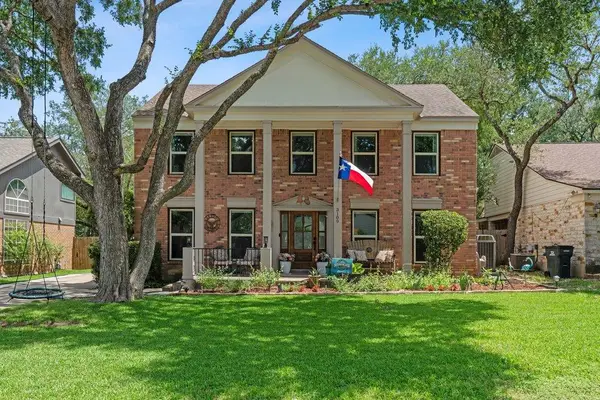
 $699,999Active6 beds 3 baths3,376 sq. ft.
10232 Grizzly Oak Dr, Austin, TX 78748
MLS# 2399753Listed by: REDFIN CORPORATION - New
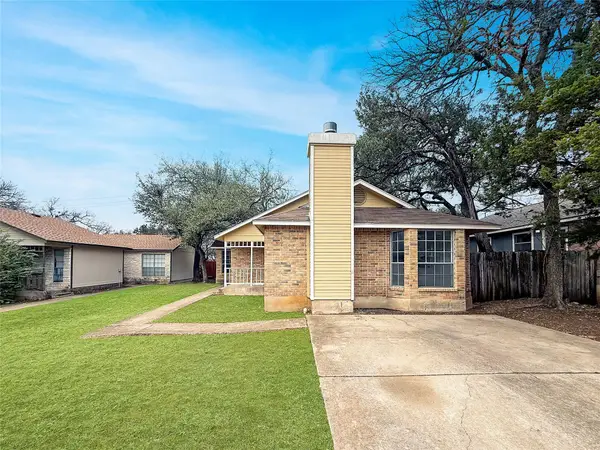
 $319,000Active3 beds 3 baths1,753 sq. ft.
1600 Airedale Rd #2601, Austin, TX 78748
MLS# 8013394Listed by: SKY REALTY - New
 $610,000Active4 beds 4 baths3,188 sq. ft.
10512 Thoroughbred Dr, Austin, TX 78748
MLS# 3668134Listed by: KELLER WILLIAMS REALTY - New
 $505,000Active4 beds 3 baths2,526 sq. ft.
329 Island Oak Dr, Austin, TX 78748
MLS# 6167863Listed by: KELLER WILLIAMS REALTY C. P. - New
 $549,900Active4 beds 3 baths2,551 sq. ft.
9725 Alex Ln, Austin, TX 78748
MLS# 2764737Listed by: ERA BROKERS CONSOLIDATED - New
 $355,000Active3 beds 3 baths1,422 sq. ft.
11322 Canterbury Tales Ln, Austin, TX 78748
MLS# 6036068Listed by: PANGAEA REALTY - Open Sat, 1 to 3pmNew
 $660,000Active4 beds 3 baths2,152 sq. ft.
3109 Festus Dr, Austin, TX 78748
MLS# 8813120Listed by: YOUNGBLOOD REAL ESTATE GROUP - New
 $350,000Active3 beds 3 baths1,422 sq. ft.
1724 Canon Yeomans Trl, Austin, TX 78748
MLS# 1380255Listed by: COMPASS RE TEXAS, LLC - New
 $644,900Active3 beds 3 baths1,906 sq. ft.
11613 Sunset Dr, Austin, TX 78748
MLS# 5325044Listed by: FARRINGTON REALTY - New
 $350,000Active1.75 Acres
915 Penion Dr, Austin, TX 78748
MLS# 6522148Listed by: COLDWELL BANKER REALTY - New
 $500,000Active4 beds 2 baths1,483 sq. ft.
8814 United Kingdom Dr, Austin, TX 78748
MLS# 5815662Listed by: EMBARK REALTY, LLC - New
 $174,900Active2 beds 1 baths932 sq. ft.
9622 Sugar Hill Dr #B, Austin, TX 78748
MLS# 7381982Listed by: LUXELY REAL ESTATE - New
 $339,000Active3 beds 2 baths1,203 sq. ft.
10716 N Platt River Dr, Austin, TX 78748
MLS# 8860970Listed by: COMPASS RE TEXAS, LLC - New
 $450,000Active3 beds 2 baths1,174 sq. ft.
9616 Holly Springs Dr, Austin, TX 78748
MLS# 3507136Listed by: KELLER WILLIAMS REALTY - New
 $499,999Active3 beds 3 baths2,106 sq. ft.
9705 Sydney Marilyn Ln, Austin, TX 78748
MLS# 2098428Listed by: CARNLEY PROPERTIES - New
 $349,900Active3 beds 3 baths1,498 sq. ft.
10501 Bilbrook Pl, Austin, TX 78748
MLS# 8068865Listed by: ALL CITY REAL ESTATE LTD. CO - Open Sun, 1 to 3pmNew
 $479,900Active3 beds 2 baths1,826 sq. ft.
2912 Lynnbrook Dr, Austin, TX 78748
MLS# 6976546Listed by: REALTY ONE GROUP PROSPER - New
 $414,365Active3 beds 2 baths1,698 sq. ft.
11016 True Valor Drive, Austin, TX 78754
MLS# 615470Listed by: HOMESUSA.COM - New
 $462,100Active5 beds 3 baths2,439 sq. ft.
11020 True Valor Dr, Austin, TX 78754
MLS# 6158161Listed by: HOMESUSA.COM - New
 $456,110Active4 beds 3 baths2,396 sq. ft.
11024 True Valor Drive, Austin, TX 78754
MLS# 615457Listed by: HOMESUSA.COM - New
 $365,000Active3 beds 3 baths1,284 sq. ft.
2656 Piping Rock Trl, Austin, TX 78748
MLS# 2359097Listed by: COMPASS RE TEXAS, LLC - New
 $439,000Active3 beds 3 baths2,146 sq. ft.
9944 Aly May Dr, Austin, TX 78748
MLS# 6834982Listed by: COLDWELL BANKER REALTY - New
 $375,000Active3 beds 3 baths1,652 sq. ft.
1305 Summoners Tale Ct, Austin, TX 78748
MLS# 7319243Listed by: MERCER STREET GROUP, LLC  $475,000Active3 beds 3 baths1,919 sq. ft.
1324 Tillerfield, Austin, TX 78748
MLS# 9042423Listed by: AUSTIN HOMES, LLC $1,175,000Active4 beds 3 baths3,254 sq. ft.
10612 Camillia Blossom Ln, Austin, TX 78748
MLS# 2944007Listed by: AUSTIN LOOP 1 REALTY, LLC $475,000Active4 beds 3 baths1,997 sq. ft.
10219 Buster Dr, Austin, TX 78748
MLS# 1931090Listed by: SPROUT REALTY $315,000Active3 beds 3 baths1,753 sq. ft.
11116 Bright Leaf Ter, Austin, TX 78748
MLS# 6829339Listed by: COMPASS RE TEXAS, LLC $329,000Active3 beds 3 baths1,753 sq. ft.
11800 Bracco Dr, Austin, TX 78748
MLS# 7224750Listed by: COMPASS RE TEXAS, LLC $395,000Active3 beds 3 baths1,886 sq. ft.
907 Sleepy Dell Ln, Austin, TX 78748
MLS# 7725873Listed by: LPT REALTY, LLC $630,000Active4 beds 3 baths1,972 sq. ft.
615 Old Manchaca Rd, Austin, TX 78748
MLS# 2556433Listed by: KNIPPA PROPERTIES $450,000Active3 beds 3 baths1,966 sq. ft.
9324 Hunter Ln, Austin, TX 78748
MLS# 3917642Listed by: LUISA MAURO REAL ESTATE $419,000Active3 beds 3 baths1,642 sq. ft.
10409 Abana Way, Austin, TX 78748
MLS# 3989278Listed by: ALL CITY REAL ESTATE LTD. CO $795,000Active5 beds 4 baths3,490 sq. ft.
11600 Arroyo Blanco Dr, Austin, TX 78748
MLS# 9565371Listed by: THE DAVIS COMPANY $395,000Active3 beds 2 baths1,346 sq. ft.
9104 Wagtail Dr, Austin, TX 78748
MLS# 8208435Listed by: KELLER WILLIAMS REALTY $545,000Active3 beds 2 baths1,528 sq. ft.
1804 Pannier Ln, Austin, TX 78748
MLS# 6367321Listed by: COMPASS RE TEXAS, LLC $475,000Active3 beds 2 baths1,580 sq. ft.
805 Angleton Cv, Austin, TX 78748
MLS# 4261974Listed by: EXP REALTY, LLC $825,000Active3 beds 3 baths1,957 sq. ft.
9313 Notches Dr, Austin, TX 78748
MLS# 3406041Listed by: EXP REALTY, LLC $440,000Active3 beds 2 baths1,736 sq. ft.
9901 Willers Way, Austin, TX 78748
MLS# 5028210Listed by: DIGGS REALTY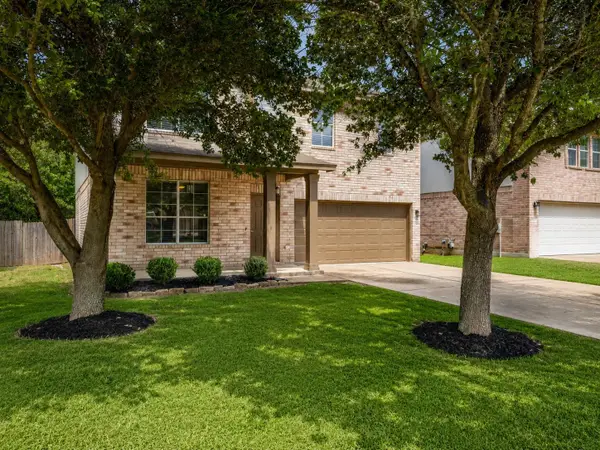 $419,000Active4 beds 3 baths1,836 sq. ft.
11816 Dave Silk Dr, Austin, TX 78748
MLS# 1552144Listed by: EXP REALTY, LLC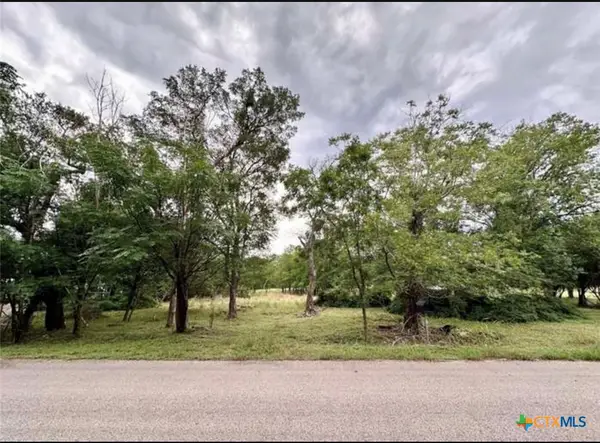 $375,000Pending1.75 Acres
911 Penion Drive, Austin, TX 78748
MLS# 614763Listed by: THE AGENTS PREMIERE REALTY GRP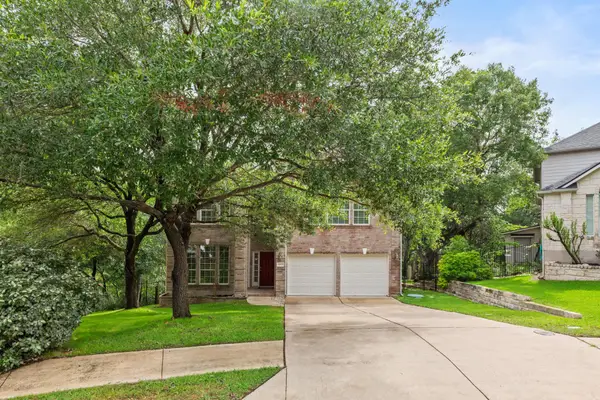 $599,000Active5 beds 3 baths3,185 sq. ft.
10801 Sea Hero Ct, Austin, TX 78748
MLS# 5057645Listed by: REAL BROKER, LLC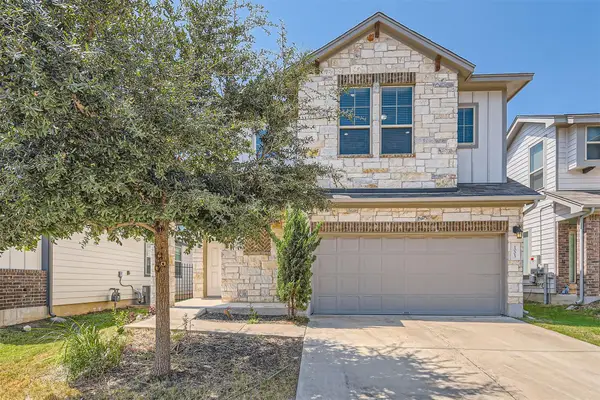 $425,000Active3 beds 3 baths1,967 sq. ft.
1005 Totis Rd, Austin, TX 78748
MLS# 1051633Listed by: EXP REALTY, LLC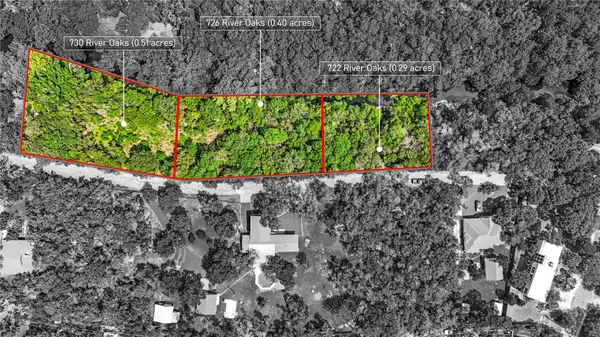 $200,000Active0.5 Acres
730 River Oaks Dr, Austin, TX 78748
MLS# 3022010Listed by: VOLT REALTY $185,000Active0.39 Acres
726 River Oaks Dr, Austin, TX 78748
MLS# 5939194Listed by: VOLT REALTY $499,000Active1.2 Acres
000000 River Oaks Drive Dr, Austin, TX 78748
MLS# 7882107Listed by: VOLT REALTY $170,000Active0.3 Acres
722 River Oaks Dr, Austin, TX 78748
MLS# 9748561Listed by: VOLT REALTY $525,000Active5 beds 3 baths2,420 sq. ft.
9204 Sawyer Fay Ln, Austin, TX 78748
MLS# 6557494Listed by: KELLER WILLIAMS REALTY $559,000Active4 beds 2 baths2,269 sq. ft.
613 Carismatic Ln, Austin, TX 78748
MLS# 7252287Listed by: KELLER WILLIAMS HERITAGE $385,000Active3 beds 3 baths1,422 sq. ft.
11313 Pardoners Tale Ln, Austin, TX 78748
MLS# 6489010Listed by: COMPASS RE TEXAS, LLC- Open Sun, 12am to 2pm
 $350,000Active3 beds 3 baths1,293 sq. ft.
10606 N Platt River Dr, Austin, TX 78748
MLS# 8258939Listed by: KELLER WILLIAMS REALTY  $540,000Active5 beds 3 baths2,515 sq. ft.
8813 Jodie Ln, Austin, TX 78748
MLS# 5774057Listed by: EXP REALTY, LLC $385,000Active4 beds 3 baths2,531 sq. ft.
11420 Midbury Ct, Austin, TX 78748
MLS# 4812129Listed by: TEXCEN REALTY- Open Sat, 12 to 3pm
 $430,000Active3 beds 3 baths1,792 sq. ft.
1320 Cedar Stand Pass, Austin, TX 78748
MLS# 4014608Listed by: EXP REALTY, LLC  $317,000Active3 beds 3 baths1,613 sq. ft.
2514 Jesse Owens Dr, Austin, TX 78748
MLS# 6349576Listed by: KELLER WILLIAMS REALTY LONE ST $429,500Active4 beds 2 baths1,561 sq. ft.
12104 Battle Bridge Dr, Austin, TX 78748
MLS# 4528787Listed by: KELLER WILLIAMS REALTY $359,000Active4 beds 2 baths1,686 sq. ft.
11201 Soules Ln #148, Manchaca, TX 78648
MLS# 8861753Listed by: RESIDENT REALTY, LTD. $325,000Active3 beds 2 baths1,038 sq. ft.
9613 Curlew Dr, Austin, TX 78748
MLS# 1339541Listed by: KELLER WILLIAMS REALTY $735,000Active3 beds 3 baths3,009 sq. ft.
13116 Bismark Dr, Austin, TX 78748
MLS# 9698381Listed by: VOLT REALTY $465,000Active4 beds 3 baths2,526 sq. ft.
11201 Blairview Ln, Austin, TX 78748
MLS# 4664118Listed by: COMPASS RE TEXAS, LLC $315,000Active2 beds 2 baths1,220 sq. ft.
12224 Tawny Farms Rd #145, Austin, TX 78748
MLS# 7429155Listed by: COMPASS RE TEXAS, LLC $425,000Active3 beds 3 baths2,132 sq. ft.
10512 Watchful Fox Dr, Austin, TX 78748
MLS# 1967423Listed by: MORELAND PROPERTIES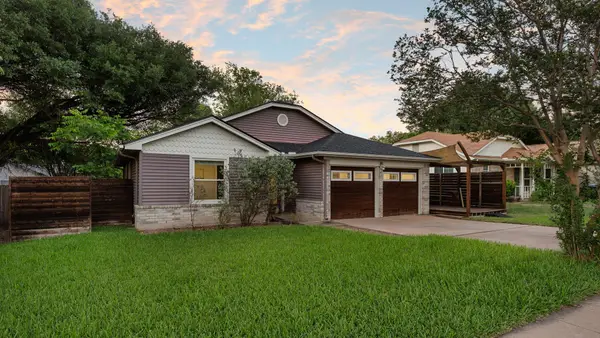 $350,000Pending3 beds 2 baths1,138 sq. ft.
720 Great Britain Blvd, Austin, TX 78748
MLS# 3578756Listed by: COMPASS RE TEXAS, LLC $340,000Active3 beds 3 baths1,687 sq. ft.
9201 Brodie Ln #1203, Austin, TX 78748
MLS# 7870884Listed by: HOMESTEAD & RANCH REAL ESTATE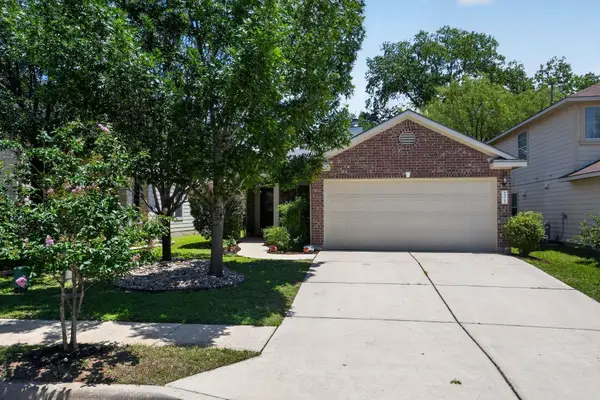 $360,000Active3 beds 2 baths1,436 sq. ft.
8521 Chick Pea Ln, Austin, TX 78748
MLS# 4148589Listed by: COMPASS RE TEXAS, LLC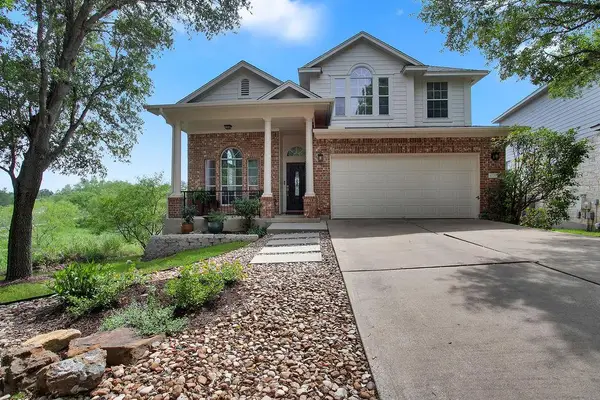 $549,900Active4 beds 3 baths2,092 sq. ft.
10720 Finsbury Dr, Austin, TX 78748
MLS# 4424076Listed by: RESIDENT REALTY, LTD. $470,000Pending4 beds 3 baths3,103 sq. ft.
12511 Morelia Way, Austin, TX 78748
MLS# 1506141Listed by: AUSTIN PROPERTY TEAM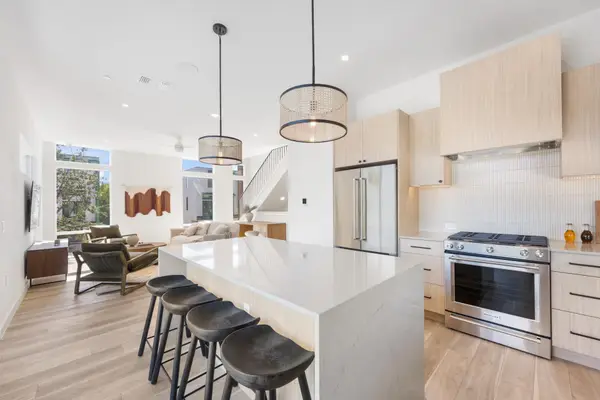 $679,000Active3 beds 4 baths1,726 sq. ft.
10821 Desert Trl #1020, Austin, TX 78758
MLS# 4032931Listed by: DOUGLAS ELLIMAN REAL ESTATE $895,000Active4 beds 4 baths3,051 sq. ft.
10516 Antelope Run, Austin, TX 78748
MLS# 1256478Listed by: THE DAVIS COMPANY $650,000Active3 beds 3 baths2,642 sq. ft.
11416 Boothill Dr, Austin, TX 78748
MLS# 4902901Listed by: THE DAVIS COMPANY $489,000Active3 beds 3 baths2,407 sq. ft.
2516 Hopsack Mills Rd, Austin, TX 78748
MLS# 9894141Listed by: COMPASS RE TEXAS, LLC $549,000Active4 beds 2 baths2,046 sq. ft.
3512 Fitzroy Ave, Austin, TX 78748
MLS# 3060879Listed by: AIR PROPERTY GROUP $488,500Active4 beds 2 baths1,826 sq. ft.
10713 Chippenhook Ct, Austin, TX 78748
MLS# 2462078Listed by: MORELAND PROPERTIES $415,000Active3 beds 3 baths1,886 sq. ft.
808 Totis Rd, Austin, TX 78748
MLS# 3263694Listed by: BRAMLETT PARTNERS $550,000Active3 beds 2 baths1,784 sq. ft.
11512 Gatling Gun Ln, Austin, TX 78748
MLS# 8416543Listed by: COMPASS RE TEXAS, LLC $460,000Active4 beds 2 baths1,517 sq. ft.
12020 Battle Bridge Dr, Austin, TX 78748
MLS# 7233014Listed by: KIFER SPARKS AGENCY, LLC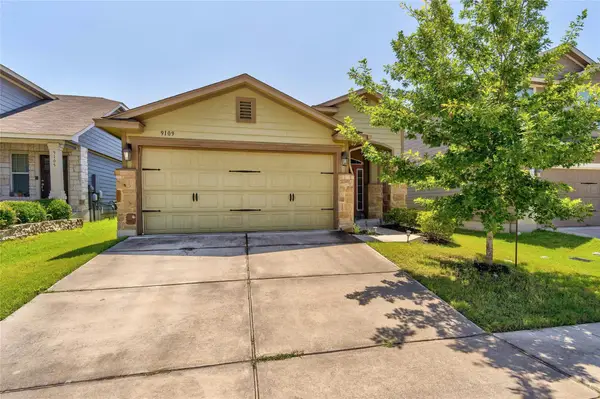 $334,500Active3 beds 2 baths1,346 sq. ft.
9109 Sweetgum Dr #161, Austin, TX 78748
MLS# 1981910Listed by: CENTRAL METRO REALTY $544,999Active4 beds 3 baths3,220 sq. ft.
10229 English Oak Dr, Austin, TX 78748
MLS# 2787862Listed by: RE/MAX FINE PROPERTIES $410,000Active3 beds 3 baths1,745 sq. ft.
2407 Wilma Rudolph Rd, Austin, TX 78748
MLS# 5233198Listed by: ATLAS REALTY $399,000Active3 beds 3 baths1,590 sq. ft.
11213 Jim Thorpe Ln, Austin, TX 78748
MLS# 3163522Listed by: MORELAND PROPERTIES $335,000Active3 beds 2 baths1,299 sq. ft.
309 Shant St, Austin, TX 78748
MLS# 5679668Listed by: KELLER WILLIAMS REALTY $316,900Active2 beds 2 baths992 sq. ft.
8754 Birmingham Dr, Austin, TX 78748
MLS# 6758766Listed by: MISSION REAL ESTATE GROUP $388,500Active3 beds 3 baths1,850 sq. ft.
1005 Cold Bear Cv, Austin, TX 78748
MLS# 9464093Listed by: TRUSTED REALTY $357,900Active3 beds 3 baths1,337 sq. ft.
10220 Bilbrook Pl, Austin, TX 78748
MLS# 3439414Listed by: ALL CITY REAL ESTATE LTD. CO $425,000Active3 beds 2 baths1,649 sq. ft.
9401 Notches Dr, Austin, TX 78748
MLS# 7249759Listed by: DEN PROPERTY GROUP $399,500Active3 beds 3 baths1,736 sq. ft.
11304 Canterbury Tales Ln, Austin, TX 78748
MLS# 7201157Listed by: ERA EXPERTS $465,000Active4 beds 2 baths2,205 sq. ft.
1404 O K Corral, Austin, TX 78748
MLS# 8151381Listed by: KELLER WILLIAMS - LAKE TRAVIS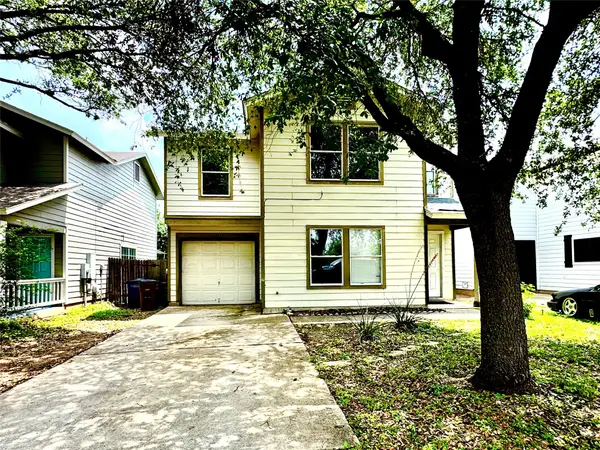 $325,000Active4 beds 3 baths1,680 sq. ft.
10341 Garbacz Dr, Austin, TX 78748
MLS# 5621434Listed by: LPT REALTY, LLC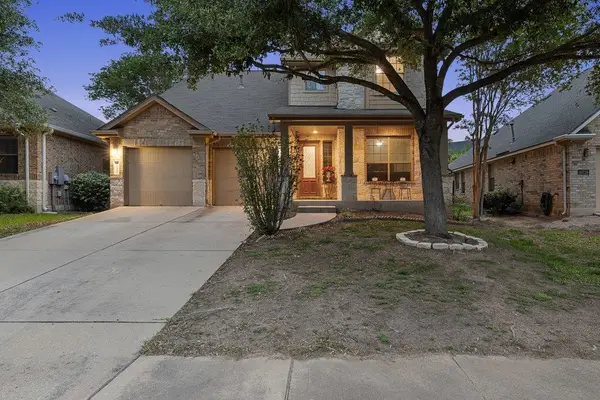 $580,000Active4 beds 4 baths3,105 sq. ft.
10800 Desert Willow Loop, Austin, TX 78748
MLS# 5403812Listed by: ALL CITY REAL ESTATE LTD. CO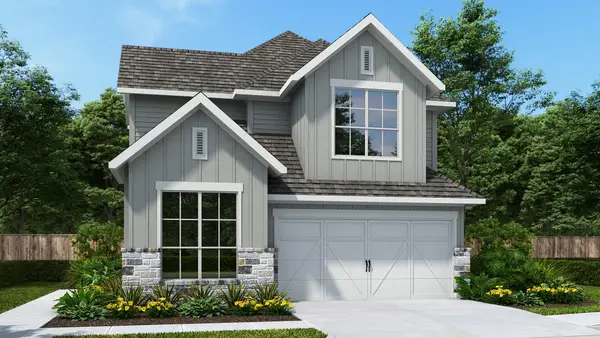 $571,900Pending5 beds 4 baths2,407 sq. ft.
8116 Peerless Pass, Austin, TX 78744
MLS# 5578113Listed by: PERRY HOMES REALTY, LLC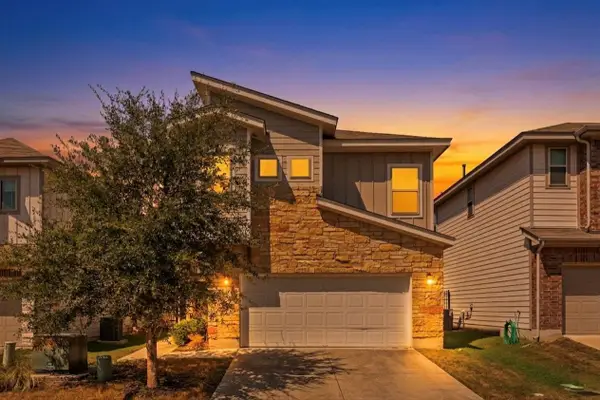 $400,000Active3 beds 3 baths1,898 sq. ft.
907 Totis Rd, Austin, TX 78748
MLS# 2406308Listed by: COLDWELL BANKER REALTY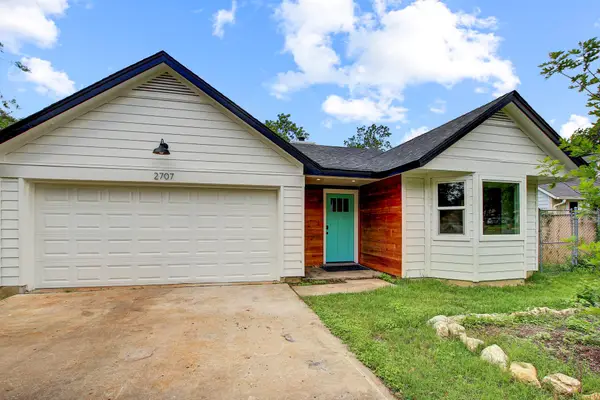 $399,000Pending3 beds 2 baths1,325 sq. ft.
2707 Firecrest Dr, Austin, TX 78748
MLS# 4255179Listed by: SPYGLASS REALTY $380,000Active3 beds 2 baths1,396 sq. ft.
8411 Romney Rd, Austin, TX 78748
MLS# 7950201Listed by: OWN TEXAS PROPERTY $420,000Active3 beds 2 baths1,530 sq. ft.
2601 Marcus Abrams Blvd, Austin, TX 78748
MLS# 9581519Listed by: EXP REALTY, LLC $935,000Active4 beds 3 baths3,292 sq. ft.
10617 Camillia Blossom Ln, Austin, TX 78748
MLS# 1677127Listed by: UNITED REAL ESTATE AUSTIN $315,000Active2 beds 1 baths795 sq. ft.
721 Fort Chadbourne Dr, Austin, TX 78748
MLS# 6842324Listed by: FATHOM REALTY $575,000Active3 beds 2 baths1,915 sq. ft.
9219 Independence Loop, Austin, TX 78748
MLS# 2595047Listed by: KELLER WILLIAMS REALTY $425,000Pending4 beds 4 baths2,268 sq. ft.
1011 Totis Rd, Austin, TX 78748
MLS# 2193203Listed by: CHRISTIES INTL REAL ESTATE LONE STAR $399,000Active4 beds 3 baths1,974 sq. ft.
11207 Canterbury Tales Ln, Austin, TX 78748
MLS# 5025826Listed by: COMPASS RE TEXAS, LLC $400,000Active3 beds 3 baths2,163 sq. ft.
1409 Kendalia St, Austin, TX 78748
MLS# 8653325Listed by: COMPASS RE TEXAS, LLC $475,000Active3 beds 2 baths1,942 sq. ft.
9312 Sydney Marilyn Ln, Austin, TX 78748
MLS# 7467412Listed by: NBC REALTY INC $825,000Active6 beds 5 baths4,494 sq. ft.
2624 Niemann Dr, Austin, TX 78748
MLS# 5944553Listed by: REDFIN CORPORATION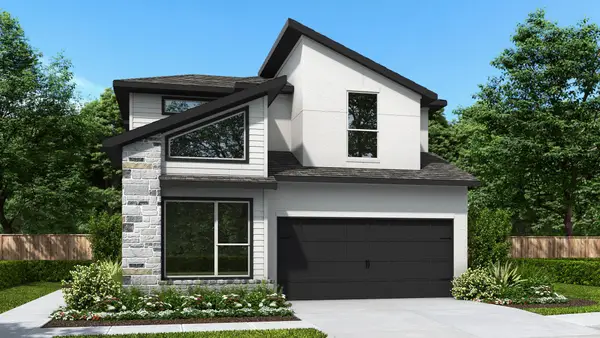 $569,900Active4 beds 4 baths2,407 sq. ft.
8109 Peerless Pass, Austin, TX 78747
MLS# 9271586Listed by: PERRY HOMES REALTY, LLC $775,000Active4 beds 3 baths2,711 sq. ft.
11115 Shady Hollow Dr, Austin, TX 78748
MLS# 5147212Listed by: YOUNGBLOOD REAL ESTATE GROUP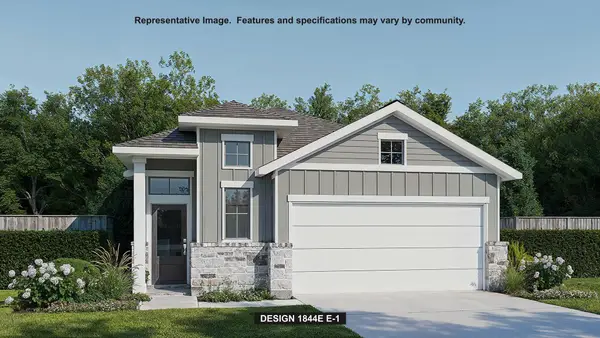 $504,900Pending4 beds 3 baths1,844 sq. ft.
8108 Peerless Pass, Austin, TX 78744
MLS# 3070349Listed by: PERRY HOMES REALTY, LLC $439,900Pending3 beds 2 baths1,341 sq. ft.
8517 Romney Rd, Austin, TX 78748
MLS# 1365528Listed by: KELLER WILLIAMS REALTY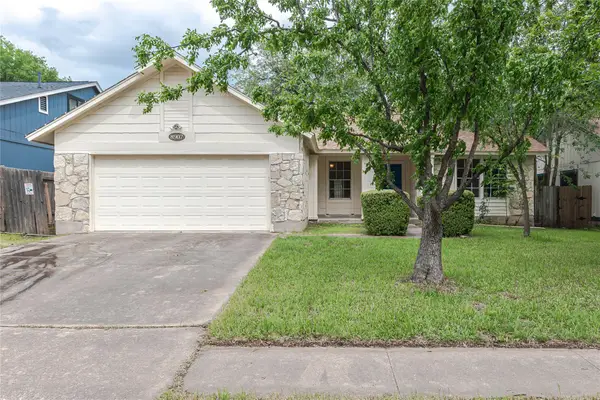 $365,000Active3 beds 2 baths1,759 sq. ft.
8907 Bill Hickcock Pass, Austin, TX 78748
MLS# 8634892Listed by: COMPASS RE TEXAS, LLC $415,000Active4 beds 3 baths2,423 sq. ft.
9400 Privet Dr, Austin, TX 78748
MLS# 8754452Listed by: SOUTH AUSTIN HOMES $344,995Active3 beds 3 baths1,422 sq. ft.
1442 Sir Thopas Trl, Austin, TX 78748
MLS# 5165980Listed by: SPYGLASS REALTY $374,990Active3 beds 3 baths1,930 sq. ft.
8922 Menchaca Rd #701, Austin, TX 78748
MLS# 1082102Listed by: METRO 512 REALTY $440,000Active4 beds 3 baths2,377 sq. ft.
2312 Marcus Abrams Blvd, Austin, TX 78748
MLS# 9797336Listed by: THE SEELY GROUP $329,000Active3 beds 2 baths1,203 sq. ft.
10600 N Platt River Dr, Austin, TX 78748
MLS# 4168537Listed by: SOLUTIONS REAL ESTATE TEXAS $520,000Active3 beds 3 baths2,075 sq. ft.
10320 Beard Ave, Austin, TX 78748
MLS# 9207299Listed by: EXP REALTY, LLC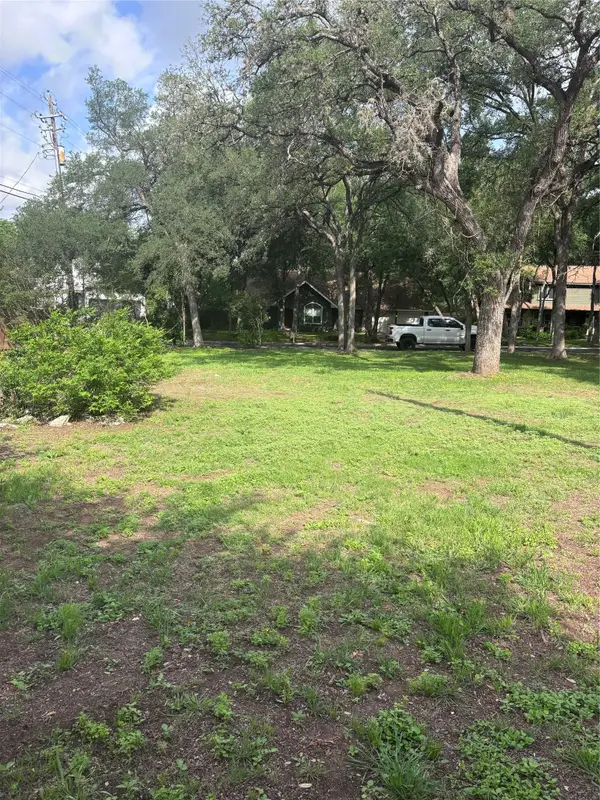 $329,500Active0.3 Acres
9505 Woodshire Dr, Austin, TX 78748
MLS# 1665581Listed by: NICE MOVE REALTY $500,000Active3 beds 3 baths2,775 sq. ft.
2524 Lavendale Ct, Austin, TX 78748
MLS# 1474097Listed by: THE DAVIS COMPANY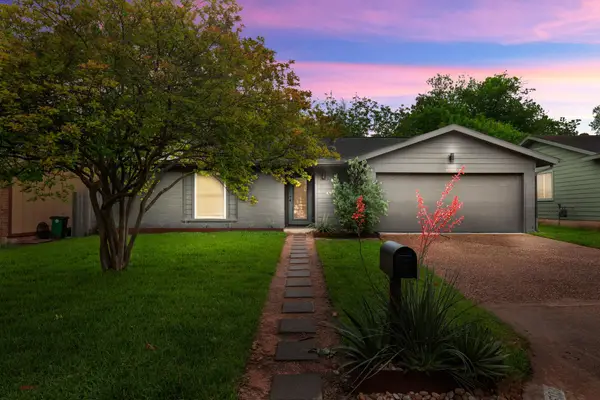 $525,000Active3 beds 2 baths1,231 sq. ft.
8503 Cornwall Dr, Austin, TX 78748
MLS# 2799972Listed by: CHRISTIES INTL REAL ESTATE LONE STAR $319,500Active3 beds 3 baths1,753 sq. ft.
1615 Airedale Rd, Austin, TX 78748
MLS# 3905280Listed by: COMPASS RE TEXAS, LLC $379,999Pending3 beds 3 baths1,711 sq. ft.
501 Shep St, Austin, TX 78748
MLS# 1132025Listed by: BLAIRFIELD REALTY LLC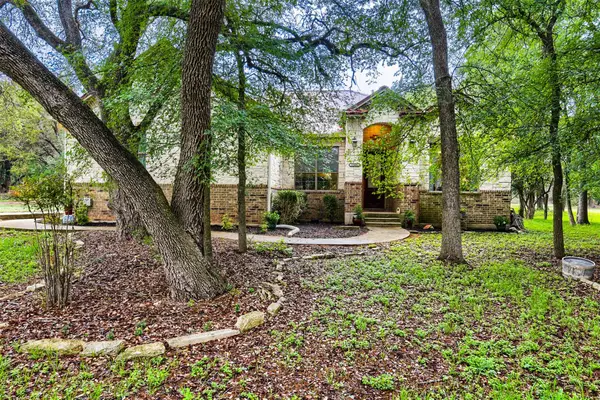 $535,000Active3 beds 3 baths1,918 sq. ft.
11600 Chapel Ln, Austin, TX 78748
MLS# 5435731Listed by: COLDWELL BANKER REALTY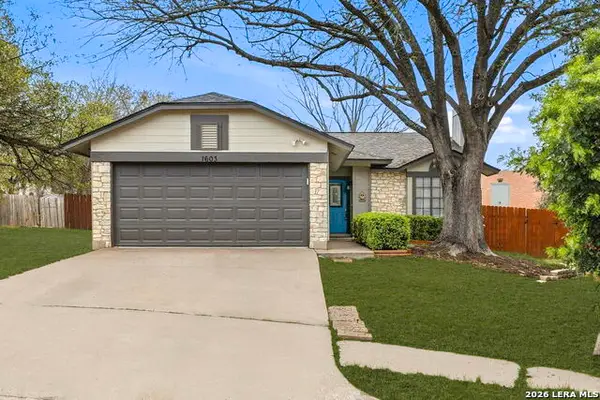 $385,000Pending3 beds 2 baths1,281 sq. ft.
1603 Cattle Cv, Austin, TX 78748
MLS# 1958135Listed by: AFFINITY REAL ESTATE BROKERAGE $775,000Active4 beds 3 baths2,037 sq. ft.
2401 Vassal Dr, Austin, TX 78748
MLS# 2043109Listed by: COMPASS RE TEXAS, LLC $599,000Active3 beds 3 baths2,757 sq. ft.
2412 Regal Park Ln, Austin, TX 78748
MLS# 7969823Listed by: MORELAND PROPERTIES $995,000Active5 beds 4 baths3,636 sq. ft.
12400 Lostwood Cir, Austin, TX 78748
MLS# 9959480Listed by: KELLER WILLIAMS REALTY $479,999Active3 beds 3 baths2,190 sq. ft.
10704 Harley Ave, Austin, TX 78748
MLS# 1858745Listed by: SKY REALTY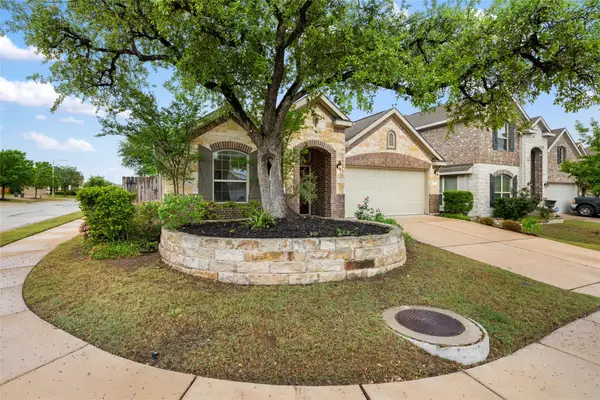 $399,000Active3 beds 2 baths1,833 sq. ft.
615 Linares Ln, Austin, TX 78748
MLS# 8697824Listed by: KELLER WILLIAMS REALTY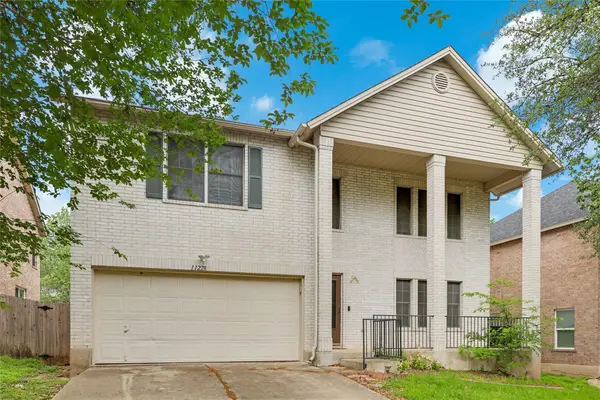 $499,990Active4 beds 3 baths3,302 sq. ft.
11228 Pickard Ln, Austin, TX 78748
MLS# 5444288Listed by: SPECTOWER REALTY GROUP $545,000Active3 beds 3 baths2,554 sq. ft.
2612 Lynnbrook Dr, Austin, TX 78748
MLS# 5497900Listed by: BRAMLETT PARTNERS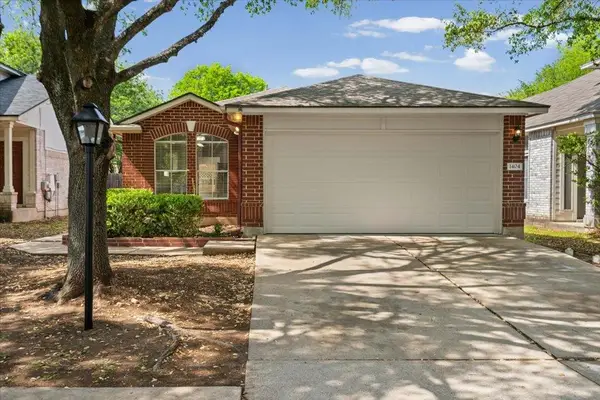 $360,000Active3 beds 2 baths1,271 sq. ft.
1404 Sir Thopas Trl, Austin, TX 78748
MLS# 8960643Listed by: WOMACK REAL ESTATE LLC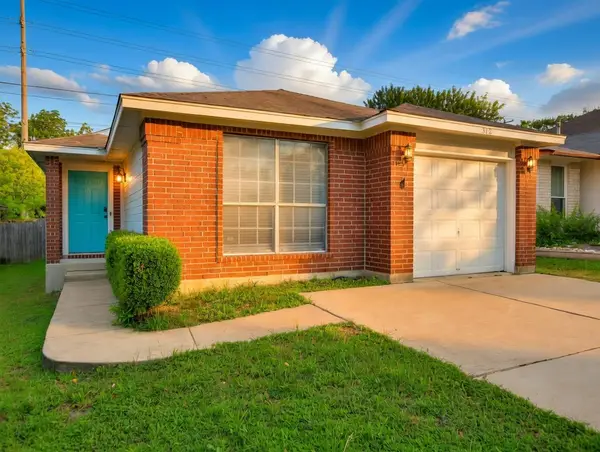 $325,000Active2 beds 2 baths1,090 sq. ft.
512 Shep St, Austin, TX 78748
MLS# 7650102Listed by: COMPASS RE TEXAS, LLC $574,900Active2 beds 2 baths1,257 sq. ft.
10706 Creek View Dr, Austin, TX 78748
MLS# 9674471Listed by: SPYGLASS REALTY $350,000Active4 beds 4 baths1,882 sq. ft.
8301 Belclaire Ln, Austin, TX 78748
MLS# 2839617Listed by: KELLER WILLIAMS REALTY $414,999Active3 beds 3 baths2,068 sq. ft.
9009 Acorn Cup Dr, Austin, TX 78748
MLS# 1590118Listed by: PAULY PRESLEY REALTY $419,900Active3 beds 3 baths1,603 sq. ft.
9257 Vigen Cir, Austin, TX 78748
MLS# 1127125Listed by: COMPASS RE TEXAS, LLC $660,000Active5 beds 3 baths3,076 sq. ft.
11500 Arbor Downs Rd, Austin, TX 78748
MLS# 8928127Listed by: ERA BROKERS CONSOLIDATED $875,000Active1.48 Acres
911 & 915 W Dittmar Rd, Austin, TX 78745
MLS# 7556800Listed by: 3RD ANGLE REALTY LLC $299,900Active3 beds 1 baths1,036 sq. ft.
8604 Dittmar Oaks Dr, Austin, TX 78748
MLS# 9004518Listed by: TEXAS REALTY MALL $475,000Active-- beds -- baths2,375 sq. ft.
2637 Alcott Ln, Austin, TX 78748
MLS# 6635696Listed by: BRAMLETT PARTNERS $685,000Active4 beds 4 baths3,248 sq. ft.
2229 Turtle Mountain Bnd, Austin, TX 78748
MLS# 6344151Listed by: COMPASS RE TEXAS, LLC $450,000Active3 beds 3 baths1,910 sq. ft.
1318 Jenkins Bnd, Austin, TX 78748
MLS# 2420684Listed by: KELLER WILLIAMS - LAKE TRAVIS $400,000Pending4 beds 3 baths2,359 sq. ft.
2121 Desco Dr, Austin, TX 78748
MLS# 1110626Listed by: MINTO REAL ESTATE $800,000Pending4 beds 3 baths2,530 sq. ft.
3405 Doe Run, Austin, TX 78748
MLS# 4352803Listed by: KELLER WILLIAMS REALTY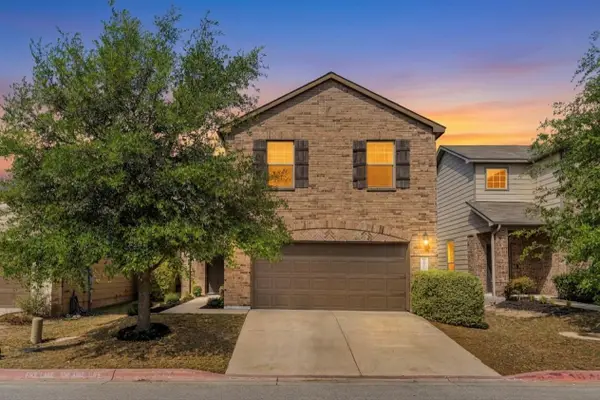 $415,000Active4 beds 3 baths2,423 sq. ft.
9406 Privet Dr #25, Austin, TX 78748
MLS# 9139140Listed by: COLDWELL BANKER REALTY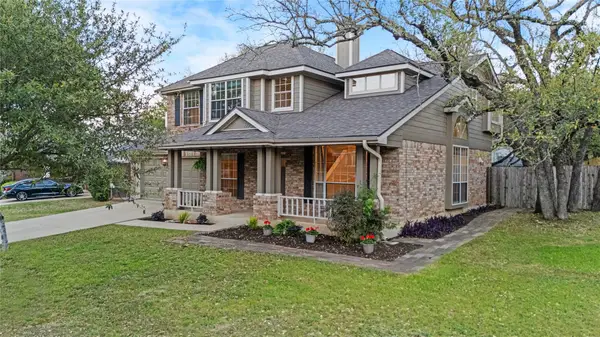 $549,995Active3 beds 3 baths1,725 sq. ft.
11021 Whiskey River Dr, Austin, TX 78748
MLS# 3451187Listed by: TEXCEN REALTY $399,500Active2 beds 3 baths1,173 sq. ft.
2420 Drew Lane #5, Austin, TX 78748
MLS# 2447835Listed by: SCHOUTEN REAL ESTATE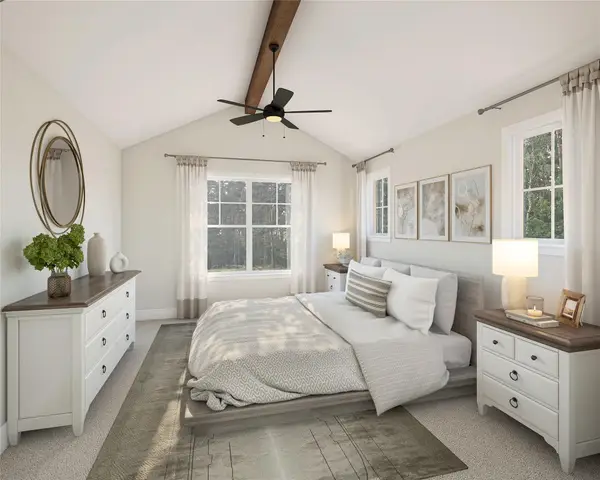 $424,000Active3 beds 3 baths1,215 sq. ft.
2414 Drew Lane #6, Austin, TX 78748
MLS# 7735924Listed by: SCHOUTEN REAL ESTATE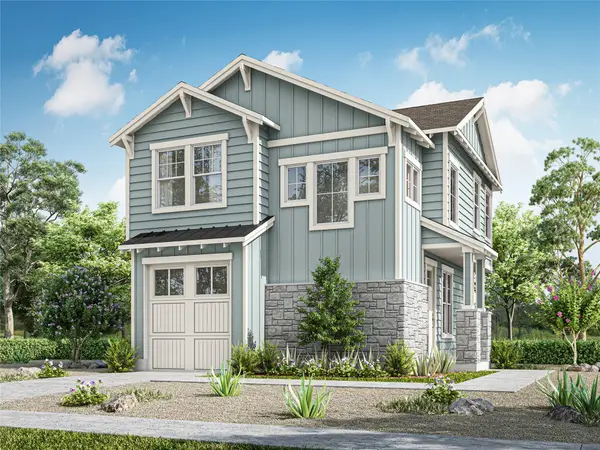 $429,000Pending2 beds 3 baths1,173 sq. ft.
2420 Drew Lane #1, Austin, TX 78748
MLS# 6748442Listed by: SCHOUTEN REAL ESTATE $499,000Active3 beds 3 baths1,945 sq. ft.
2933 Fleet Dr, Austin, TX 78748
MLS# 4341923Listed by: TWELVE RIVERS REALTY $849,000Active4 beds 3 baths2,334 sq. ft.
2403 Comburg Castle Way, Austin, TX 78748
MLS# 4841246Listed by: KUPER SOTHEBY'S INT'L REALTY $585,000Active4 beds 2 baths2,484 sq. ft.
9602 Tea Rose Trl, Austin, TX 78748
MLS# 4193652Listed by: KELLER WILLIAMS REALTY $310,000Active3 beds 2 baths1,436 sq. ft.
11301 Robert Wooding Dr, Austin, TX 78748
MLS# 1798659Listed by: KELLER WILLIAMS REALTY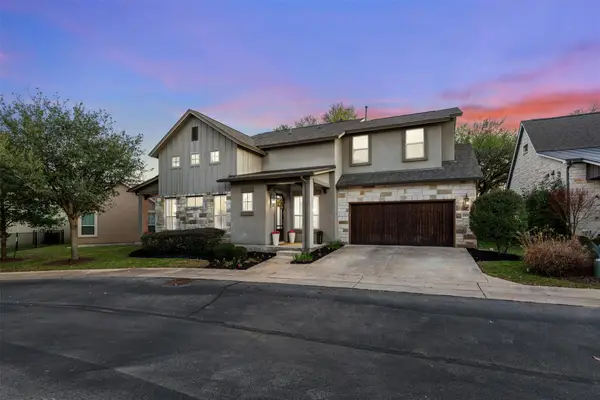 $499,000Active3 beds 3 baths2,458 sq. ft.
2505 Hopsack Mills Rd, Austin, TX 78748
MLS# 3283432Listed by: KELLER WILLIAMS REALTY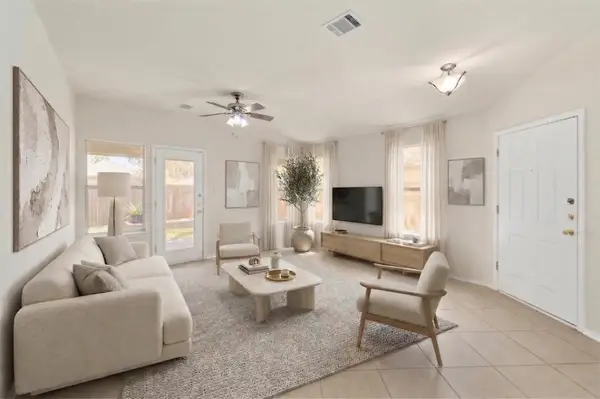 $339,000Pending3 beds 2 baths1,241 sq. ft.
8805 Francia Trl, Austin, TX 78748
MLS# 2947831Listed by: COLDWELL BANKER REALTY $570,000Active4 beds 3 baths2,556 sq. ft.
2408 Chambray Ct #38, Austin, TX 78748
MLS# 6502253Listed by: REALTY TEXAS LLC $545,000Pending3 beds 3 baths2,556 sq. ft.
2608 Barbera Pass #90, Austin, TX 78748
MLS# 7514177Listed by: REALTY TEXAS LLC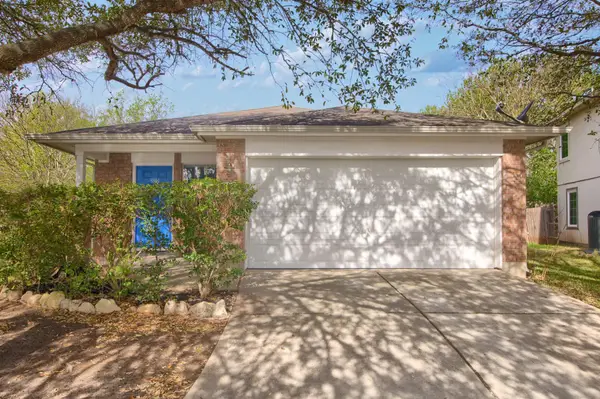 $330,000Active3 beds 2 baths1,324 sq. ft.
8804 Dittmar Oaks Dr, Austin, TX 78748
MLS# 7733344Listed by: COMPASS RE TEXAS, LLC $325,000Active4 beds 2 baths1,800 sq. ft.
12704 Bloomington Dr, Austin, TX 78748
MLS# 1178794Listed by: KELLER WILLIAMS REALTY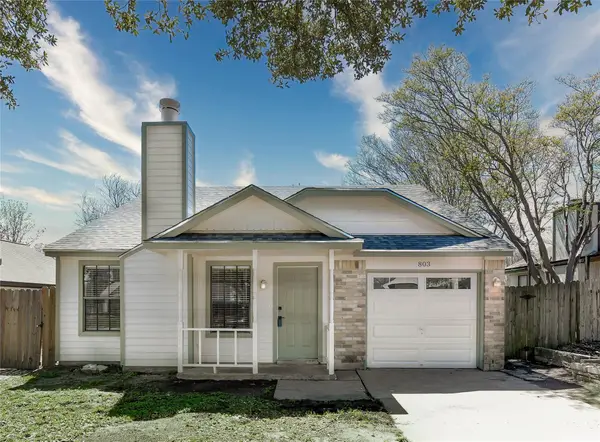 $365,000Active3 beds 2 baths1,021 sq. ft.
803 Kavanagh Dr, Austin, TX 78748
MLS# 6014704Listed by: CENTRAL REAL ESTATE GROUP $535,000Active3 beds 2 baths1,422 sq. ft.
11028 Whiskey River Dr, Austin, TX 78748
MLS# 2583597Listed by: THE DAVIS COMPANY $365,000Active3 beds 2 baths1,538 sq. ft.
2404 Christoff Loop, Austin, TX 78748
MLS# 7391263Listed by: COMPASS RE TEXAS, LLC $349,000Active3 beds 2 baths1,203 sq. ft.
10607 N Platt River Dr, Austin, TX 78748
MLS# 2516072Listed by: COMPASS RE TEXAS, LLC $545,000Pending3 beds 3 baths2,556 sq. ft.
2608 Barbera Pass, Austin, TX 78748
MLS# 607494Listed by: REALTY TEXAS LLC $390,000Active3 beds 3 baths1,550 sq. ft.
11704 Paul E Anderson Dr, Austin, TX 78748
MLS# 9923598Listed by: EXP REALTY, LLC $570,000Active4 beds 3 baths2,556 sq. ft.
2408 Chambray Court, Austin, TX 78748
MLS# 607473Listed by: REALTY TEXAS LLC $378,000Active3 beds 2 baths1,600 sq. ft.
8610 Croydon Loop, Austin, TX 78748
MLS# 4070491Listed by: EXP REALTY, LLC $389,000Active3 beds 3 baths1,418 sq. ft.
8716 Davis Oaks Trl, Austin, TX 78748
MLS# 3344179Listed by: KELLER WILLIAMS REALTY $279,000Active2 beds 2 baths904 sq. ft.
2605 Garrettson Dr #A, Austin, TX 78748
MLS# 1656049Listed by: KUPER SOTHEBY'S INT'L REALTY $599,000Active4 beds 2 baths1,542 sq. ft.
2404 Monarch Dr, Austin, TX 78748
MLS# 5745118Listed by: DOMAIN REALTY, LLC $355,000Active3 beds 2 baths1,219 sq. ft.
808 Minturn Ln, Austin, TX 78748
MLS# 9380663Listed by: KELLER WILLIAMS REALTY $174,900Active-- beds -- baths854 sq. ft.
9622 Sugar Hill Dr #A, Austin, TX 78748
MLS# 8638440Listed by: LUXELY REAL ESTATE $525,000Active3 beds 3 baths2,310 sq. ft.
2920 Lynnbrook Dr, Austin, TX 78748
MLS# 5302900Listed by: COMMUNITY IS HOME LLC $299,999Active3 beds 3 baths1,565 sq. ft.
1416 Bichon Bnd, Austin, TX 78748
MLS# 2416943Listed by: KELLER WILLIAMS REALTY $299,000Active2 beds 3 baths1,515 sq. ft.
11241 Lost Maples Trl, Austin, TX 78748
MLS# 4951721Listed by: COMPASS RE TEXAS, LLC $599,995Pending4 beds 2 baths1,868 sq. ft.
9223 Independence Loop, Austin, TX 78748
MLS# 5305687Listed by: ICON REALTY TEXAS LLC $425,000Active3 beds 3 baths1,981 sq. ft.
9940 Milla Cir #24, Austin, TX 78748
MLS# 9537484Listed by: IRON CREEK REALTY $439,000Active4 beds 3 baths1,875 sq. ft.
11116 Jim Thorpe Ln, Austin, TX 78748
MLS# 1927251Listed by: COLDWELL BANKER REALTY $355,000Active3 beds 3 baths1,591 sq. ft.
1520 Huckleberry Ln, Austin, TX 78748
MLS# 1171512Listed by: COMPASS RE TEXAS, LLC $530,000Active3 beds 2 baths1,863 sq. ft.
9409 Doliver Dr, Austin, TX 78748
MLS# 2972037Listed by: REAL ESTATE EXECUTIVES OF AUS $314,900Active2 beds 3 baths1,393 sq. ft.
9201 Brodie Ln #902, Austin, TX 78748
MLS# 6361703Listed by: ASHLEY AUSTIN HOMES $280,000Active2 beds 3 baths1,334 sq. ft.
3101 Davis Ln #8402, Austin, TX 78748
MLS# 6905753Listed by: YOUNGBLOOD REAL ESTATE GROUP- $359,900Pending-- beds -- baths1,786 sq. ft.
9624 Sugar Hill Dr #A & B, Austin, TX 78748
MLS# 7591477Listed by: BRAMLETT PARTNERS  $395,000Pending2 beds 3 baths1,173 sq. ft.
2414 Drew Ln #3, Austin, TX 78748
MLS# 1011935Listed by: SCHOUTEN REAL ESTATE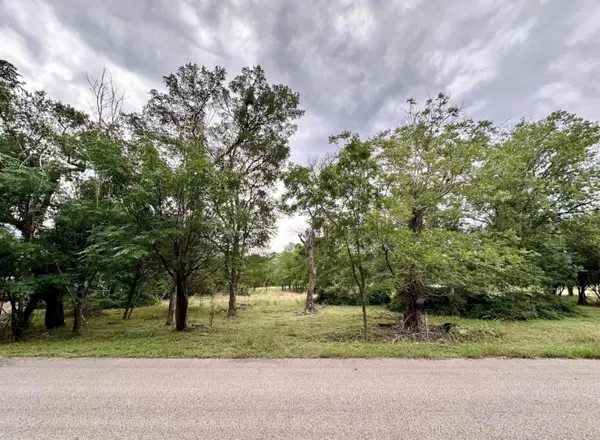 $375,000Pending1.75 Acres
911 Penion Dr, Austin, TX 78748
MLS# 4089101Listed by: THE AGENTS PREMIERE REALTY GRP $410,000Active3 beds 3 baths1,860 sq. ft.
1608 Melibee Trl, Austin, TX 78748
MLS# 7388127Listed by: FATHOM REALTY $465,000Active4 beds 3 baths2,901 sq. ft.
11112 Chatam Berry Ln, Austin, TX 78748
MLS# 8135526Listed by: CASA DULCE REALTY $770,000Active4 beds 3 baths2,686 sq. ft.
3104 Sasparilla Cv, Austin, TX 78748
MLS# 5826721Listed by: ATLAS REALTY $394,500Active3 beds 2 baths1,299 sq. ft.
9100 Wagtail Dr, Austin, TX 78748
MLS# 3283623Listed by: STANBERRY REALTORS $699,000Active-- beds -- baths3,616 sq. ft.
9509 Kempler Dr, Austin, TX 78748
MLS# 2401601Listed by: COMPASS RE TEXAS, LLC $500,000Active3 beds 3 baths1,975 sq. ft.
2609 Monarch Dr, Austin, TX 78748
MLS# 5021524Listed by: COMPASS RE TEXAS, LLC $22,500Active0.29 Acres
PROSPECT/YUCCA Prospect/yucca, Horseshoe Bay, TX 78748
MLS# 1936113Listed by: REALTY ADVANTAGE $899,000Active3 beds 3 baths2,144 sq. ft.
8904 Chisholm Ln, Austin, TX 78748
MLS# 4828032Listed by: ALL CITY REAL ESTATE LTD. CO $299,900Active2 beds 2 baths1,353 sq. ft.
9201 Brodie Ln #1501, Austin, TX 78748
MLS# 8212143Listed by: COMPASS RE TEXAS, LLC $360,000Active3 beds 2 baths1,458 sq. ft.
11407 Jim Thorpe Ln, Austin, TX 78748
MLS# 3135009Listed by: LADAY REALTY GROUP, LLC $499,990Active4 beds 2 baths1,651 sq. ft.
2311 Sheri Oak Ln, Austin, TX 78748
MLS# 2570219Listed by: THE SEELY GROUP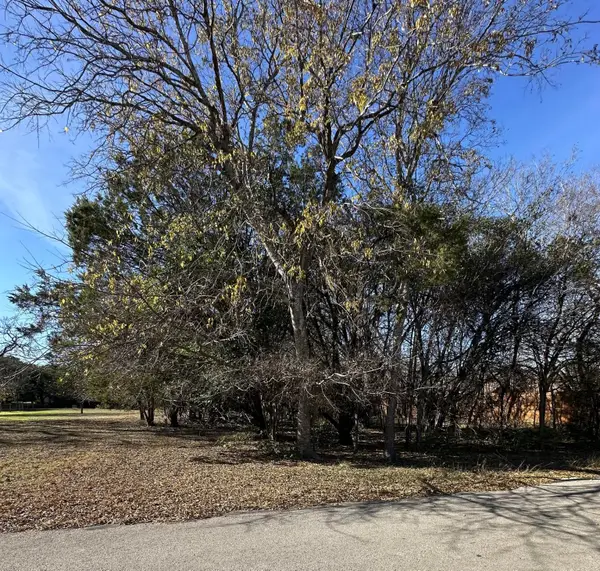 $375,000Active0.42 Acres
11302 Circle Dr, Austin, TX 78748
MLS# 9270810Listed by: VIDAURRI REALTY GROUP, INC- Open Sun, 11am to 12:30pm
 $339,500Active2 beds 2 baths1,125 sq. ft.
2408 Vintage Stave Rd #101, Austin, TX 78748
MLS# 5430700Listed by: DEN PROPERTY GROUP  $799,999Active4 beds 2 baths2,233 sq. ft.
9201 Heatherwood Dr, Austin, TX 78748
MLS# 6651322Listed by: THE FDR GROUP $360,000Active3 beds 3 baths1,707 sq. ft.
1512 Sugarberry Ln, Austin, TX 78748
MLS# 5683516Listed by: EPIQUE REALTY LLC $620,000Active-- beds -- baths3,120 sq. ft.
2304 Cedrick Cv, Austin, TX 78748
MLS# 1196829Listed by: ALLEGIANT REALTY $894,900Pending5 beds 5 baths3,715 sq. ft.
9501 Dingo Dr, Austin, TX 78744
MLS# 2556318Listed by: PERRY HOMES REALTY, LLC $275,000Active2 beds 3 baths1,391 sq. ft.
9201 Brodie Ln #2903, Austin, TX 78748
MLS# 3592121Listed by: BRADFIELD REAL ESTATE LLC $349,000Pending2 beds 3 baths1,039 sq. ft.
2420 Drew Ln #7, Austin, TX 78748
MLS# 7416434Listed by: SCHOUTEN REAL ESTATE $459,000Active4 beds 2 baths1,822 sq. ft.
2105 Allred Dr, Austin, TX 78748
MLS# 8725559Listed by: COMPASS RE TEXAS, LLC $485,000Active3 beds 2 baths1,759 sq. ft.
9833 Briar Ridge Dr, Austin, TX 78748
MLS# 6538529Listed by: THE NAV AGENCY $229,900Active3 beds 2 baths1,512 sq. ft.
635 W Dittmar Rd, Austin, TX 78745
MLS# 8620534Listed by: LET'S MOVE AUSTIN LLC $519,995Active4 beds 4 baths2,528 sq. ft.
1012 Legend Milton Ln, Austin, TX 78748
MLS# 5835819Listed by: DEN PROPERTY GROUP $515,000Active3 beds 3 baths1,788 sq. ft.
3000 Cohoba Dr, Austin, TX 78748
MLS# 9178453Listed by: COMPASS RE TEXAS, LLC $395,000Active3 beds 3 baths1,930 sq. ft.
8922 Menchaca Rd #906, Austin, TX 78748
MLS# 4079008Listed by: COMPASS RE TEXAS, LLC $310,000Active3 beds 2 baths1,271 sq. ft.
1837 Friars Tale Ln, Austin, TX 78748
MLS# 7723849Listed by: GABRIEL PERALES, BROKER $305,000Active3 beds 3 baths1,922 sq. ft.
11433 Lost Maples Trl, Austin, TX 78748
MLS# 6935693Listed by: KNIPPA PROPERTIES $289,000Active3 beds 3 baths1,545 sq. ft.
1510 Catalan Rd #602, Austin, TX 78748
MLS# 2459929Listed by: COLDWELL BANKER D'ANN HARPER $874,900Pending2 beds 2 baths1,380 sq. ft.
10908 Slaughter Creek Dr, Austin, TX 78748
MLS# 2187442Listed by: EVA STREET PROPERTIES $350,000Active2 beds 2 baths1,100 sq. ft.
2609 Davis Ln #2, Austin, TX 78745
MLS# 3456376Listed by: KUPER SOTHEBY'S INT'L REALTY $374,000Active2 beds 2 baths1,100 sq. ft.
2611 Davis Ln #2, Austin, TX 78745
MLS# 4059861Listed by: KUPER SOTHEBY'S INT'L REALTY $274,990Active3 beds 2 baths1,074 sq. ft.
11601 Murano Dr, Austin, TX 78747
MLS# 3878463Listed by: NEW HOME NOW $799,999Active0.8 Acres
1401 Mooreland Dr, Austin, TX 78748
MLS# 3587552Listed by: COFFMAN REAL ESTATE $2,250,000Active4.72 Acres
10731 Menchaca Rd, Austin, TX 78748
MLS# 3391461Listed by: ZILKER PROPERTIES OF AUSTIN $175,000Active0.15 Acres
9313 Independence Loop, Austin, TX 78748
MLS# 6796004Listed by: COMPASS RE TEXAS, LLC $175,000Active0.15 Acres
9311 Independence Loop, Austin, TX 78748
MLS# 9818362Listed by: COMPASS RE TEXAS, LLC
Local realty services provided by:CENTURY 21 North East, CENTURY 21 Scott Myers Realtors, CENTURY 21 Judge Fite Company
Some properties that appear for sale on this web site may subsequently have been sold and may no longer be available. The data relating to real estate for sale on this web site comes in part from the FHAAR IDX INFO SHARE PROGRAM. Real estate listings held by brokerage firms other than CENTURY 21 Scott Myers Realtors include the name of the listing agent. Copyright 2026 FHAAR IDX INFO SHARE PROGRAM. Last Updated June 7, 2026
Popular searches near 78748
Popular neighborhoods near 78748
- Avana, Austin homes for sale
- Bauerle Ranch, Austin homes for sale
- Cherry Creek, Austin homes for sale
- Circle C, Austin homes for sale
- East Congress, Austin homes for sale
- Franklin Park, Austin homes for sale
- Garrison Park, Austin homes for sale
- Hielscher, Austin homes for sale
- Maple Run, Austin homes for sale
- Onion Creek, Austin homes for sale
- Sendera, Austin homes for sale
- South Lamar (SoLa), Austin homes for sale
- South Manchaca, Austin homes for sale
- Southwest Austin, Austin homes for sale
- Sweetbriar, Austin homes for sale
- Village At Western Oaks, Austin homes for sale
- West Congress, Austin homes for sale
- Western Oaks, Austin homes for sale
- Westgate, Austin homes for sale
- Woodstone Village, Austin homes for sale
Counties near Austin, 78748
- Bastrop County homes for sale
- Bell County homes for sale
- Bexar County homes for sale
- Blanco County homes for sale
- Burleson County homes for sale
- Burnet County homes for sale
- Caldwell County homes for sale
- Comal County homes for sale
- Fayette County homes for sale
- Gillespie County homes for sale
- Gonzales County homes for sale
- Guadalupe County homes for sale
- Hays County homes for sale
- Kendall County homes for sale
- Lee County homes for sale
- Llano County homes for sale
- Milam County homes for sale
- Travis County homes for sale
- Williamson County homes for sale
- Wilson County homes for sale
Protect your home and budget from life's surprises with an Assurant Home Warranty, backed by a partner that supports you through every step of homeownership. Explore Plans.
©2026 Century 21 Real Estate LLC. All rights reserved. CENTURY 21®, the CENTURY 21 Logo and C21® are service marks owned by Century 21 Real Estate LLC. Century 21 Real Estate LLC fully supports the principles of the Fair Housing Act and the Equal Opportunity Act. Each office is independently owned and operated. Listing information is deemed reliable but not guaranteed accurate.