- Avondale homes for sale
- Chandler homes for sale
- Citrus Park homes for sale
- El Mirage homes for sale
- Fountain Hills homes for sale
- Gilbert homes for sale
- Glendale homes for sale
- Guadalupe homes for sale
- Komatke homes for sale
- Laveen homes for sale
- Litchfield Park homes for sale
- Mesa homes for sale
- Paradise Valley homes for sale
- Phoenix homes for sale
- Scottsdale homes for sale
- Sun City homes for sale
- Sun City West homes for sale
- Tempe homes for sale
- Tolleson homes for sale
- Youngtown homes for sale
85014, AZ - homes for sale
185 of 185 results displayed
- New
 $875,000Active4 beds 4 baths3,031 sq. ft.
6321 N 13th Street, Phoenix, AZ 85014
MLS# 7038736Listed by: GOLD TRUST REALTY - New
 $269,000Active2 beds 2 baths879 sq. ft.
1449 E Highland Avenue #3, Phoenix, AZ 85014
MLS# 7038709Listed by: WEST USA REALTY - New
 $1,985,900Active3 beds 4 baths2,713 sq. ft.
5937 N 14th Street, Phoenix, AZ 85014
MLS# 7038467Listed by: CAMELOT HOMES, INC. - New
 $849,000Active5 beds 3 baths1,923 sq. ft.
6021 N 10th Street, Phoenix, AZ 85014
MLS# 7038120Listed by: LONG REALTY UPTOWN - New
 $500,000Active4 beds 3 baths1,755 sq. ft.
1330 E Catalina Drive, Phoenix, AZ 85014
MLS# 7037896Listed by: GENTRY REAL ESTATE - New
 $180,000Active1 beds 1 baths550 sq. ft.
1441 E Maryland Avenue #5, Phoenix, AZ 85014
MLS# 7037581Listed by: WEST USA REALTY - New
 $308,500Active2 beds 2 baths1,178 sq. ft.
3302 N 7th Street #249, Phoenix, AZ 85014
MLS# 7037422Listed by: CENTURY 21 TOMA PARTNERS - New
 $690,000Active-- beds -- baths
6220 N 14th Street, Phoenix, AZ 85014
MLS# 7036782Listed by: R.O.I. PROPERTIES - New
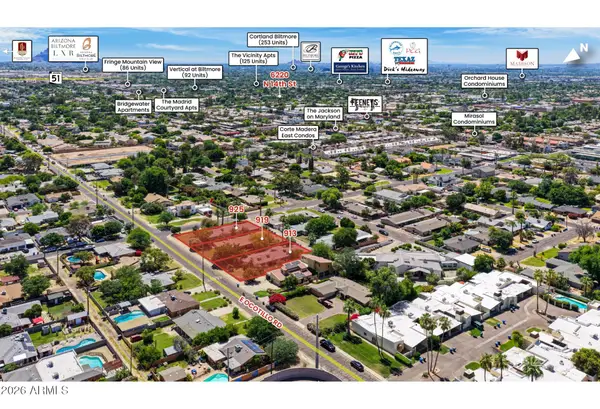
 $650,000Active-- beds -- baths
913 E Ocotillo Road, Phoenix, AZ 85014
MLS# 7036704Listed by: R.O.I. PROPERTIES - New
 $650,000Active-- beds -- baths
919 E Ocotillo Road, Phoenix, AZ 85014
MLS# 7036728Listed by: R.O.I. PROPERTIES - New
 $650,000Active-- beds -- baths
925 E Ocotillo Road, Phoenix, AZ 85014
MLS# 7036734Listed by: R.O.I. PROPERTIES - New
 $1,650,000Active-- beds -- baths
4323 N 13th Place, Phoenix, AZ 85014
MLS# 7035981Listed by: ABI MULTIFAMILY - New
 $249,900Active1 beds 1 baths824 sq. ft.
3302 N 7th Street #339, Phoenix, AZ 85014
MLS# 7035882Listed by: REALTY ONE GROUP - New
 $200,000Active2 beds 1 baths980 sq. ft.
1111 E Turney Avenue #23, Phoenix, AZ 85014
MLS# 7035575Listed by: WEST USA REALTY  $980,000Pending3 beds 3 baths2,457 sq. ft.
1140 E Tuckey Lane, Phoenix, AZ 85014
MLS# 7035209Listed by: COMPASS- New
 $505,000Active2 beds 2 baths1,879 sq. ft.
5812 N 12th Street #17, Phoenix, AZ 85014
MLS# 7034163Listed by: SERVICE STAR REALTY  $277,400Active2 beds 2 baths840 sq. ft.
749 E Montebello Avenue #128, Phoenix, AZ 85014
MLS# 7033091Listed by: THE BROKERY $437,000Active3 beds 1 baths1,240 sq. ft.
4238 N 10th Place, Phoenix, AZ 85014
MLS# 7032524Listed by: COMPASS $799,999Active-- beds -- baths
4524 N 14th Place, Phoenix, AZ 85014
MLS# 7032188Listed by: PARAMOUNT MANAGEMENT & REALTY, LLC $739,900Active2 beds 2 baths1,728 sq. ft.
914 E Osborn Road #415, Phoenix, AZ 85014
MLS# 7032023Listed by: REDFIN CORPORATION $1,050,000Active-- beds -- baths
940 E Rose Lane, Phoenix, AZ 85014
MLS# 7031945Listed by: ABI MULTIFAMILY $515,000Active2 beds 2 baths1,438 sq. ft.
1524 E Earll Drive, Phoenix, AZ 85014
MLS# 7030627Listed by: HOMESMART $689,000Pending4 beds 3 baths2,511 sq. ft.
1555 E Ocotillo Road #20, Phoenix, AZ 85014
MLS# 7030335Listed by: VIKING REALTY $525,000Pending3 beds 2 baths1,263 sq. ft.
1011 E Colter Street, Phoenix, AZ 85014
MLS# 7030353Listed by: RE/MAX FOOTHILLS $1,274,500Active-- beds -- baths
920 E Pasadena Avenue, Phoenix, AZ 85014
MLS# 7030100Listed by: BALBOA REALTY, LLC $750,000Active5 beds 4 baths3,045 sq. ft.
6022 N 5th Place, Phoenix, AZ 85012
MLS# 7029801Listed by: E & G REAL ESTATE SERVICES $220,000Active1 beds 1 baths760 sq. ft.
3302 N 7th Street #105, Phoenix, AZ 85014
MLS# 7029825Listed by: SUCCESS PROPERTY BROKERS $279,000Active2 beds 3 baths1,092 sq. ft.
1402 E Osborn Road #2, Phoenix, AZ 85014
MLS# 7029694Listed by: GENTRY REAL ESTATE $464,500Active2 beds 2 baths1,248 sq. ft.
5550 N 16th Street #142, Phoenix, AZ 85016
MLS# 7029632Listed by: MY HOME GROUP REAL ESTATE $875,000Active4 beds 3 baths2,217 sq. ft.
928 E Georgia Avenue, Phoenix, AZ 85014
MLS# 7029619Listed by: HOMESMART $364,900Pending3 beds 3 baths1,376 sq. ft.
1317 E Colter Street, Phoenix, AZ 85014
MLS# 7029280Listed by: REAL BROKER $824,000Active5 beds 3 baths1,729 sq. ft.
1058 E Whitton Avenue, Phoenix, AZ 85014
MLS# 7029213Listed by: BROKERS HUB REALTY, LLC $425,000Active3 beds 2 baths1,844 sq. ft.
6139 N 12th Way, Phoenix, AZ 85014
MLS# 7028435Listed by: W AND PARTNERS, LLC $560,000Pending3 beds 2 baths1,854 sq. ft.
1440 E Flower Street, Phoenix, AZ 85014
MLS# 7028175Listed by: COMPASS $589,900Pending2 beds 2 baths1,650 sq. ft.
914 E Osborn Road #418, Phoenix, AZ 85014
MLS# 7027613Listed by: RETSY $798,000Pending4 beds 2 baths2,130 sq. ft.
5321 N 14th Place, Phoenix, AZ 85014
MLS# 7027529Listed by: FATHOM REALTY ELITE $750,000Active3 beds 3 baths1,900 sq. ft.
901 E Berridge Lane, Phoenix, AZ 85014
MLS# 7026951Listed by: LOCAL LUXURY CHRISTIE'S INTERNATIONAL REAL ESTATE $640,000Active2 beds 2 baths2,676 sq. ft.
914 E Osborn Road #202, Phoenix, AZ 85014
MLS# 7026955Listed by: LOCAL LUXURY CHRISTIE'S INTERNATIONAL REAL ESTATE $750,000Pending3 beds 3 baths1,684 sq. ft.
5745 N 13th Place, Phoenix, AZ 85014
MLS# 7025979Listed by: COMPASS $750,000Active6 beds 4 baths2,462 sq. ft.
1147 E Flynn Lane, Phoenix, AZ 85014
MLS# 7025878Listed by: EXP REALTY $1,195,000Active4 beds 5 baths2,707 sq. ft.
6830 N 10th Place, Phoenix, AZ 85014
MLS# 7025037Listed by: EXP REALTY $529,000Pending2 beds 2 baths1,698 sq. ft.
1016 E Rose Lane, Phoenix, AZ 85014
MLS# 7024846Listed by: COLDWELL BANKER REALTY $1,070,000Pending-- beds -- baths
6024 N 12th Street, Phoenix, AZ 85014
MLS# 7024755Listed by: BETTER HOMES & GARDENS REAL ESTATE SJ FOWLER $600,000Pending2 beds 2 baths1,527 sq. ft.
1521 E Flower Street, Phoenix, AZ 85014
MLS# 7024421Listed by: HOMESMART $430,000Pending3 beds 2 baths1,201 sq. ft.
1046 E Clarendon Avenue, Phoenix, AZ 85014
MLS# 7024179Listed by: RUSS LYON SOTHEBY'S INTERNATIONAL REALTY $249,999Active2 beds 2 baths1,058 sq. ft.
1320 E Bethany Home Road #102, Phoenix, AZ 85014
MLS# 7023533Listed by: WEST USA REALTY $1,700,000Active0.76 Acres
1536 E Maryland Avenue, Phoenix, AZ 85014
MLS# 7022617Listed by: THE BROKERY $469,000Active2 beds 1 baths1,360 sq. ft.
3511 N 12th Street, Phoenix, AZ 85014
MLS# 7022503Listed by: DPR REALTY LLC $949,000Active-- beds -- baths
3515 N 12th Street, Phoenix, AZ 85014
MLS# 7022517Listed by: DPR REALTY LLC $725,000Pending4 beds 2 baths2,157 sq. ft.
1226 E Colter Street, Phoenix, AZ 85014
MLS# 7022363Listed by: COLDWELL BANKER REALTY $337,000Pending2 beds 3 baths1,225 sq. ft.
1017 E Maryland Avenue #108, Phoenix, AZ 85014
MLS# 7022116Listed by: REAL BROKER $1,275,000Active4 beds 4 baths4,169 sq. ft.
1435 E Rancho Drive, Phoenix, AZ 85014
MLS# 7021892Listed by: COMPASS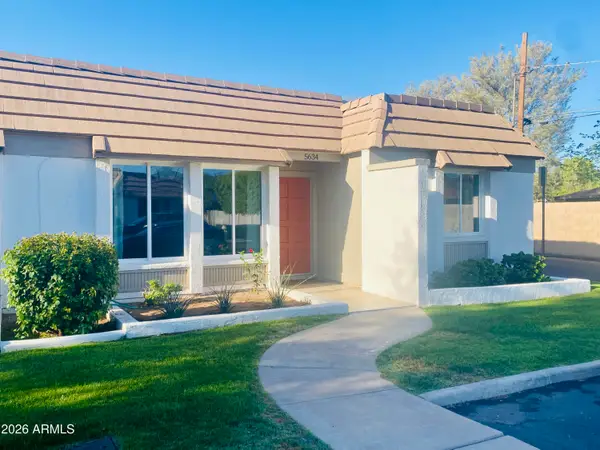 $565,000Active3 beds 2 baths1,820 sq. ft.
5634 N 12th Street, Phoenix, AZ 85014
MLS# 7021956Listed by: HOMESMART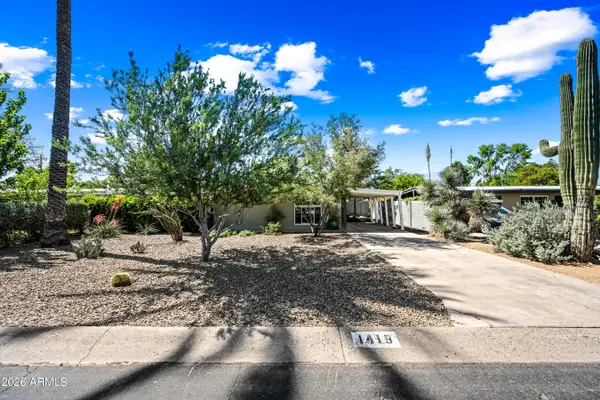 $720,000Active2 beds 2 baths1,155 sq. ft.
1419 E Rancho Drive, Phoenix, AZ 85014
MLS# 7021197Listed by: HOMESMART $435,000Pending3 beds 2 baths1,910 sq. ft.
6501 N La Paloma Este --, Phoenix, AZ 85014
MLS# 7021249Listed by: EXP REALTY $985,000Active4 beds 3 baths2,758 sq. ft.
1268 E Edgemont Avenue, Phoenix, AZ 85006
MLS# 7021191Listed by: LUXE REALTY $999,999Active-- beds -- baths
3422 N 12th Place, Phoenix, AZ 85014
MLS# 7020709Listed by: HOWE REALTY $180,000Active2 beds 1 baths750 sq. ft.
4224 N 12th Street #203, Phoenix, AZ 85014
MLS# 7020635Listed by: FATHOM REALTY $865,000Active3 beds 2 baths2,453 sq. ft.
1038 E Elm Street, Phoenix, AZ 85014
MLS# 7020641Listed by: W AND PARTNERS, LLC $286,000Active2 beds 2 baths1,178 sq. ft.
3302 N 7th Street #319, Phoenix, AZ 85014
MLS# 7020593Listed by: REAL BROKER $330,000Active2 beds 2 baths1,363 sq. ft.
934 E Montebello Avenue, Phoenix, AZ 85014
MLS# 7020536Listed by: HOMESMART $845,000Active-- beds -- baths
4514 N 14th Place, Phoenix, AZ 85014
MLS# 7020424Listed by: MY HOME GROUP REAL ESTATE $460,000Pending2 beds 2 baths1,751 sq. ft.
6502 N La Paloma Este --, Phoenix, AZ 85014
MLS# 7019546Listed by: EXP REALTY $525,000Active3 beds 2 baths1,938 sq. ft.
6035 N 10th Place, Phoenix, AZ 85014
MLS# 7019481Listed by: HOMESMART $679,900Active3 beds 2 baths1,876 sq. ft.
1501 E Earll Drive, Phoenix, AZ 85014
MLS# 7018981Listed by: COMPASS $1,349,000Active2 beds 3 baths2,718 sq. ft.
1040 E Osborn Road #402, Phoenix, AZ 85014
MLS# 7016482Listed by: BLISS REALTY & INVESTMENTS $1,469,000Active4 beds 4 baths2,377 sq. ft.
1341 E Pomelo Grove Lane, Phoenix, AZ 85014
MLS# 7016222Listed by: THE BROKERY $220,000Active2 beds 2 baths1,120 sq. ft.
6530 N 12th Street #10, Phoenix, AZ 85014
MLS# 7016201Listed by: HOMESMART $385,000Pending2 beds 2 baths1,102 sq. ft.
815 E Rose Lane #116, Phoenix, AZ 85014
MLS# 7015946Listed by: EXP REALTY $430,000Active3 beds 3 baths1,883 sq. ft.
6508 N 10th Place, Phoenix, AZ 85014
MLS# 7015607Listed by: REDFIN CORPORATION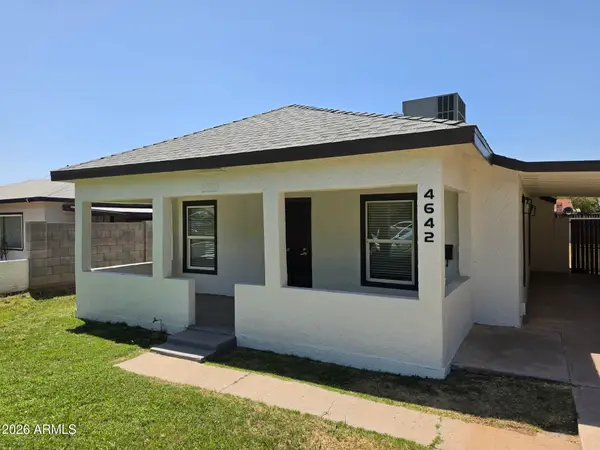 $368,500Active2 beds 1 baths876 sq. ft.
4642 N 10th Street, Phoenix, AZ 85014
MLS# 7015769Listed by: PEAK INVESTMENT PROPERTIES $294,900Active2 beds 2 baths1,178 sq. ft.
3302 N 7th Street #354, Phoenix, AZ 85014
MLS# 7015775Listed by: FATHOM REALTY ELITE $889,000Active4 beds 3 baths2,800 sq. ft.
5228 N 15th Street, Phoenix, AZ 85014
MLS# 7015155Listed by: MY HOME GROUP REAL ESTATE $1,100,000Active2 beds 3 baths2,334 sq. ft.
1040 E Osborn Road #1004, Phoenix, AZ 85014
MLS# 7014814Listed by: EXP REALTY $695,000Active4 beds 2 baths1,939 sq. ft.
6704 N 10th Place, Phoenix, AZ 85014
MLS# 7014826Listed by: E & G REAL ESTATE SERVICES $525,000Active4 beds 2 baths1,536 sq. ft.
1502 E Whitton Avenue, Phoenix, AZ 85014
MLS# 7013325Listed by: KELLER WILLIAMS REALTY PHOENIX $444,900Active3 beds 2 baths1,237 sq. ft.
4246 N 10th Place, Phoenix, AZ 85014
MLS# 7013326Listed by: EXP REALTY $318,000Pending2 beds 2 baths1,008 sq. ft.
1017 E Maryland Avenue #236, Phoenix, AZ 85014
MLS# 7011944Listed by: BARRETT REAL ESTATE $749,999Active3 beds 2 baths1,959 sq. ft.
1325 E Avalon Drive, Phoenix, AZ 85014
MLS# 7010163Listed by: EXP REALTY $895,000Active4 beds 4 baths2,621 sq. ft.
3927 N 13th Place, Phoenix, AZ 85014
MLS# 7009671Listed by: COMPASS $825,000Pending4 beds 2 baths2,072 sq. ft.
1228 E Tuckey Lane, Phoenix, AZ 85014
MLS# 7009326Listed by: FATHOM REALTY ELITE $699,800Active3 beds 2 baths1,648 sq. ft.
6036 N 8th Street, Phoenix, AZ 85014
MLS# 7009354Listed by: WEST USA REALTY $495,000Pending3 beds 2 baths1,256 sq. ft.
3911 N 13th Way, Phoenix, AZ 85014
MLS# 7009155Listed by: WEST USA REALTY $349,000Active3 beds 2 baths1,217 sq. ft.
5303 N 7th Street #220, Phoenix, AZ 85014
MLS# 7008360Listed by: REAL BROKER $449,900Active2 beds 3 baths1,656 sq. ft.
5750 N 10th Street #5, Phoenix, AZ 85014
MLS# 7008114Listed by: ENGEL & VOELKERS SCOTTSDALE $219,995Active2 beds 1 baths900 sq. ft.
6819 N 12th Street #9, Phoenix, AZ 85014
MLS# 7006863Listed by: THE XO AGENCY LLC $239,900Active2 beds 2 baths1,008 sq. ft.
1241 E Medlock Drive #213, Phoenix, AZ 85014
MLS# 7006448Listed by: MY HOME GROUP REAL ESTATE $334,000Active2 beds 2 baths1,081 sq. ft.
1025 E Highland Avenue #32, Phoenix, AZ 85014
MLS# 7006187Listed by: ARIZONA ELITE PROPERTIES $660,000Active3 beds 2 baths1,516 sq. ft.
5724 N 13th Place, Phoenix, AZ 85014
MLS# 7006006Listed by: PROSMART REALTY $280,000Pending2 beds 2 baths1,184 sq. ft.
920 E Devonshire Avenue #2020, Phoenix, AZ 85014
MLS# 7005423Listed by: AT HOME DESERT REALTY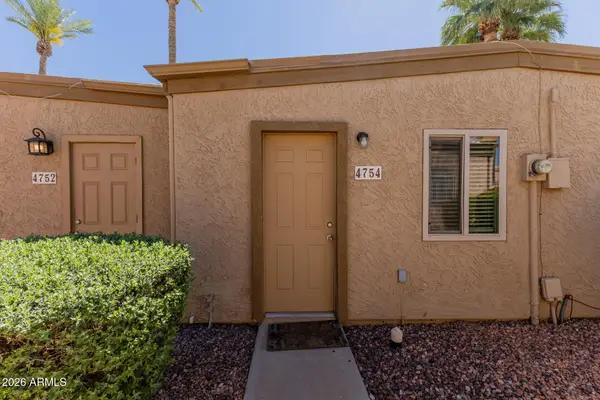 $160,000Pending2 beds 1 baths816 sq. ft.
4754 N 14th Street, Phoenix, AZ 85014
MLS# 7005332Listed by: EXP REALTY $317,900Active2 beds 2 baths1,030 sq. ft.
5303 N 7th Street #215, Phoenix, AZ 85014
MLS# 7004968Listed by: THE BROKERY $550,000Active2 beds 3 baths1,841 sq. ft.
5550 N 16th Street #134, Phoenix, AZ 85016
MLS# 7004421Listed by: BROKERS HUB REALTY, LLC $595,000Pending3 beds 3 baths2,042 sq. ft.
6740 N 15th Street, Phoenix, AZ 85014
MLS# 7004204Listed by: HOMESMART $538,500Pending3 beds 3 baths1,858 sq. ft.
5550 N 16th Street #123, Phoenix, AZ 85016
MLS# 7003310Listed by: FATHOM REALTY ELITE $265,000Active2 beds 2 baths1,089 sq. ft.
5035 N 10th Place #107, Phoenix, AZ 85014
MLS# 7002617Listed by: MY HOME GROUP REAL ESTATE $447,500Active3 beds 1 baths1,240 sq. ft.
4311 N 11th Place, Phoenix, AZ 85014
MLS# 7002490Listed by: BARRETT REAL ESTATE $485,000Active2 beds 2 baths2,036 sq. ft.
5812 N 12th Street #31, Phoenix, AZ 85014
MLS# 7002257Listed by: HOMESMART $350,000Active2 beds 2 baths1,538 sq. ft.
6126 N 12th Place #9, Phoenix, AZ 85014
MLS# 7002193Listed by: COMPASS $319,999Active2 beds 2 baths1,378 sq. ft.
1030 E Bethany Home Road #6, Phoenix, AZ 85014
MLS# 7001493Listed by: CITIEA $765,000Active3 beds 2 baths2,127 sq. ft.
6811 N 11th Place, Phoenix, AZ 85014
MLS# 7001199Listed by: COMPASS $185,000Pending2 beds 2 baths860 sq. ft.
4410 N Longview Avenue #202, Phoenix, AZ 85014
MLS# 6999086Listed by: HOWE REALTY $212,000Active1 beds 1 baths730 sq. ft.
1352 E Highland Avenue #202, Phoenix, AZ 85014
MLS# 6998437Listed by: EXP REALTY $384,500Active2 beds 2 baths1,538 sq. ft.
6118 N 12th Place #2, Phoenix, AZ 85014
MLS# 6997972Listed by: ARIZONA PREMIER REALTY HOMES & LAND, LLC $256,900Pending2 beds 2 baths1,184 sq. ft.
920 E Devonshire Avenue #4023, Phoenix, AZ 85014
MLS# 6997531Listed by: REALTY ONE GROUP $1,950,000Active-- beds -- baths
1021 E Fairmount Avenue, Phoenix, AZ 85014
MLS# 6997176Listed by: MATTHEWS REAL ESTATE INVESTMENT SERVICES $899,995Active4 beds 3 baths2,357 sq. ft.
5234 N 15 Street, Phoenix, AZ 85014
MLS# 6996874Listed by: HOMESMART $285,000Active2 beds 2 baths1,176 sq. ft.
5550 N 12th Street #24, Phoenix, AZ 85014
MLS# 6996806Listed by: VARSITY REALTY $344,990Active2 beds 2 baths1,500 sq. ft.
1201 E Rose Lane #9, Phoenix, AZ 85014
MLS# 6996447Listed by: EXP REALTY $390,000Pending1 beds 2 baths1,308 sq. ft.
914 E Osborn Road #208, Phoenix, AZ 85014
MLS# 6996138Listed by: RETSY $305,000Active2 beds 2 baths1,176 sq. ft.
5550 N 12th Street #8, Phoenix, AZ 85014
MLS# 6996030Listed by: COMPASS $3,750,000Active4 beds 6 baths5,681 sq. ft.
3042 N Manor Drive E, Phoenix, AZ 85014
MLS# 6994791Listed by: RETSY $625,000Pending3 beds 2 baths2,019 sq. ft.
1517 E Pinchot Avenue, Phoenix, AZ 85014
MLS# 6994212Listed by: BROKERS HUB REALTY, LLC $699,000Active-- beds -- baths
3817 N 9th Place, Phoenix, AZ 85014
MLS# 6993109Listed by: RUSS LYON SOTHEBY'S INTERNATIONAL REALTY $584,999Active3 beds 2 baths1,371 sq. ft.
6134 N 9th Street, Phoenix, AZ 85014
MLS# 6991138Listed by: AIG REALTY LLC $220,000Active2 beds 2 baths860 sq. ft.
4410 N Longview Avenue #208, Phoenix, AZ 85014
MLS# 6990584Listed by: CITIEA $314,900Active2 beds 2 baths924 sq. ft.
3551 N 12th Street #101, Phoenix, AZ 85014
MLS# 6990257Listed by: THE FIRM RE $770,000Pending4 beds 4 baths2,432 sq. ft.
1555 E Ocotillo Road #21, Phoenix, AZ 85014
MLS# 6989808Listed by: REALTY ONE GROUP $830,000Active-- beds -- baths
6201 N 9th Place, Phoenix, AZ 85014
MLS# 6988882Listed by: BLAIR ALLEN LUXURY REAL ESTATE $400,000Pending3 beds 1 baths1,276 sq. ft.
1207 E Georgia Avenue, Phoenix, AZ 85014
MLS# 6988833Listed by: BARRETT REAL ESTATE $2,695,000Active5 beds 4 baths4,721 sq. ft.
2939 N Manor Drive W, Phoenix, AZ 85014
MLS# 6988760Listed by: REAL BROKER $897,000Active3 beds 3 baths2,097 sq. ft.
5312 N 9th Street, Phoenix, AZ 85014
MLS# 6988650Listed by: LONG REALTY UPTOWN $985,000Pending-- beds -- baths
4515 N 14th Place, Phoenix, AZ 85014
MLS# 6988580Listed by: CAMBRIDGE PROPERTIES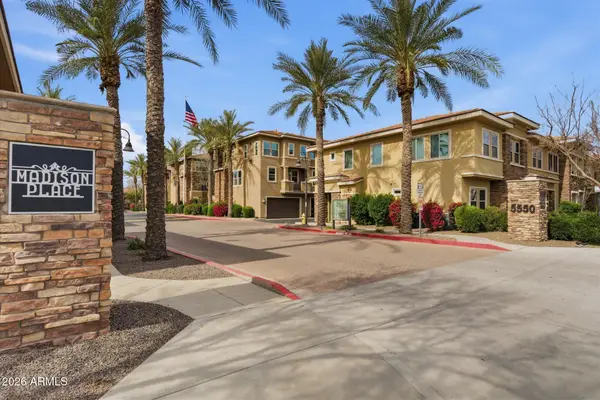 $465,000Active3 beds 2 baths1,530 sq. ft.
5550 N 16th Street #171, Phoenix, AZ 85016
MLS# 6987701Listed by: RUSS LYON SOTHEBY'S INTERNATIONAL REALTY $300,000Active2 beds 3 baths1,096 sq. ft.
3434 N 11th Street #5, Phoenix, AZ 85014
MLS# 6987556Listed by: KELLER WILLIAMS ARIZONA REALTY $818,000Active4 beds 3 baths2,200 sq. ft.
6842 N 14th Streets, Phoenix, AZ 85014
MLS# 6983965Listed by: HOMESMART $307,900Pending3 beds 2 baths1,196 sq. ft.
3411 N 12th Place #2, Phoenix, AZ 85014
MLS# 6983458Listed by: VALLEY CASA REALTY, INC $123,900Active1 beds 1 baths563 sq. ft.
4401 N 12th Street #201, Phoenix, AZ 85014
MLS# 6983023Listed by: EXP REALTY $295,000Active2 beds 2 baths1,217 sq. ft.
3302 N 7th Street #262, Phoenix, AZ 85014
MLS# 6982656Listed by: EXP REALTY $174,900Active1 beds 1 baths636 sq. ft.
4240 N Longview Avenue #9, Phoenix, AZ 85014
MLS# 6982193Listed by: CITIEA $350,000Active2 beds 2 baths1,279 sq. ft.
1336 E Maryland Avenue #10, Phoenix, AZ 85014
MLS# 6981008Listed by: HOMESMART $284,900Active2 beds 3 baths1,171 sq. ft.
6030 N 15th Street #11, Phoenix, AZ 85014
MLS# 6979392Listed by: EXP REALTY $590,000Active3 beds 3 baths2,787 sq. ft.
6018 N 5th Place, Phoenix, AZ 85012
MLS# 6977845Listed by: AT HOME REAL ESTATE ARIZONA $294,900Active2 beds 2 baths1,178 sq. ft.
3302 N 7th Street #353, Phoenix, AZ 85014
MLS# 6977459Listed by: FATHOM REALTY ELITE $1,000,000Active2 beds 3 baths3,139 sq. ft.
914 E Osborn Road #403, Phoenix, AZ 85014
MLS# 6975693Listed by: RETSY $225,000Active2 beds 1 baths900 sq. ft.
6819 N 12th Street #2, Phoenix, AZ 85014
MLS# 6974574Listed by: REALTY ONE GROUP $449,000Active4 beds 2 baths1,817 sq. ft.
4232 N 10th Street, Phoenix, AZ 85014
MLS# 6974439Listed by: EXP REALTY $2,500,000Active3 beds 3 baths3,528 sq. ft.
1040 E Osborn Road #1901, Phoenix, AZ 85014
MLS# 6971963Listed by: COMPASS $589,000Pending3 beds 4 baths1,914 sq. ft.
1400 E Bethany Home Road #14, Phoenix, AZ 85014
MLS# 6972659Listed by: THE BROKERY $799,000Active2 beds 3 baths2,409 sq. ft.
1040 E Osborn Road #601, Phoenix, AZ 85014
MLS# 6974169Listed by: COMPASS $260,000Active2 beds 2 baths840 sq. ft.
749 E Montebello Avenue #231, Phoenix, AZ 85014
MLS# 6970338Listed by: HOMESMART $389,000Pending2 beds 2 baths1,561 sq. ft.
6512 N 12th Way, Phoenix, AZ 85014
MLS# 6969391Listed by: THE AVE COLLECTIVE $886,000Active6 beds 5 baths2,458 sq. ft.
1044 E Whitton Avenue, Phoenix, AZ 85014
MLS# 6967608Listed by: INHOUSEVIP $425,000Active2 beds 3 baths1,461 sq. ft.
6223 N 12th Street #2, Phoenix, AZ 85014
MLS# 6967539Listed by: LPT REALTY, LLC $289,900Active2 beds 2 baths1,020 sq. ft.
1101 E Bethany Home Road #15, Phoenix, AZ 85014
MLS# 6966460Listed by: POLLY MITCHELL GLOBAL REALTY $191,000Pending1 beds 1 baths617 sq. ft.
1018 E Osborn Road #E, Phoenix, AZ 85014
MLS# 6965738Listed by: REALTY ONE GROUP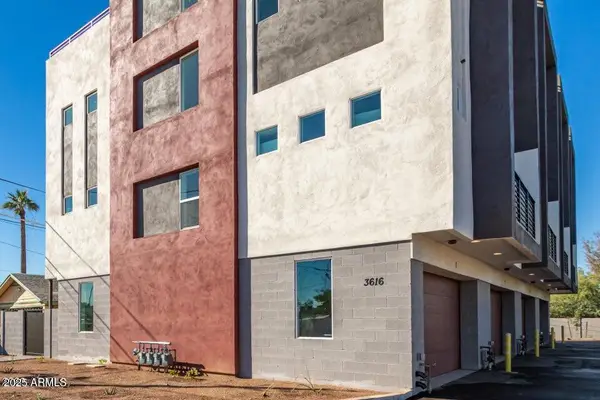 $2,500,000Active-- beds -- baths
3616 N 12th Street, Phoenix, AZ 85014
MLS# 6965389Listed by: RMA-MOUNTAIN PROPERTIES $279,000Active2 beds 2 baths1,012 sq. ft.
4142 N 11th Street #4, Phoenix, AZ 85014
MLS# 6964763Listed by: FATHOM REALTY ELITE $184,900Active1 beds 1 baths605 sq. ft.
1018 E Osborn Road #A, Phoenix, AZ 85014
MLS# 6961629Listed by: SELLING AZ REALTY $119,900Active1 beds 1 baths411 sq. ft.
4224 N 12th Street #209, Phoenix, AZ 85014
MLS# 6961287Listed by: SERHANT. $557,000Active3 beds 3 baths1,431 sq. ft.
6842 N 10th Place, Phoenix, AZ 85014
MLS# 6960947Listed by: EXP REALTY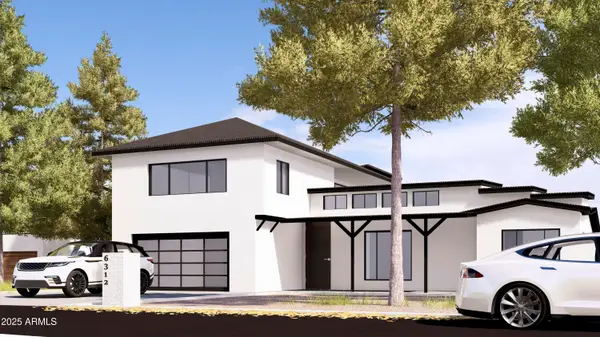 $1,350,000Pending5 beds 5 baths4,072 sq. ft.
6312 N 13th Street, Phoenix, AZ 85014
MLS# 6959629Listed by: THE BROKERY $325,000Active2 beds 2 baths900 sq. ft.
721 E Montebello Avenue #225, Phoenix, AZ 85014
MLS# 6959306Listed by: REALTY ONE GROUP $285,000Active2 beds 2 baths1,152 sq. ft.
1251 E Maryland Avenue #A, Phoenix, AZ 85014
MLS# 6958212Listed by: HOMESMART $225,000Pending2 beds 1 baths816 sq. ft.
4750 N 14th Street, Phoenix, AZ 85014
MLS# 6957860Listed by: REAL BROKER $475,000Pending-- beds -- baths
3810 N 9th Place, Phoenix, AZ 85014
MLS# 6957288Listed by: REALTY ONE GROUP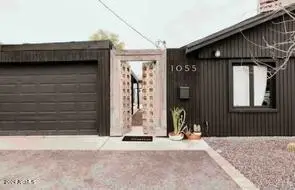 $725,000Active2 beds 2 baths1,888 sq. ft.
1055 E Whitton Avenue, Phoenix, AZ 85014
MLS# 6947020Listed by: GOLDWATER REAL ESTATE ADVISORS $850,000Active4 beds 2 baths2,118 sq. ft.
1135 E Lawrence Road, Phoenix, AZ 85014
MLS# 6941941Listed by: WEST USA REALTY $657,000Pending3 beds 3 baths2,349 sq. ft.
6002 N 5th Place, Phoenix, AZ 85012
MLS# 6941280Listed by: LIBERTAS REAL ESTATE $1,999,995Active5 beds 4 baths3,341 sq. ft.
1413 E San Miguel Avenue, Phoenix, AZ 85014
MLS# 6941205Listed by: HOMESMART $995,000Active2 beds 3 baths2,334 sq. ft.
1040 E Osborn Road #904, Phoenix, AZ 85014
MLS# 6938292Listed by: BROKERS HUB REALTY, LLC $154,500Active1 beds 1 baths592 sq. ft.
4224 N 12th Street #207, Phoenix, AZ 85014
MLS# 6937650Listed by: R.O.I. PROPERTIES $225,000Active2 beds 1 baths816 sq. ft.
1343 E Pierson Street, Phoenix, AZ 85014
MLS# 6933018Listed by: KELLER WILLIAMS ARIZONA REALTY $474,995Active2 beds 2 baths1,775 sq. ft.
6640 N Chatelaine Place, Phoenix, AZ 85014
MLS# 6928234Listed by: HOMESMART $454,980Active2 beds 2 baths1,338 sq. ft.
914 E Osborn Road #417, Phoenix, AZ 85014
MLS# 6925573Listed by: EXP REALTY $3,995,000Pending5 beds 6 baths5,644 sq. ft.
3007 N Manor Drive W, Phoenix, AZ 85014
MLS# 6912023Listed by: RUSS LYON SOTHEBY'S INTERNATIONAL REALTY $470,000Pending3 beds 2 baths1,921 sq. ft.
1401 E Osborn Road, Phoenix, AZ 85014
MLS# 6911585Listed by: LPT REALTY, LLC $209,500Active2 beds 1 baths980 sq. ft.
1111 E Turney Avenue #18, Phoenix, AZ 85014
MLS# 6982653Listed by: KELLER WILLIAMS REALTY SONORAN LIVING $285,000Pending2 beds 2 baths1,275 sq. ft.
6767 N 7th Street #227, Phoenix, AZ 85014
MLS# 6958156Listed by: BARRETT REAL ESTATE $164,900Active1 beds 1 baths600 sq. ft.
4224 N 12th Street #108, Phoenix, AZ 85014
MLS# 6880172Listed by: HOMESMART $799,000Active2 beds 3 baths2,409 sq. ft.
1040 E Osborn Road #501, Phoenix, AZ 85014
MLS# 6869856Listed by: REALTY ONE GROUP $799,000Active2 beds 2 baths1,981 sq. ft.
1040 E Osborn Road #1103, Phoenix, AZ 85014
MLS# 6860286Listed by: SERHANT. $1,200,000Active2 beds 3 baths2,602 sq. ft.
1040 E Osborn Road #1801, Phoenix, AZ 85014
MLS# 6835260Listed by: COLDWELL BANKER REALTY $1,334,000Active-- beds -- baths
939 E Turney Avenue, Phoenix, AZ 85014
MLS# 6810283Listed by: AZREAPM $499,999Active0.29 Acres
4440 N 13th Place #22, Phoenix, AZ 85014
MLS# 6808645Listed by: ARIZONA 1ST LAND & HOME RE CO $312,000Active2 beds 2 baths1,275 sq. ft.
6767 N 7th Street #217, Phoenix, AZ 85014
MLS# 6968137Listed by: BARRETT REAL ESTATE $215,000Active2 beds 1 baths980 sq. ft.
1111 E Turney Avenue #25, Phoenix, AZ 85014
MLS# 6891761Listed by: THE BROKERY $975,000Active4 beds 3 baths2,200 sq. ft.
6225 N 14th Place, Phoenix, AZ 85014
MLS# 6652390Listed by: LAUNCH POWERED BY COMPASS $280,000Active2 beds -- baths1,170 sq. ft.
2946 N 14th Street #11, Phoenix, AZ 85014
MLS# 6651219Listed by: RUSS LYON SOTHEBY'S INTERNATIONAL REALTY $2,700,000Active-- beds -- baths
901 E Claremont Street, Phoenix, AZ 85014
MLS# 6646494Listed by: MARCUS & MILLICHAP $175,000Active1 beds 1 baths563 sq. ft.
4401 N 12th Street #119, Phoenix, AZ 85014
MLS# 6645375Listed by: EXP REALTY $3,750,000Active5 beds 5 baths6,087 sq. ft.
85 N Country Club Drive, Phoenix, AZ 85014
MLS# 6627928Listed by: RUSS LYON SOTHEBY'S INTERNATIONAL REALTY $145,000Active1 beds -- baths563 sq. ft.
4401 N 12th Street #110, Phoenix, AZ 85014
MLS# 6625120Listed by: WEST USA REALTY $280,000Active2 beds -- baths1,009 sq. ft.
1004 E Osborn Road #D, Phoenix, AZ 85014
MLS# 6622458Listed by: KELLER WILLIAMS REALTY EAST VALLEY $439,800Active2 beds -- baths
4246 N 10th Street, Phoenix, AZ 85014
MLS# 6602414Listed by: HOMESMART
Local realty services provided by:CENTURY 21 Arizona West
Popular searches near 85014
Popular neighborhoods near 85014
- Alhambra, Phoenix homes for sale
- Alvarado, Phoenix homes for sale
- Ashland Place, Phoenix homes for sale
- Biltmore, Phoenix homes for sale
- Camelback Corridor, Paradise Valley homes for sale
- Camelback Gardens, Phoenix homes for sale
- Cheery Lynn, Phoenix homes for sale
- Coronado, Phoenix homes for sale
- East Alvarado, Phoenix homes for sale
- Encanto, Phoenix homes for sale
- Greenfield Acres, Phoenix homes for sale
- Meadowbrook, Phoenix homes for sale
- Medlock Place, Phoenix homes for sale
- Midtown Phoenix, Phoenix homes for sale
- North Central Corridor, Phoenix homes for sale
- North Encanto, Phoenix homes for sale
- Pierson Place, Phoenix homes for sale
- Willo, Phoenix homes for sale
- Windsor Square, Phoenix homes for sale
- Yaple Park, Phoenix homes for sale
Counties near Phoenix, 85014
Protect your home and budget from life's surprises with an Assurant Home Warranty, backed by a partner that supports you through every step of homeownership. Explore Plans.
©2026 Century 21 Real Estate LLC. All rights reserved. CENTURY 21®, the CENTURY 21 Logo and C21® are service marks owned by Century 21 Real Estate LLC. Century 21 Real Estate LLC fully supports the principles of the Fair Housing Act and the Equal Opportunity Act. Each office is independently owned and operated. Listing information is deemed reliable but not guaranteed accurate.