- Anthem homes for sale
- Carefree homes for sale
- Cave Creek homes for sale
- Deer Valley homes for sale
- El Mirage homes for sale
- Fountain Hills homes for sale
- Glendale homes for sale
- Guadalupe homes for sale
- Litchfield Park homes for sale
- New River homes for sale
- Paradise Valley homes for sale
- Peoria homes for sale
- Phoenix homes for sale
- Scottsdale homes for sale
- Sun City homes for sale
- Sun City West homes for sale
- Surprise homes for sale
- Tempe homes for sale
- Tolleson homes for sale
- Youngtown homes for sale
85023, AZ - homes for sale
124 of 124 results displayed
- New
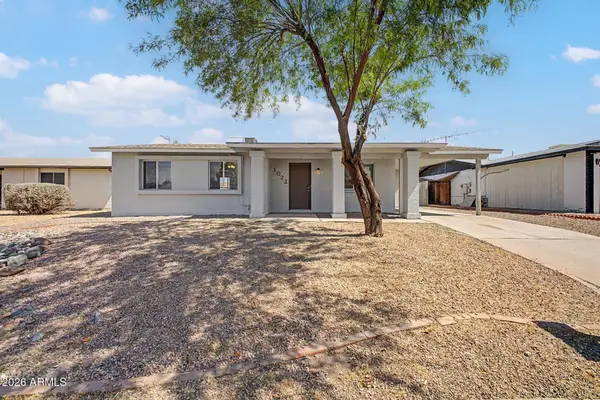
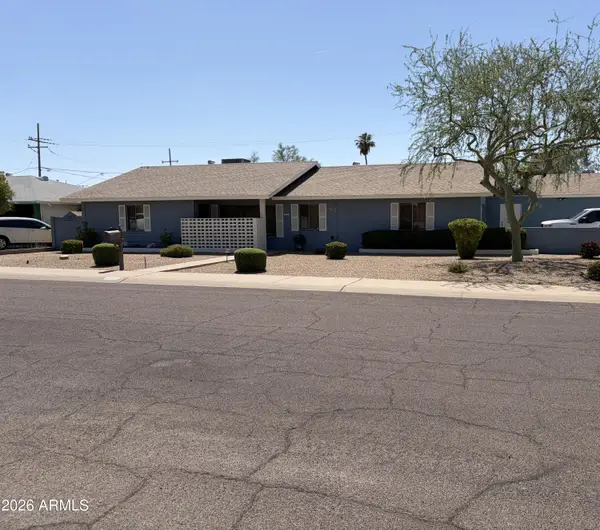 $575,000Active3 beds 2 baths2,013 sq. ft.
2305 W Meadow Drive, Phoenix, AZ 85023
MLS# 7038590Listed by: SELL YOUR HOME SERVICES - New
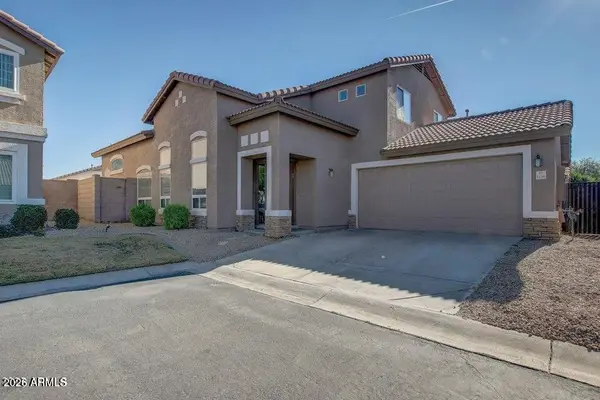
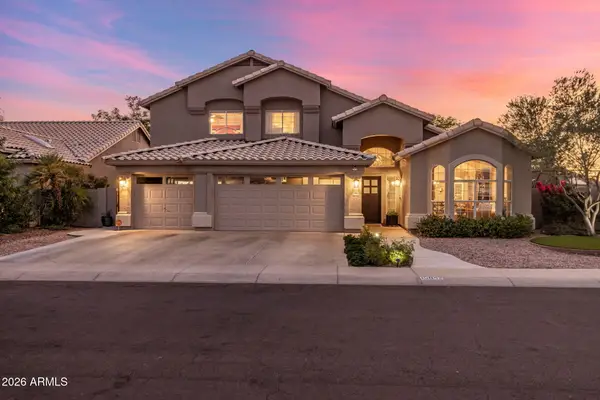 $875,000Active4 beds 3 baths3,018 sq. ft.
15842 N 7th Drive, Phoenix, AZ 85023
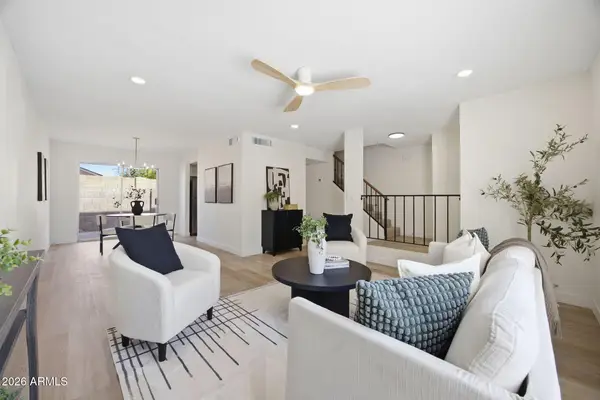
MLS# 7038506Listed by: LOCALITY HOMES  $325,000Pending4 beds 3 baths1,610 sq. ft.
2435 W Greenway Road #8, Phoenix, AZ 85023
MLS# 7037992Listed by: BROKERS HUB REALTY, LLC- New
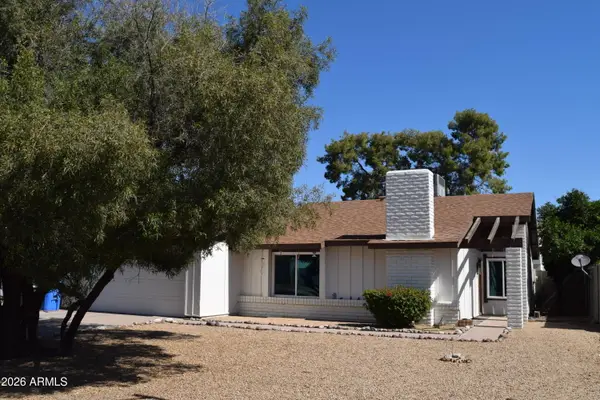
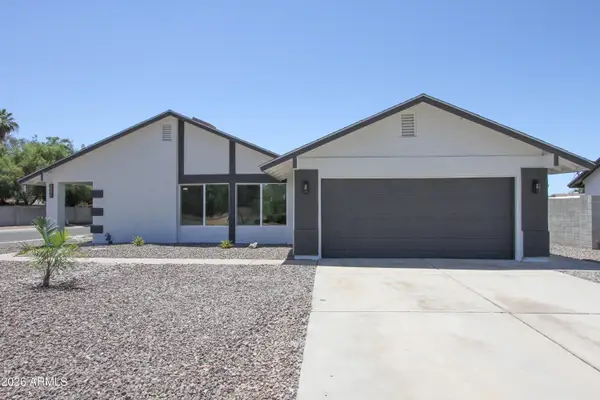
 $279,900Active3 beds 2 baths1,246 sq. ft.
16021 N 25th Drive, Phoenix, AZ 85023
MLS# 7037258Listed by: EXP REALTY - New
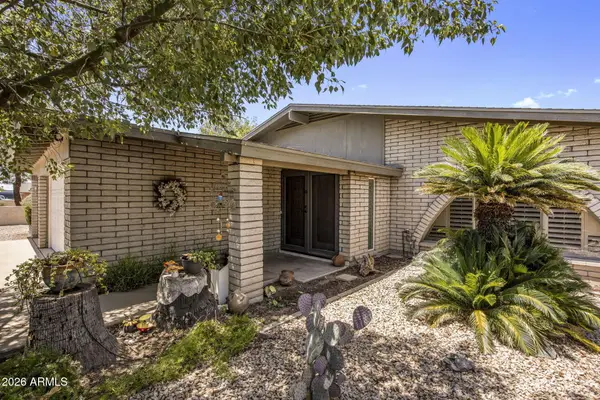
 $400,000Active3 beds 2 baths1,410 sq. ft.
2320 W Waltann Lane, Phoenix, AZ 85023
MLS# 7036467Listed by: RE/MAX PREMIER - New
 $825,000Active3 beds 3 baths2,013 sq. ft.
14238 N 2nd Avenue N, Phoenix, AZ 85023
MLS# 7036263Listed by: HOMESMART - New
 $349,900Active3 beds 2 baths1,010 sq. ft.
1022 W Anderson Drive, Phoenix, AZ 85023
MLS# 7036016Listed by: MY HOME GROUP REAL ESTATE - New
 $520,000Active4 beds 3 baths2,270 sq. ft.
16036 N 11th Avenue #1120, Phoenix, AZ 85023
MLS# 7035972Listed by: BELLAGIO REAL ESTATE - New
 $315,000Active3 beds 2 baths1,342 sq. ft.
14872 N 24th Drive #4, Phoenix, AZ 85023
MLS# 7035845Listed by: WEST USA REALTY - New
 $449,000Active3 beds 2 baths1,558 sq. ft.
538 W Marconi Avenue, Phoenix, AZ 85023
MLS# 7035700Listed by: REALTY ONE GROUP - New
 $629,900Active3 beds 3 baths2,111 sq. ft.
1021 W Kings Avenue, Phoenix, AZ 85023
MLS# 7035431Listed by: DPR REALTY LLC - New
 $424,900Active3 beds 2 baths1,410 sq. ft.
2371 W Paradise Lane, Phoenix, AZ 85023
MLS# 7035234Listed by: REALTY ONE GROUP - New
 $775,000Active6 beds 4 baths2,853 sq. ft.
607 W Villa Rita Drive, Phoenix, AZ 85023
MLS# 7035284Listed by: REAL BROKER - New
 $825,000Active4 beds 2 baths2,677 sq. ft.
52 W Thunderbird Road, Phoenix, AZ 85023
MLS# 7035009Listed by: LOCALITY HOMES  $360,000Pending2 beds 3 baths1,520 sq. ft.
1953 W Busoni Place, Phoenix, AZ 85023
MLS# 7034730Listed by: WEST USA REALTY- New
 $299,000Active3 beds 3 baths1,584 sq. ft.
16063 N 26th Circle, Phoenix, AZ 85023
MLS# 7034634Listed by: COLDWELL BANKER REALTY  $559,296Active4 beds 3 baths1,942 sq. ft.
219 W Angela Drive, Phoenix, AZ 85023
MLS# 7033803Listed by: REAL BROKER $329,950Active3 beds 2 baths1,143 sq. ft.
14852 N 24th Drive #5, Phoenix, AZ 85023
MLS# 7033651Listed by: VENTURE REI, LLC $1,165,000Active4 beds 3 baths3,574 sq. ft.
302 W Pine Valley Drive, Phoenix, AZ 85023
MLS# 7033534Listed by: REALTY ONE GROUP $850,000Active4 beds 3 baths2,972 sq. ft.
14350 N Medinan Drive, Phoenix, AZ 85022
MLS# 7033029Listed by: COMPASS $25,000Active2 beds 2 baths1,344 sq. ft.
16624 N 2nd Drive #181, Phoenix, AZ 85023
MLS# 7032834Listed by: PRO-FORMANCE REALTY CONCEPTS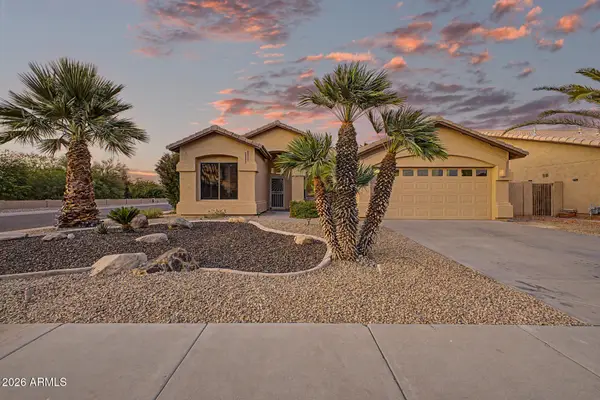 $559,900Pending3 beds 2 baths1,698 sq. ft.
338 W Angela Drive, Phoenix, AZ 85023
MLS# 7032511Listed by: REALTY ONE GROUP $569,995Pending5 beds 2 baths2,002 sq. ft.
14622 N 18th Drive, Phoenix, AZ 85023
MLS# 7032512Listed by: REAL ESTATE 48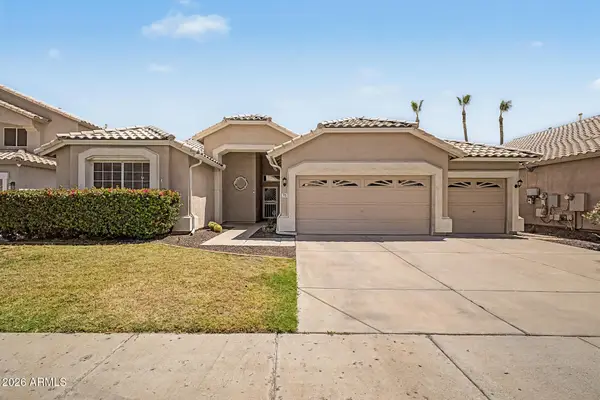 $639,900Active4 beds 2 baths2,427 sq. ft.
725 W Beverly Lane, Phoenix, AZ 85023
MLS# 7031963Listed by: AARTIE AIYER REALTY LLC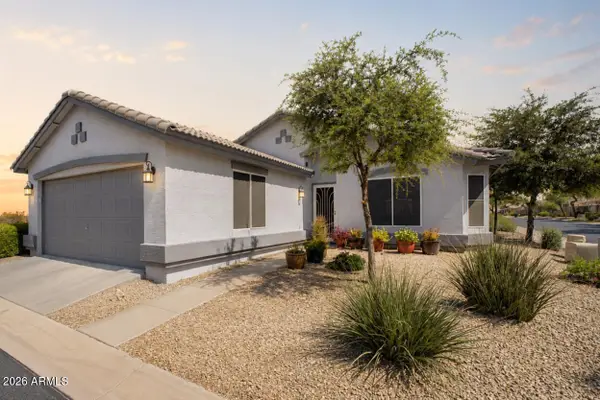 $399,950Active3 beds 2 baths1,317 sq. ft.
16036 N 11th Avenue #1030, Phoenix, AZ 85023
MLS# 7031239Listed by: EXP REALTY $459,000Active3 beds 3 baths1,871 sq. ft.
1948 W Davis Road, Phoenix, AZ 85023
MLS# 7031211Listed by: WEST USA REALTY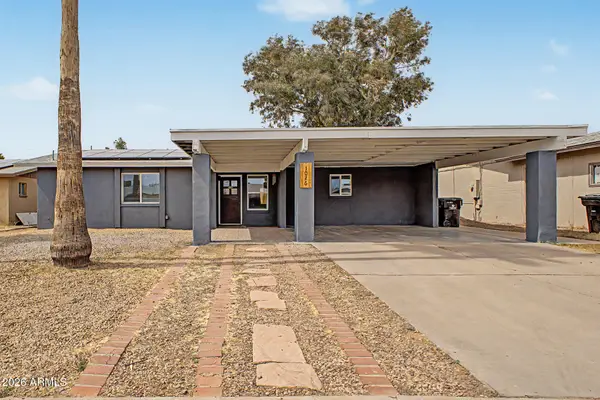 $350,000Active2 beds 2 baths1,193 sq. ft.
1026 W Halstead Drive, Phoenix, AZ 85023
MLS# 7031075Listed by: REAL BROKER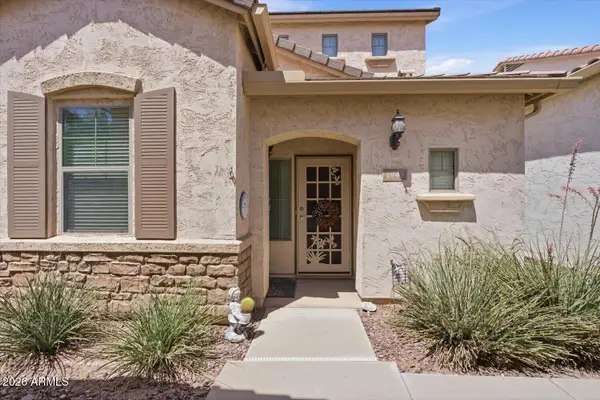 $419,900Active3 beds 3 baths1,871 sq. ft.
1945 W Busoni Place, Phoenix, AZ 85023
MLS# 7028777Listed by: RUSS LYON SOTHEBY'S INTERNATIONAL REALTY $399,000Pending4 beds 2 baths2,432 sq. ft.
17442 N 24th Drive, Phoenix, AZ 85023
MLS# 7028659Listed by: AZ REALTY PROS $399,000Pending4 beds 2 baths1,428 sq. ft.
1127 W Grovers Avenue, Phoenix, AZ 85023
MLS# 7027547Listed by: EXP REALTY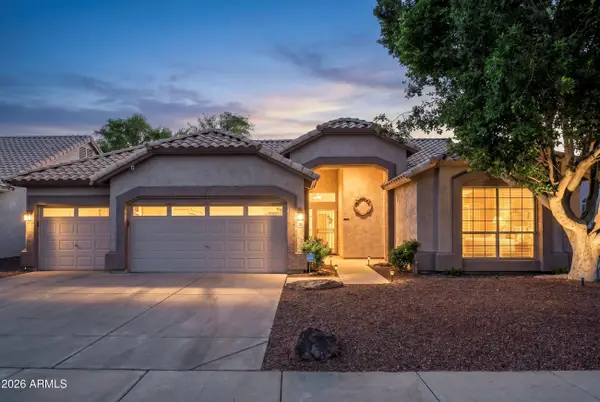 $609,000Active4 beds 2 baths2,401 sq. ft.
722 W Kelton Lane, Phoenix, AZ 85023
MLS# 7027263Listed by: TIERRA ANTIGUA REALTY, LLC $375,000Pending2 beds 2 baths1,246 sq. ft.
406 W Beverly Lane, Phoenix, AZ 85023
MLS# 7027109Listed by: RE/MAX FINE PROPERTIES $145,000Active2 beds 2 baths914 sq. ft.
14203 N 19th Avenue N #2001, Phoenix, AZ 85023
MLS# 7027037Listed by: MY HOME GROUP REAL ESTATE $425,000Pending3 beds 2 baths2,021 sq. ft.
2142 W Meadow Drive, Phoenix, AZ 85023
MLS# 7026249Listed by: HOMESMART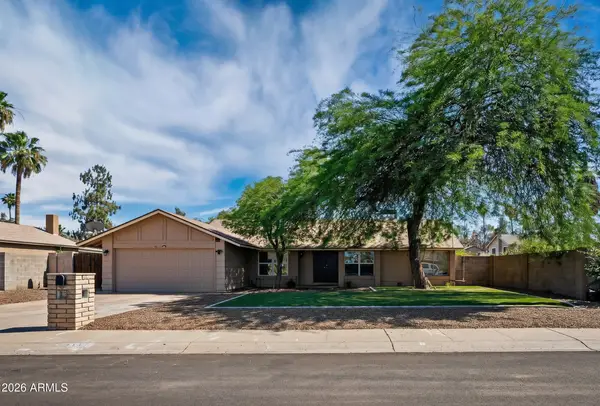 $424,000Active3 beds 2 baths1,444 sq. ft.
2439 W Kathleen Road, Phoenix, AZ 85023
MLS# 7026014Listed by: KELLER WILLIAMS REALTY PHOENIX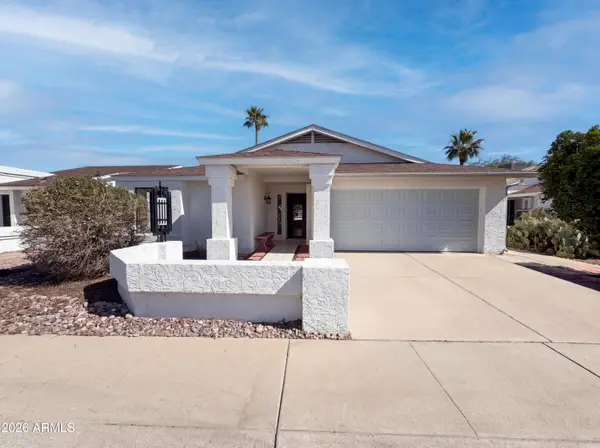 $413,000Pending3 beds 2 baths1,553 sq. ft.
318 W Kings Avenue, Phoenix, AZ 85023
MLS# 7025833Listed by: OPENDOOR BROKERAGE, LLC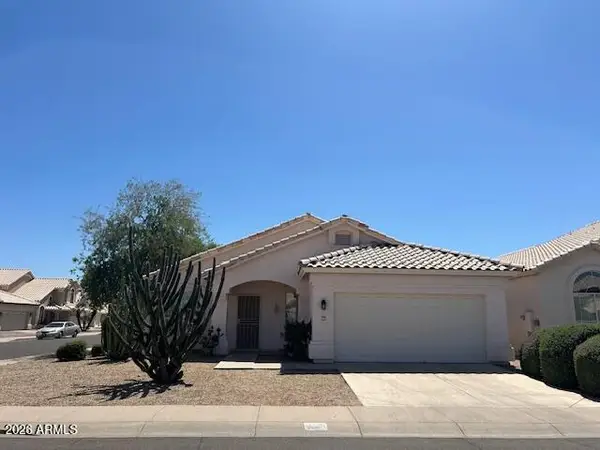 $492,900Active3 beds 2 baths1,756 sq. ft.
1101 W Monte Cristo Avenue, Phoenix, AZ 85023
MLS# 7025888Listed by: WEST USA REALTY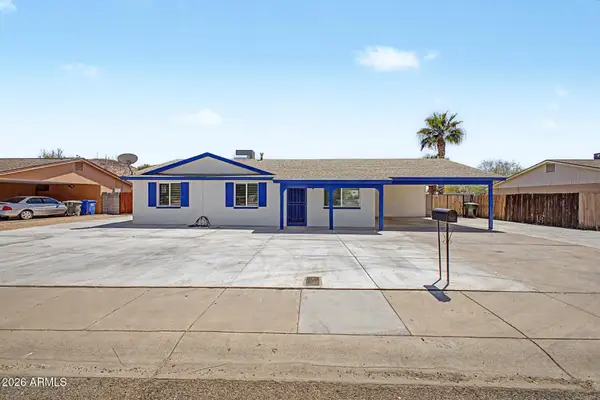 $400,000Active3 beds 2 baths1,280 sq. ft.
1645 W Thunderbird Road, Phoenix, AZ 85023
MLS# 7025643Listed by: WEST USA REALTY $55,900Active2 beds 2 baths1,056 sq. ft.
205 W Bell Road #246, Phoenix, AZ 85023
MLS# 7025411Listed by: WEST USA REALTY $575,000Pending3 beds 2 baths1,900 sq. ft.
548 W Michelle Drive, Phoenix, AZ 85023
MLS# 7024894Listed by: EXP REALTY $314,900Active2 beds 2 baths1,346 sq. ft.
2659 W Hearn Road, Phoenix, AZ 85023
MLS# 7024850Listed by: MY HOME GROUP REAL ESTATE $365,000Pending3 beds 2 baths1,260 sq. ft.
1541 W Danbury Road, Phoenix, AZ 85023
MLS# 7024693Listed by: REALTY ONE GROUP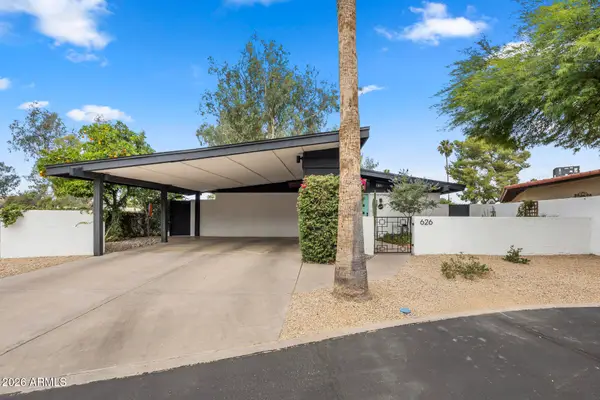 $575,000Pending3 beds 2 baths1,702 sq. ft.
626 W Gibraltar Lane, Phoenix, AZ 85023
MLS# 7024550Listed by: FATHOM REALTY ELITE $225,000Pending3 beds 1 baths938 sq. ft.
2119 W Danbury Road, Phoenix, AZ 85023
MLS# 7024001Listed by: RE/MAX FINE PROPERTIES $799,000Active4 beds 3 baths2,402 sq. ft.
216 W Winged Foot Road, Phoenix, AZ 85023
MLS# 7023442Listed by: LOCALITY HOMES $450,000Pending3 beds 3 baths1,710 sq. ft.
801 W Michelle Drive, Phoenix, AZ 85023
MLS# 7023276Listed by: HOMESMART $565,000Active4 beds 2 baths1,816 sq. ft.
1011 W Kelton Lane, Phoenix, AZ 85023
MLS# 7022401Listed by: R.O.I. PROPERTIES $179,999Active1 beds 1 baths592 sq. ft.
14203 N 19th Avenue #1020, Phoenix, AZ 85023
MLS# 7022205Listed by: AMERICA'S ALL IN ONE REAL ESTATE SERVICES, INC. $410,000Pending3 beds 2 baths1,532 sq. ft.
906 W Saint John Road, Phoenix, AZ 85023
MLS# 7022063Listed by: RUSS LYON SOTHEBY'S INTERNATIONAL REALTY $399,000Pending3 beds 2 baths1,355 sq. ft.
16036 N 11th Avenue #1137, Phoenix, AZ 85023
MLS# 7021765Listed by: AXEN REALTY, LLC $420,000Active4 beds 2 baths1,333 sq. ft.
913 W Saint John Road, Phoenix, AZ 85023
MLS# 7021356Listed by: GENTRY REAL ESTATE $664,500Active4 beds 2 baths1,818 sq. ft.
1634 W Acoma Drive, Phoenix, AZ 85023
MLS# 7021300Listed by: FATHOM REALTY ELITE $34,444Active1 beds 1 baths688 sq. ft.
205 W Bell Road #137, Phoenix, AZ 85023
MLS# 7021116Listed by: WEST USA REALTY $420,000Pending4 beds 2 baths1,585 sq. ft.
2425 W Shady Glen Avenue, Phoenix, AZ 85023
MLS# 7021051Listed by: HOMEPROS $775,000Active4 beds 2 baths2,038 sq. ft.
919 W Port Royale Lane, Phoenix, AZ 85023
MLS# 7020868Listed by: AT HOME REAL ESTATE ARIZONA $426,000Active3 beds 2 baths1,997 sq. ft.
2402 W Anderson Avenue, Phoenix, AZ 85023
MLS# 7020441Listed by: OPENDOOR BROKERAGE, LLC $278,845Active3 beds 3 baths1,564 sq. ft.
15650 N 19th Avenue #1194, Phoenix, AZ 85023
MLS# 7020302Listed by: REAL BROKER $1,883,000Pending6 beds 6 baths4,900 sq. ft.
14845 N 15th Drive, Phoenix, AZ 85023
MLS# 7020172Listed by: RUSS LYON SOTHEBY'S INTERNATIONAL REALTY $450,000Pending3 beds 2 baths1,802 sq. ft.
2029 W Coolbrook Avenue, Phoenix, AZ 85023
MLS# 7019480Listed by: REALTY ONE GROUP $175,000Active2 beds 2 baths914 sq. ft.
14203 N 19th Avenue #2012, Phoenix, AZ 85023
MLS# 7018972Listed by: EXP REALTY $320,000Active3 beds 2 baths1,068 sq. ft.
17457 N 14th Avenue, Phoenix, AZ 85023
MLS# 7018823Listed by: OPENDOOR BROKERAGE, LLC $629,000Active4 beds 2 baths2,133 sq. ft.
15622 N 13th Avenue, Phoenix, AZ 85023
MLS# 7017560Listed by: REALTY USA SOUTHWEST $439,000Active2 beds 3 baths1,525 sq. ft.
430 W Tierra Buena Lane, Phoenix, AZ 85023
MLS# 7016304Listed by: KELLER WILLIAMS REALTY PHOENIX $600,000Active3 beds 2 baths1,818 sq. ft.
14444 N 17th Avenue, Phoenix, AZ 85023
MLS# 7016260Listed by: EXP REALTY $155,000Active1 beds 1 baths672 sq. ft.
17227 N 16th Drive #6, Phoenix, AZ 85023
MLS# 7014980Listed by: HOMESMART $65,000Active2 beds 2 baths1,056 sq. ft.
16622 N 1st Drive, Phoenix, AZ 85023
MLS# 7015119Listed by: EXP REALTY $529,900Active4 beds 2 baths1,982 sq. ft.
1710 W Banff Lane, Phoenix, AZ 85023
MLS# 7014619Listed by: SKIDMORE REALTY & PROPERTY MGT $265,000Active2 beds 2 baths1,117 sq. ft.
2436 W Caribbean Lane #1, Phoenix, AZ 85023
MLS# 7014083Listed by: REALTY ONE GROUP $15,000Pending2 beds 2 baths1,248 sq. ft.
205 W Bell Road #35, Phoenix, AZ 85023
MLS# 7012552Listed by: WEST USA REALTY $1,299,000Active3 beds 4 baths3,575 sq. ft.
14436 N Coral Gables Drive, Phoenix, AZ 85023
MLS# 7012414Listed by: MY HOME GROUP REAL ESTATE $585,000Pending4 beds 2 baths2,045 sq. ft.
1633 W Evans Drive, Phoenix, AZ 85023
MLS# 7009124Listed by: GOOD OAK REAL ESTATE $25,000Pending2 beds 2 baths1,440 sq. ft.
16808 N 1st Avenue #39, Phoenix, AZ 85023
MLS# 7008574Listed by: EXP REALTY $1,850,000Pending5 beds 5 baths5,382 sq. ft.
14624 N 15th Drive, Phoenix, AZ 85023
MLS# 7007803Listed by: RE/MAX EXCALIBUR $400,000Pending3 beds 2 baths1,507 sq. ft.
232 W Villa Maria Drive, Phoenix, AZ 85023
MLS# 7007520Listed by: CITIEA $435,000Pending4 beds 2 baths1,601 sq. ft.
14643 N 25th Avenue, Phoenix, AZ 85023
MLS# 7006909Listed by: REALTY EXECUTIVES ARIZONA TERRITORY $370,000Active4 beds 3 baths1,584 sq. ft.
16063 N 26th Avenue, Phoenix, AZ 85023
MLS# 7005574Listed by: HOMESMART $374,000Active3 beds 2 baths1,353 sq. ft.
17617 N 17th Lane, Phoenix, AZ 85023
MLS# 7004107Listed by: PROPERTY MANAGEMENT REAL ESTATE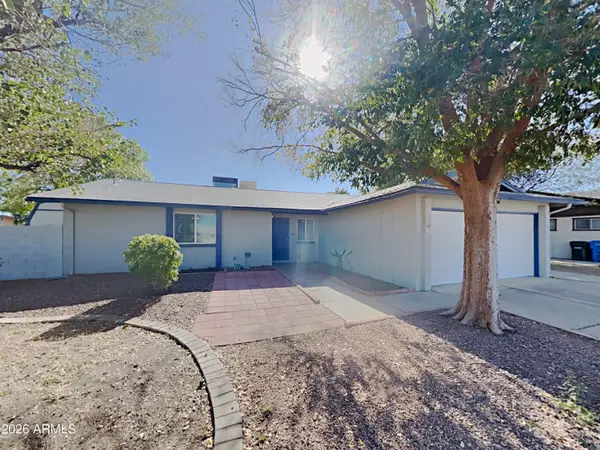 $410,000Active3 beds 2 baths1,699 sq. ft.
1001 W Villa Rita Drive, Phoenix, AZ 85023
MLS# 7004050Listed by: MY HOME GROUP REAL ESTATE $530,000Active3 beds 2 baths1,553 sq. ft.
601 W Kings Avenue, Phoenix, AZ 85023
MLS# 7003674Listed by: LIMITLESS REAL ESTATE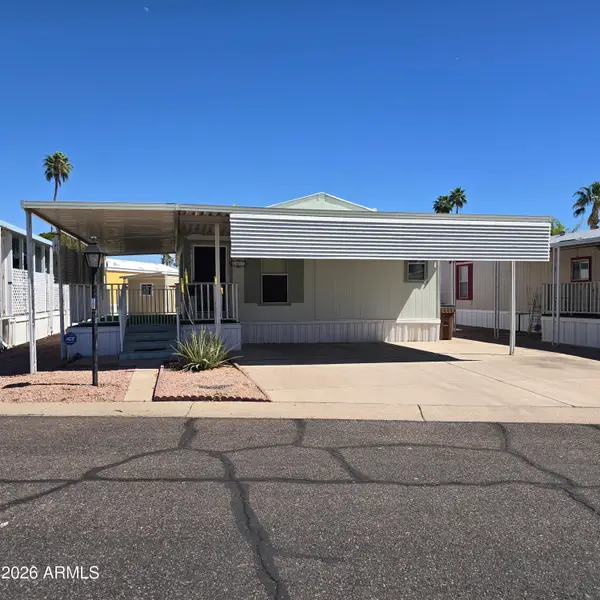 $68,900Active2 beds 2 baths1,056 sq. ft.
205 W Bell Road #131, Phoenix, AZ 85023
MLS# 7003394Listed by: WEST USA REALTY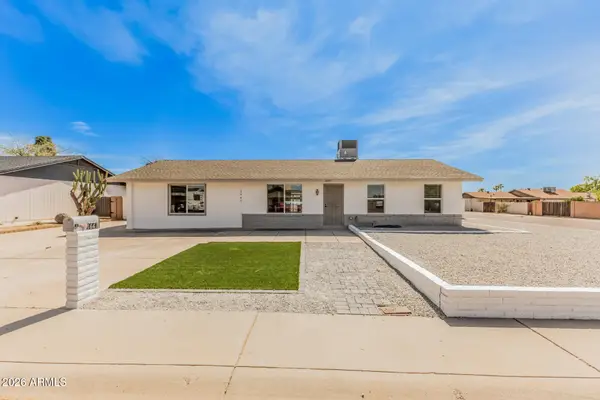 $499,800Pending4 beds 3 baths2,463 sq. ft.
1647 W Villa Rita Drive, Phoenix, AZ 85023
MLS# 7001592Listed by: MY HOME GROUP REAL ESTATE $649,999Active3 beds 3 baths2,384 sq. ft.
724 W Sandra Terrace, Phoenix, AZ 85023
MLS# 7001466Listed by: HOMESMART $498,000Pending3 beds 2 baths1,838 sq. ft.
16025 N 7th Drive, Phoenix, AZ 85023
MLS# 7000950Listed by: HOMESMART $1,150,000Active4 beds 3 baths3,506 sq. ft.
15023 N 15th Avenue, Phoenix, AZ 85023
MLS# 7000724Listed by: REALTY ONE GROUP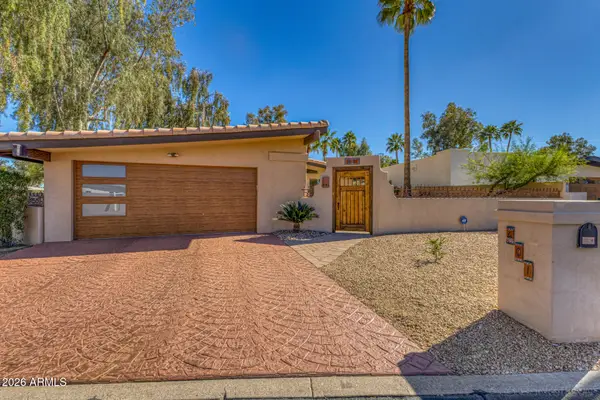 $629,000Active3 beds 2 baths1,998 sq. ft.
601 W Gibraltar Lane, Phoenix, AZ 85023
MLS# 7000306Listed by: SUCCESS PROPERTY BROKERS $29,000Active3 beds 2 baths1,536 sq. ft.
16810 N 2nd Drive #269, Phoenix, AZ 85023
MLS# 6997958Listed by: EXP REALTY $1,275,000Pending4 beds 3 baths3,373 sq. ft.
813 W Gleneagles Drive, Phoenix, AZ 85023
MLS# 6996968Listed by: EXP REALTY $395,000Active3 beds 2 baths2,284 sq. ft.
15433 N 17th Drive, Phoenix, AZ 85023
MLS# 6995427Listed by: COLDWELL BANKER REALTY
 $459,900Active4 beds 2 baths1,633 sq. ft.
2317 W Port Au Prince Lane, Phoenix, AZ 85023
MLS# 6994887Listed by: CENTURY 21 ARIZONA FOOTHILLS $424,900Pending3 beds 3 baths1,871 sq. ft.
2130 W Le Marche Avenue, Phoenix, AZ 85023
MLS# 6994069Listed by: MY HOME GROUP REAL ESTATE $539,900Active3 beds 2 baths1,709 sq. ft.
1722 W Saint Moritz Lane, Phoenix, AZ 85023
MLS# 6992865Listed by: PRESTIGE REALTY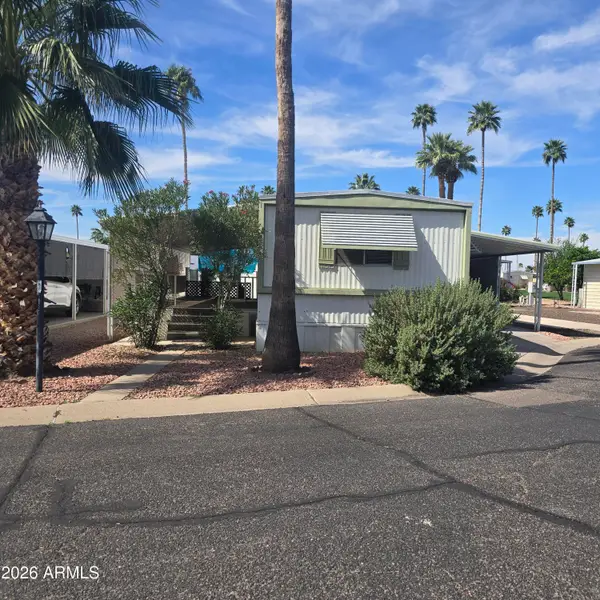 $18,500Active2 beds 2 baths896 sq. ft.
16622 N 1st Avenue #88, Phoenix, AZ 85023
MLS# 6992192Listed by: WEST USA REALTY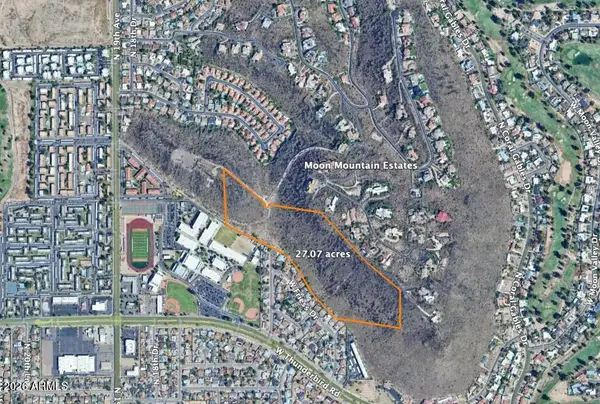 $899,000Active27.07 Acres
0 N 19th Avenue, Phoenix, AZ 85023
MLS# 6990694Listed by: CITY TO CITY COMMERCIAL $560,000Active4 beds 3 baths2,106 sq. ft.
15873 N 11th Avenue, Phoenix, AZ 85023
MLS# 6990313Listed by: RUSS LYON SOTHEBY'S INTERNATIONAL REALTY $419,500Active5 beds 2 baths1,657 sq. ft.
17607 N 15th Avenue, Phoenix, AZ 85023
MLS# 6988173Listed by: REALTY ONE GROUP $15,000Active2 beds 2 baths1,056 sq. ft.
205 W Bell Road #249, Phoenix, AZ 85023
MLS# 6986494Listed by: WEST USA REALTY $18,000Active2 beds 1 baths896 sq. ft.
205 W Bell Road #225, Phoenix, AZ 85023
MLS# 6984979Listed by: WEST USA REALTY $389,990Pending3 beds 2 baths2,128 sq. ft.
1521 W Thunderbird Road, Phoenix, AZ 85023
MLS# 6982713Listed by: REAL BROKER $219,999Active2 beds 1 baths840 sq. ft.
17241 N 16th Drive #10, Phoenix, AZ 85023
MLS# 6982239Listed by: JASON MITCHELL REAL ESTATE $210,000Active2 beds 2 baths927 sq. ft.
14203 N 19th Avenue #1018, Phoenix, AZ 85023
MLS# 6980442Listed by: FATHOM REALTY ELITE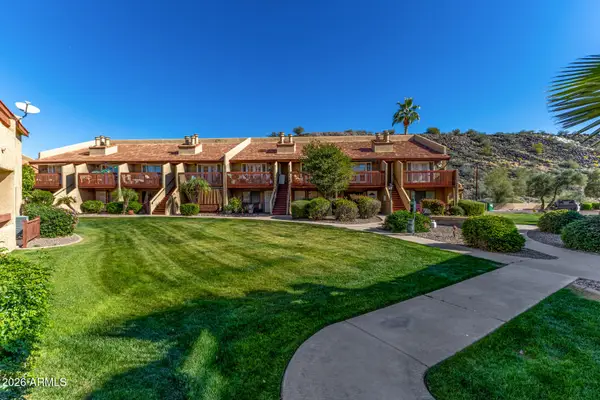 $200,000Active1 beds 1 baths579 sq. ft.
14203 N 19th Avenue #2040, Phoenix, AZ 85023
MLS# 6980021Listed by: REALTY ONE GROUP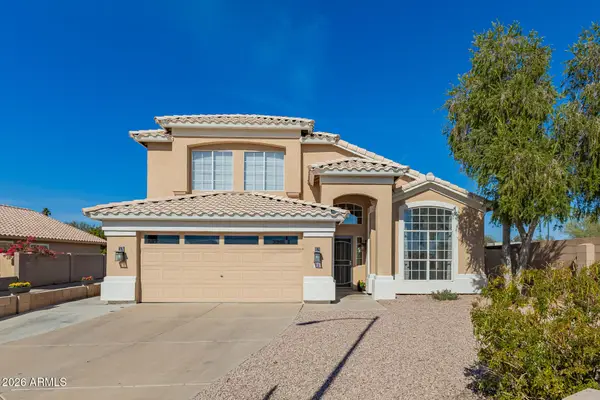 $549,999Active4 beds 3 baths2,330 sq. ft.
1002 W Kelton Lane, Phoenix, AZ 85023
MLS# 6978668Listed by: RE/MAX FINE PROPERTIES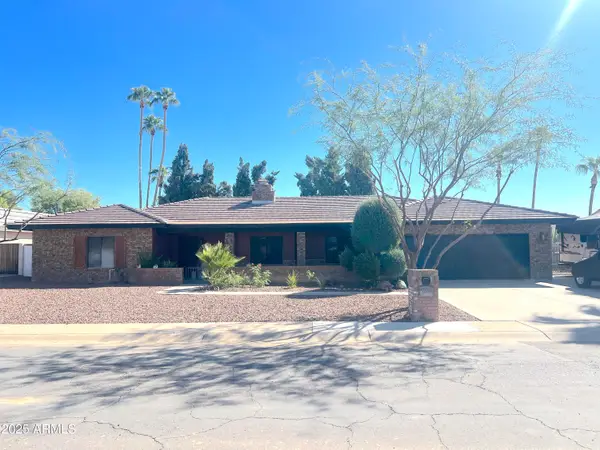 $849,000Active4 beds 3 baths3,480 sq. ft.
16213 N 1st Avenue, Phoenix, AZ 85023
MLS# 6974310Listed by: HOMESMART $935,000Active4 beds 5 baths3,688 sq. ft.
1642 W Mandalay Lane, Phoenix, AZ 85023
MLS# 6989863Listed by: POLLY MITCHELL GLOBAL REALTY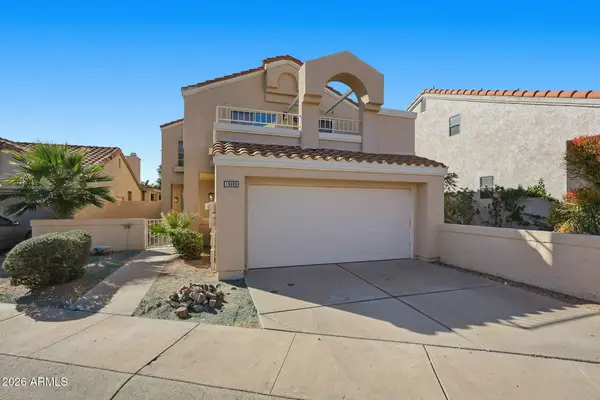 $509,900Active3 beds 3 baths1,925 sq. ft.
16008 N 4th Avenue, Phoenix, AZ 85023
MLS# 6973353Listed by: KELLER WILLIAMS REALTY PHOENIX $429,000Active3 beds 3 baths1,655 sq. ft.
1937 W Davis Road, Phoenix, AZ 85023
MLS# 6972192Listed by: WEST USA REALTY $225,000Active2 beds 2 baths927 sq. ft.
14203 N 19th Avenue #1038, Phoenix, AZ 85023
MLS# 6971973Listed by: MY HOME GROUP REAL ESTATE $639,900Active4 beds 3 baths2,351 sq. ft.
15469 N 13th Avenue, Phoenix, AZ 85023
MLS# 7002046Listed by: RETSY $425,000Pending3 beds 2 baths1,643 sq. ft.
1955 W Shady Glen Avenue, Phoenix, AZ 85023
MLS# 6966655Listed by: EXP REALTY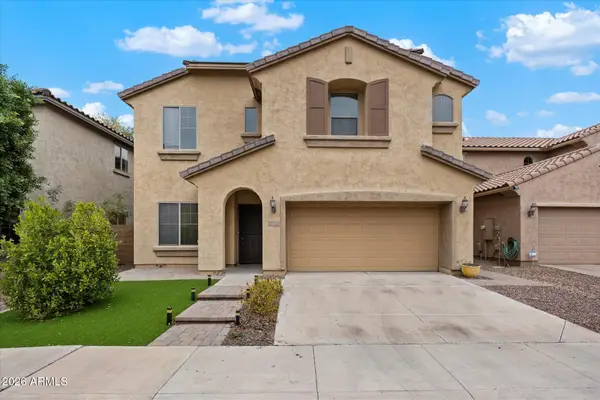 $525,000Active3 beds 3 baths2,236 sq. ft.
2138 W Marconi Avenue, Phoenix, AZ 85023
MLS# 6965747Listed by: REALTY EXECUTIVES ARIZONA TERRITORY $739,999Active4 beds 2 baths2,048 sq. ft.
802 W Caribbean Lane, Phoenix, AZ 85023
MLS# 6965589Listed by: GOOD OAK REAL ESTATE $512,000Active3 beds 3 baths1,689 sq. ft.
1112 W Villa Maria Drive, Phoenix, AZ 85023
MLS# 6955025Listed by: REALTY ONE GROUP $430,000Active4 beds 2 baths1,843 sq. ft.
14640 N 23rd Avenue, Phoenix, AZ 85023
MLS# 6953267Listed by: TOP PROPERTY SHOP $370,500Active3 beds 2 baths1,248 sq. ft.
17234 N 15th Avenue, Phoenix, AZ 85023
MLS# 6943509Listed by: 1912 REALTY $320,000Active3 beds 3 baths1,602 sq. ft.
15201 N 25th Drive #11, Phoenix, AZ 85023
MLS# 7000518Listed by: ENGEL & VOELKERS SCOTTSDALE $499,000Active1.37 Acres
14802 N 15th 6 And 7 Drive #6 and 7, Phoenix, AZ 85023
MLS# 6932294Listed by: KELLER WILLIAMS REALTY SONORAN LIVING $555,000Pending4 beds 3 baths2,048 sq. ft.
2344 W Marconi Avenue, Phoenix, AZ 85023
MLS# 6930144Listed by: STAYING GREEN REALTY LLC $64,999Active3 beds 2 baths1,200 sq. ft.
15601 N 19th Avenue #139, Phoenix, AZ 85023
MLS# 6927104Listed by: AMERICAN FREEDOM REALTY $409,000Active3 beds 2 baths1,415 sq. ft.
2337 W Tierra Buena Lane, Phoenix, AZ 85023
MLS# 6922235Listed by: OPENDOOR BROKERAGE, LLC $347,000Pending3 beds 1 baths1,130 sq. ft.
17614 N 16th Avenue, Phoenix, AZ 85023
MLS# 6916102Listed by: WEST USA REALTY $85,000Active3 beds 2 baths1,200 sq. ft.
15601 N 19th Avenue #203, Phoenix, AZ 85023
MLS# 6907261Listed by: AMERICAN FREEDOM REALTY $599,900Active4 beds 3 baths2,111 sq. ft.
1018 W Kings Avenue, Phoenix, AZ 85023
MLS# 6652715Listed by: REALTY ONE GROUP $345,000Active3 beds -- baths
14872 N 24th Drive #4, Phoenix, AZ 85023
MLS# 6640900Listed by: REALTY ONE GROUP $600,000Active4 beds -- baths
2427 W Hearn Road, Phoenix, AZ 85023
MLS# 6607894Listed by: LONG REALTY THE FOX GROUP
Local realty services provided by:CENTURY 21 Toma Partners
Popular searches near 85023
Popular neighborhoods near 85023
- Arrowhead Lakes, Glendale homes for sale
- Bell/Greenway Neighborhood, Glendale homes for sale
- Bellair, Glendale homes for sale
- Deer Valley, Phoenix homes for sale
- Greenbrier, Glendale homes for sale
- Lake Biltmore Village, Phoenix homes for sale
- Miramonte, Glendale homes for sale
- Moon Valley, Phoenix homes for sale
- New Northtown, Phoenix homes for sale
- North Mountain, Phoenix homes for sale
- Paradise Valley Oasis, Phoenix homes for sale
- Peoria Avenue, Glendale homes for sale
- Pioneer, Glendale homes for sale
- Pointe Tapatio, Phoenix homes for sale
- Royal Palms, Phoenix homes for sale
- Sahuaro, Glendale homes for sale
- Sweetwater Estates, Glendale homes for sale
- Thunderbird Palms, Glendale homes for sale
- Uptown Phoenix, Phoenix homes for sale
- Vista Income Estates, Phoenix homes for sale
Counties near Phoenix, 85023
Protect your home and budget from life's surprises with an Assurant Home Warranty, backed by a partner that supports you through every step of homeownership. Explore Plans.
©2026 Century 21 Real Estate LLC. All rights reserved. CENTURY 21®, the CENTURY 21 Logo and C21® are service marks owned by Century 21 Real Estate LLC. Century 21 Real Estate LLC fully supports the principles of the Fair Housing Act and the Equal Opportunity Act. Each office is independently owned and operated. Listing information is deemed reliable but not guaranteed accurate.