- Anthem homes for sale
- Carefree homes for sale
- Cave Creek homes for sale
- Deer Valley homes for sale
- El Mirage homes for sale
- Fountain Hills homes for sale
- Glendale homes for sale
- Guadalupe homes for sale
- New River homes for sale
- Paradise Valley homes for sale
- Peoria homes for sale
- Phoenix homes for sale
- Rio Verde homes for sale
- Scottsdale homes for sale
- Sun City homes for sale
- Sun City West homes for sale
- Surprise homes for sale
- Tempe homes for sale
- Tolleson homes for sale
- Youngtown homes for sale
85024, AZ - homes for sale
2 of 2 results displayed
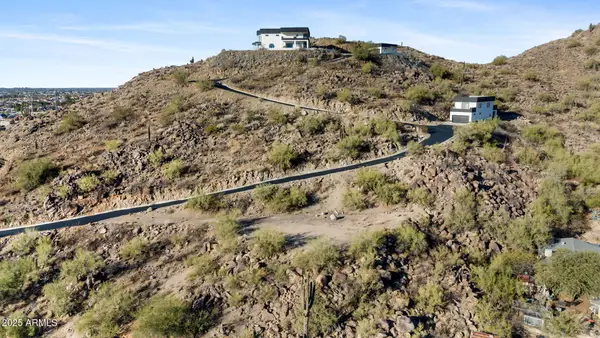 $325,000Active1.08 Acres
18908 N 22nd Street, Phoenix, AZ 85024
MLS# 6970768Listed by: COMPASS $349,000Active0.84 Acres
19844 N Cave Creek Road, Phoenix, AZ 85024
MLS# 6844895Listed by: WEST USA REALTY
Local realty services provided by:CENTURY 21 Arizona West
Popular searches near 85024
Popular neighborhoods near 85024
- Arabian Views, Scottsdale homes for sale
- Deer Valley, Phoenix homes for sale
- Desert Foothills, Scottsdale homes for sale
- Desert Ridge, Phoenix homes for sale
- Desert View, Phoenix homes for sale
- Dove Valley Ranch, Cave Creek homes for sale
- Grayhawk, Scottsdale homes for sale
- Kierland, Scottsdale homes for sale
- La Paz at Desert Springs, Scottsdale homes for sale
- Lone Mountain, Phoenix homes for sale
- Moon Valley, Phoenix homes for sale
- North Mountain, Phoenix homes for sale
- Paradise Valley Oasis, Phoenix homes for sale
- Paradise Valley Village, Phoenix homes for sale
- Pointe Tapatio, Phoenix homes for sale
- Silverstone, Scottsdale homes for sale
- Sonoran Foothills, Phoenix homes for sale
- Stetson Hills, Phoenix homes for sale
- Tatum Ranch, Cave Creek homes for sale
- Triple Crown, Scottsdale homes for sale
Counties near Phoenix, 85024
Protect your home and budget from life's surprises with an Assurant Home Warranty, backed by a partner that supports you through every step of homeownership. Explore Plans.
©2026 Century 21 Real Estate LLC. All rights reserved. CENTURY 21®, the CENTURY 21 Logo and C21® are service marks owned by Century 21 Real Estate LLC. Century 21 Real Estate LLC fully supports the principles of the Fair Housing Act and the Equal Opportunity Act. Each office is independently owned and operated. Listing information is deemed reliable but not guaranteed accurate.