- Apache Junction homes for sale
- Chandler homes for sale
- Florence homes for sale
- Fountain Hills homes for sale
- Gilbert homes for sale
- Gold Canyon homes for sale
- Komatke homes for sale
- Maricopa homes for sale
- Mesa homes for sale
- Paradise Valley homes for sale
- Phoenix homes for sale
- Queen Creek homes for sale
- Queen Creek homes for sale
- Queen Valley homes for sale
- Rio Verde homes for sale
- Salt River homes for sale
- San Tan Valley homes for sale
- Scottsdale homes for sale
- Sun Lakes homes for sale
- Tempe homes for sale
85234, AZ - homes for sale
199 of 199 results displayed
- New
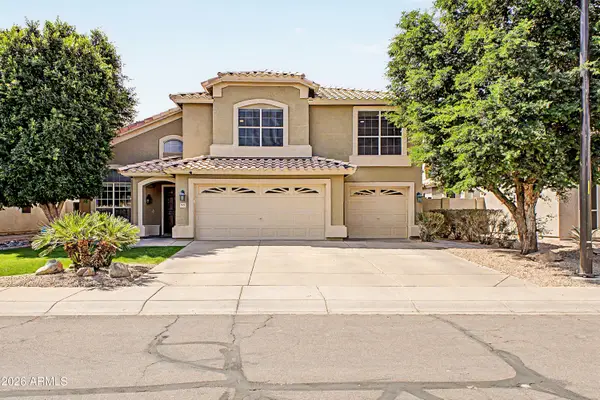
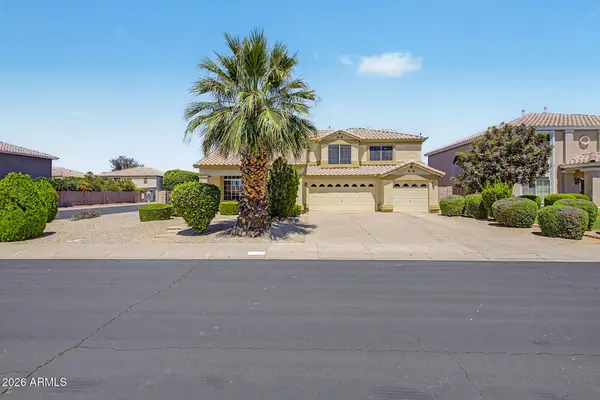
 $459,900Active4 beds 3 baths2,292 sq. ft.
515 N Citrus Lane, Gilbert, AZ 85234
MLS# 7018201Listed by: CITIEA - New
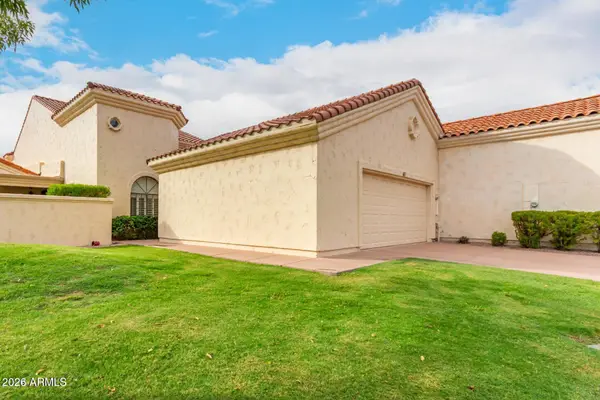
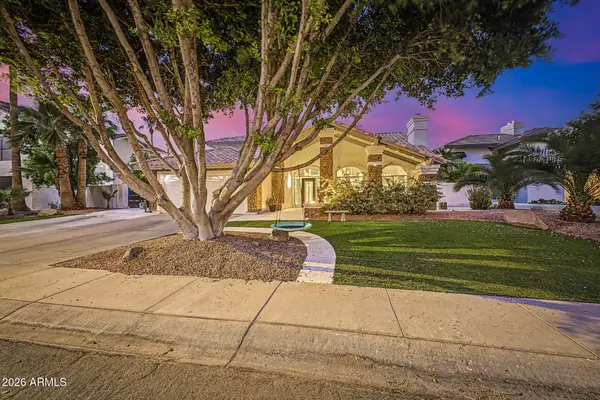 $1,410,000Active4 beds 3 baths2,658 sq. ft.
1734 E Queen Palm Drive, Gilbert, AZ 85234
MLS# 7018219Listed by: WEST USA REALTY - New
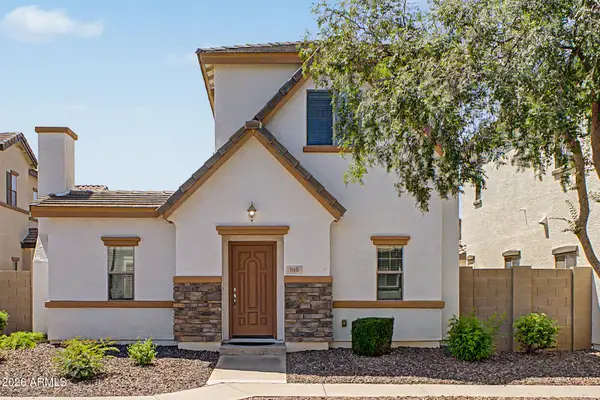
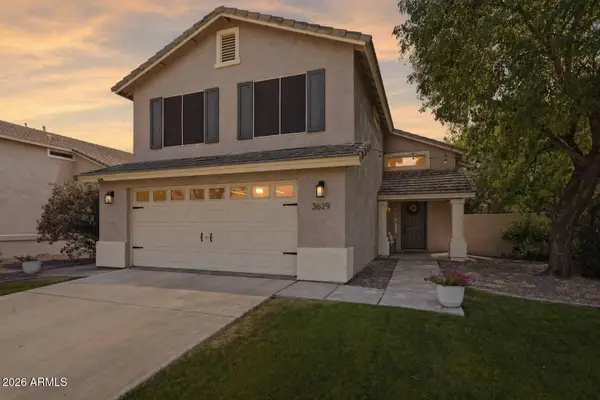 $529,999Active3 beds 3 baths1,506 sq. ft.
3629 E Park Avenue, Gilbert, AZ 85234
MLS# 7018328Listed by: SCHREINER REALTY - New
 $244,990Active1 beds 1 baths735 sq. ft.
1941 S Pierpont Drive #1122, Mesa, AZ 85206
MLS# 7018151Listed by: AR REALTY GROUP - New
 $620,000Active4 beds 3 baths2,653 sq. ft.
4659 E Harwell Street, Gilbert, AZ 85234
MLS# 7017777Listed by: WEST USA REALTY - New
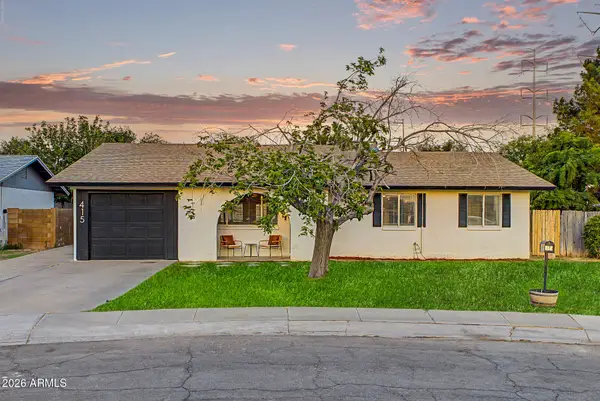 $650,000Active3 beds 2 baths1,310 sq. ft.
415 N Larkspur Street, Gilbert, AZ 85234
MLS# 7017782Listed by: WEST USA REALTY - New
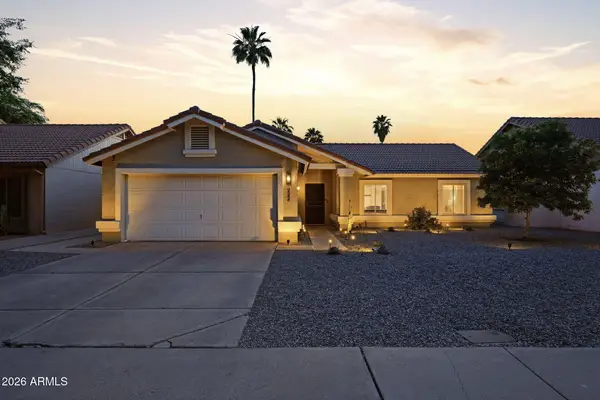 $515,000Active3 beds 2 baths1,410 sq. ft.
932 N Sailors Way, Gilbert, AZ 85234
MLS# 7017718Listed by: SCHREINER REALTY - New
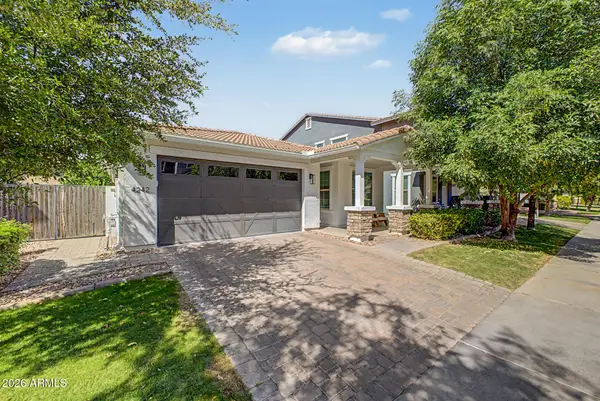 $600,000Active3 beds 2 baths1,773 sq. ft.
4242 E Rawhide Street, Gilbert, AZ 85296
MLS# 7017744Listed by: EXP REALTY - New
 $550,000Active4 beds 3 baths2,149 sq. ft.
4331 E Cullumber Street, Gilbert, AZ 85234
MLS# 7017598Listed by: CACTUS MOUNTAIN PROPERTIES, LLC - New
 $840,000Active5 beds 5 baths3,549 sq. ft.
3664 E Indigo Bay Court, Gilbert, AZ 85234
MLS# 7017532Listed by: CITIEA - New
 $810,000Active3 beds 3 baths2,944 sq. ft.
1700 E Lakeside Drive #63, Gilbert, AZ 85234
MLS# 7016851Listed by: HOMESMART LIFESTYLES 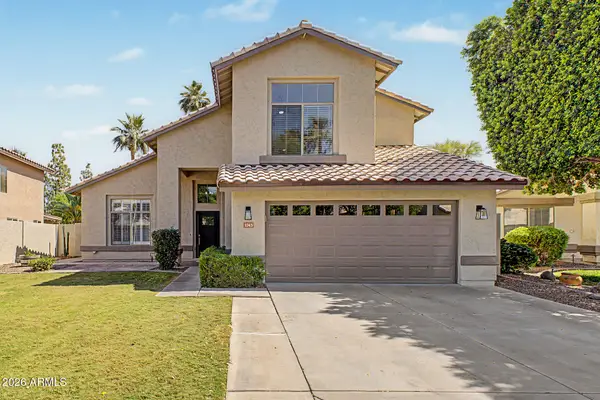 $659,900Pending5 beds 3 baths2,382 sq. ft.
1743 E Redfield Road, Gilbert, AZ 85234
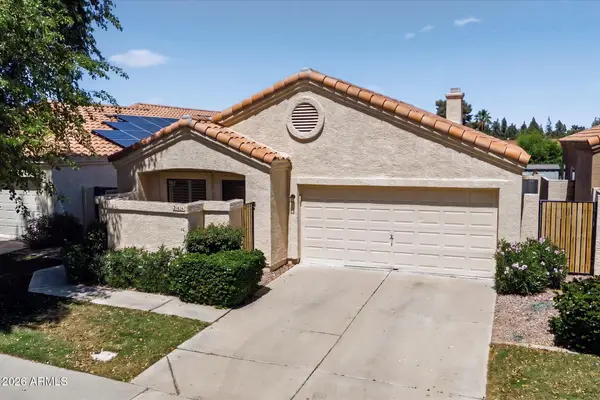
MLS# 7016250Listed by: MY HOME GROUP REAL ESTATE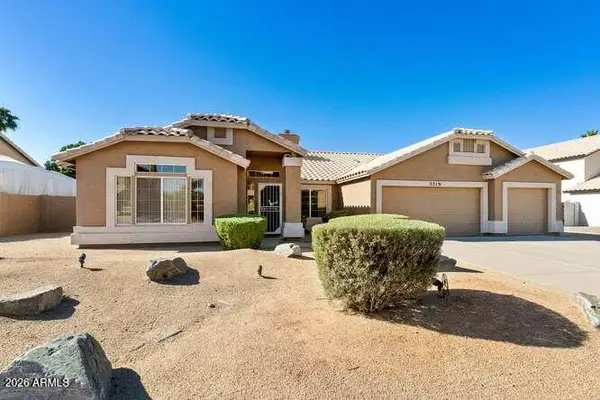 $645,000Pending4 beds 2 baths2,413 sq. ft.
2519 E Encinas Avenue, Gilbert, AZ 85234
MLS# 7016011Listed by: RE/MAX FINE PROPERTIES- New
 $519,900Active4 beds 2 baths1,954 sq. ft.
1134 N Saint Elena Street, Gilbert, AZ 85234
MLS# 7016035Listed by: MAINSTAY BROKERAGE - New
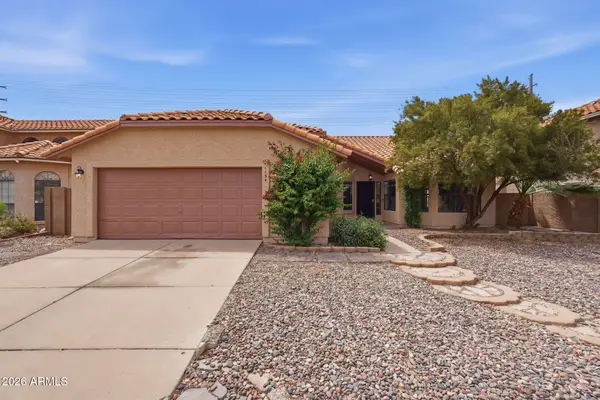
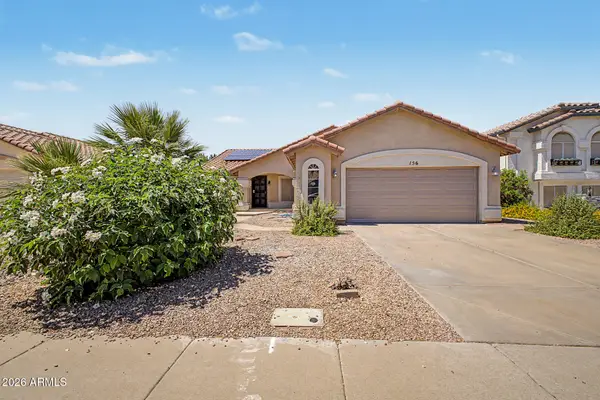 $480,000Active4 beds 2 baths1,802 sq. ft.
156 N Nielson Street, Gilbert, AZ 85234
MLS# 7015866Listed by: VIP FAMILY REALTY  $549,900Pending4 beds 3 baths2,085 sq. ft.
1752 E Tremaine Avenue, Gilbert, AZ 85234
MLS# 7015642Listed by: HOMESMART LIFESTYLES- New
 $1,525,000Active5 beds 4 baths2,836 sq. ft.
9401 S 157th Place, Gilbert, AZ 85234
MLS# 7015772Listed by: REALTY ONE GROUP - New
 $449,000Active2 beds 2 baths1,707 sq. ft.
246 E Vaughn Avenue, Gilbert, AZ 85234
MLS# 7015470Listed by: RE/MAX FINE PROPERTIES - New
 $715,000Active3 beds 2 baths2,231 sq. ft.
1217 N Sailors Way, Gilbert, AZ 85234
MLS# 7015255Listed by: SCHREINER REALTY - New
 $569,000Active3 beds 2 baths1,871 sq. ft.
1317 N Pebble Beach Drive, Gilbert, AZ 85234
MLS# 7015051Listed by: KELLER WILLIAMS INTEGRITY FIRST - New
 $569,000Active4 beds 3 baths2,152 sq. ft.
1542 E Stanford Avenue, Gilbert, AZ 85234
MLS# 7014606Listed by: W AND PARTNERS, LLC - New
 $720,000Active5 beds 3 baths2,733 sq. ft.
1694 E Campbell Avenue, Gilbert, AZ 85234
MLS# 7014575Listed by: INSTASOLD  $810,000Pending4 beds 3 baths2,715 sq. ft.
2927 E Washington Avenue, Gilbert, AZ 85234
MLS# 7014290Listed by: KELLER WILLIAMS REALTY PHOENIX- New
 $999,500Active5 beds 4 baths3,745 sq. ft.
2886 E Washington Avenue, Gilbert, AZ 85234
MLS# 7014062Listed by: RE/MAX FINE PROPERTIES - New
 $550,000Active3 beds 2 baths1,564 sq. ft.
4286 E Park Avenue, Gilbert, AZ 85234
MLS# 7013842Listed by: WEST USA REALTY 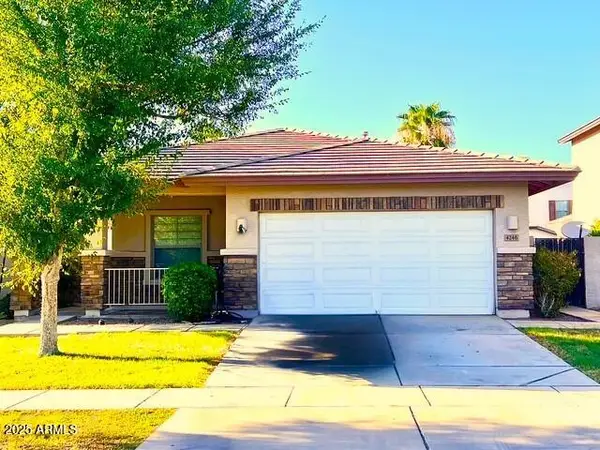 $495,000Active3 beds 2 baths1,608 sq. ft.
4246 E Cotton Court, Gilbert, AZ 85234
MLS# 7012859Listed by: PHOENIX REAL ESTATE GROUP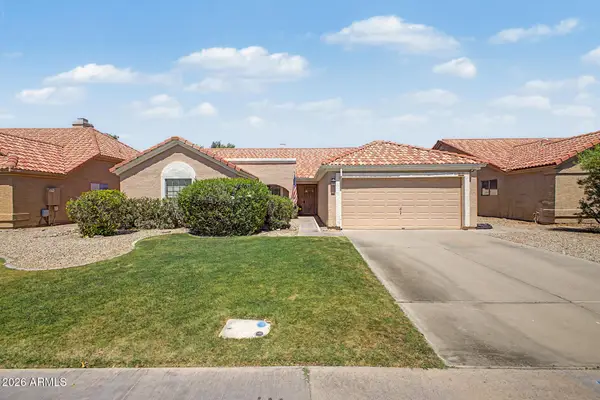 $498,000Active3 beds 2 baths1,896 sq. ft.
1238 E Mineral Road, Gilbert, AZ 85234
MLS# 7012571Listed by: REAL BROKER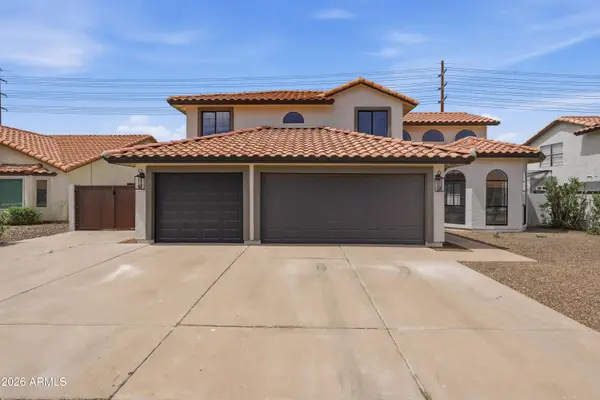 $735,000Pending4 beds 3 baths2,700 sq. ft.
858 N Saint Elena Street, Gilbert, AZ 85234
MLS# 7011942Listed by: MY HOME GROUP REAL ESTATE $949,000Active5 beds 4 baths3,945 sq. ft.
4080 E Laurel Avenue, Gilbert, AZ 85234
MLS# 7011847Listed by: CPL PROPERTIES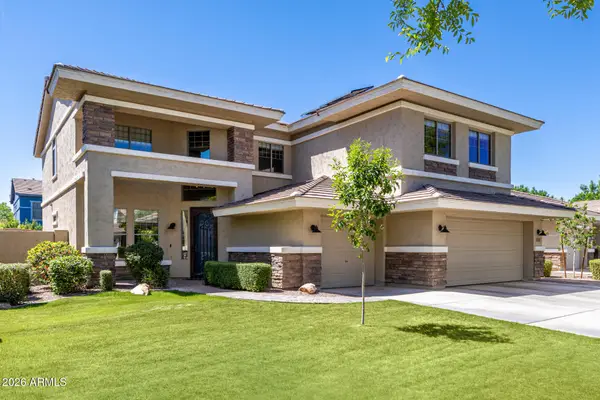 $925,000Pending5 beds 3 baths3,427 sq. ft.
4115 E Linda Lane, Gilbert, AZ 85234
MLS# 7011817Listed by: REALTY ONE GROUP $549,000Pending4 beds 3 baths2,126 sq. ft.
4280 E Bruce Court, Gilbert, AZ 85234
MLS# 7011569Listed by: ON Q PROPERTY MANAGEMENT $1,250,000Active4 beds 5 baths4,120 sq. ft.
1333 N Cliffside Drive, Gilbert, AZ 85234
MLS# 7011630Listed by: REAL BROKER $525,000Pending3 beds 2 baths1,655 sq. ft.
3838 E San Remo Avenue, Gilbert, AZ 85234
MLS# 7011634Listed by: KELLER WILLIAMS REALTY PHOENIX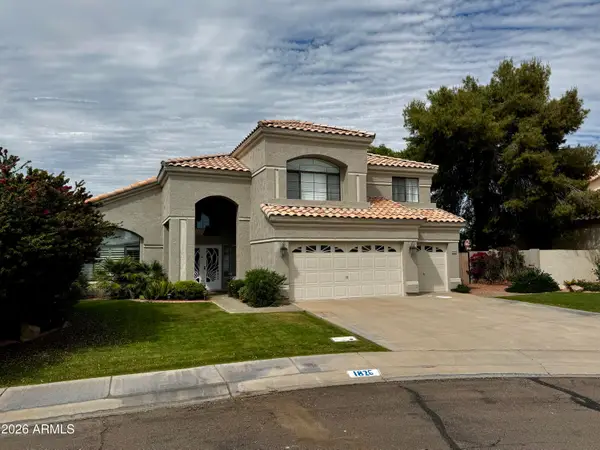 $1,100,000Pending4 beds 3 baths3,167 sq. ft.
1826 E Lakecrest Drive, Gilbert, AZ 85234
MLS# 7011303Listed by: KELLER WILLIAMS ARIZONA REALTY $2,299,999Active6 beds 5 baths5,731 sq. ft.
1318 E Treasure Cove Drive, Gilbert, AZ 85234
MLS# 7010987Listed by: THE AVE COLLECTIVE $375,000Pending3 beds 2 baths1,409 sq. ft.
811 E Linda Lane, Gilbert, AZ 85234
MLS# 7010605Listed by: LIMITLESS REAL ESTATE
 $949,900Pending6 beds 4 baths3,731 sq. ft.
1069 N Poinciana Road, Gilbert, AZ 85234
MLS# 7010477Listed by: CENTURY 21 ARIZONA FOOTHILLS $550,000Pending3 beds 2 baths1,696 sq. ft.
1566 N Rockwell Court, Gilbert, AZ 85234
MLS# 7010422Listed by: FIRST TEAM REAL ESTATE $265,000Active1 beds 1 baths673 sq. ft.
1633 E Lakeside Drive #58, Gilbert, AZ 85234
MLS# 7010380Listed by: REAL BROKER $1,950,000Pending4 beds 5 baths5,027 sq. ft.
2529 E Vaughn Court, Gilbert, AZ 85234
MLS# 7009846Listed by: REAL BROKER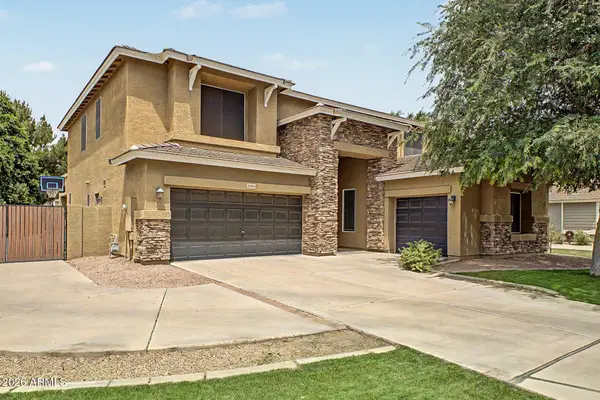 $900,000Active5 beds 4 baths3,371 sq. ft.
3094 E Cotton Lane, Gilbert, AZ 85234
MLS# 7009919Listed by: RE/MAX FINE PROPERTIES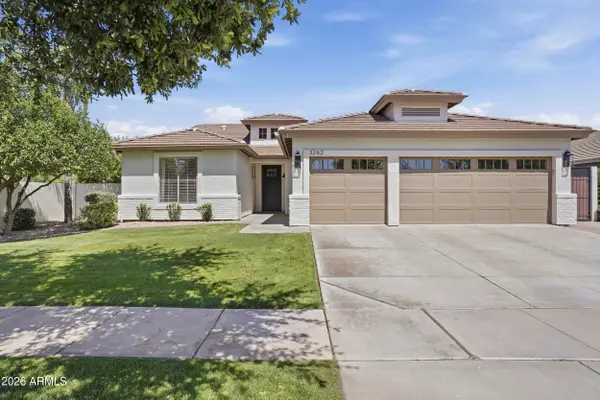 $689,900Pending3 beds 2 baths1,892 sq. ft.
3262 E Cotton Lane, Gilbert, AZ 85234
MLS# 7009472Listed by: REALTY ONE GROUP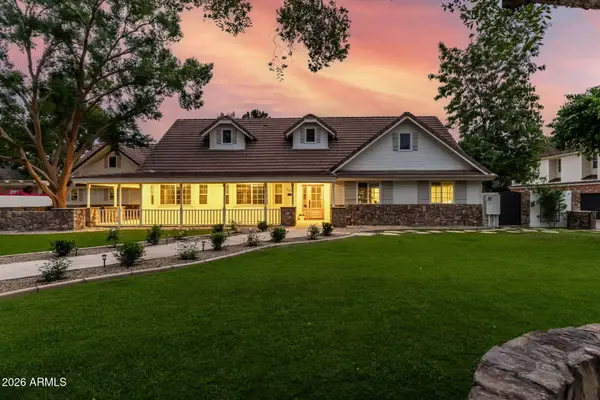 $2,000,000Pending5 beds 4 baths3,566 sq. ft.
701 E Encinas Avenue, Gilbert, AZ 85234
MLS# 7009455Listed by: REAL BROKER $519,000Active4 beds 2 baths1,784 sq. ft.
1139 N Granite Street, Gilbert, AZ 85234
MLS# 7008764Listed by: THE HOUSING PROFESSIONALS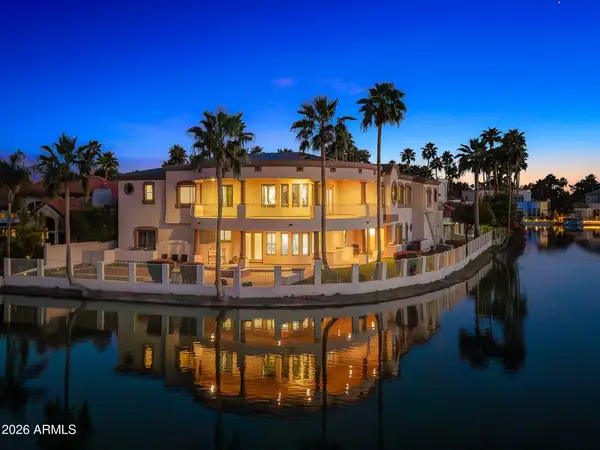 $3,250,000Active8 beds 9 baths11,319 sq. ft.
1402 E Coral Cove Drive, Gilbert, AZ 85234
MLS# 7008885Listed by: COMPASS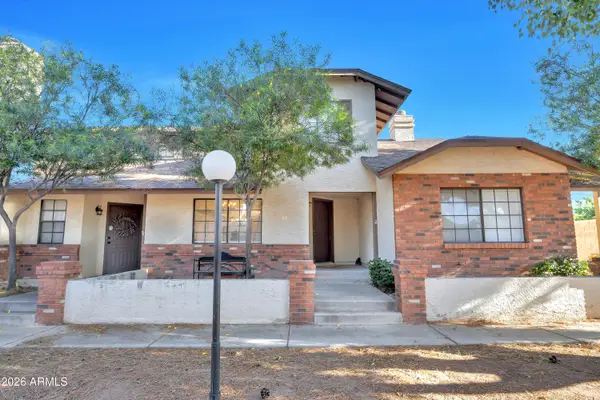 $369,950Pending3 beds 3 baths1,430 sq. ft.
170 E Guadalupe Road #88, Gilbert, AZ 85234
MLS# 7008653Listed by: FATHOM REALTY ELITE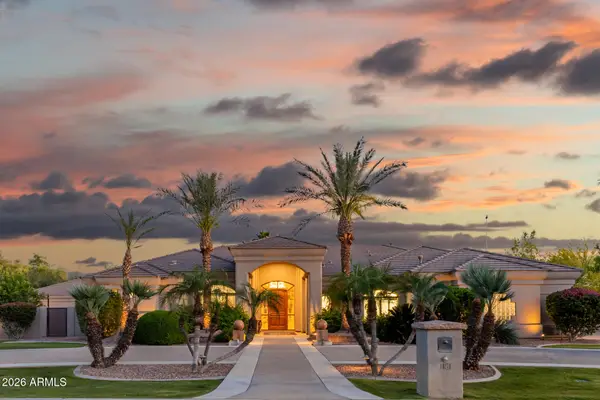 $2,299,000Active5 beds 5 baths4,164 sq. ft.
1181 E Melody Court, Gilbert, AZ 85234
MLS# 7008580Listed by: MAJESTIC REAL ESTATE & INVESTMENTS, INC.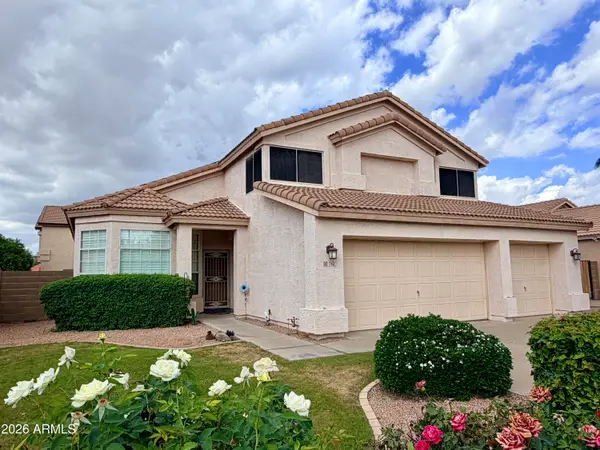 $597,000Active4 beds 3 baths2,658 sq. ft.
742 N Boulder Street, Gilbert, AZ 85234
MLS# 7008581Listed by: REALTY ONE GROUP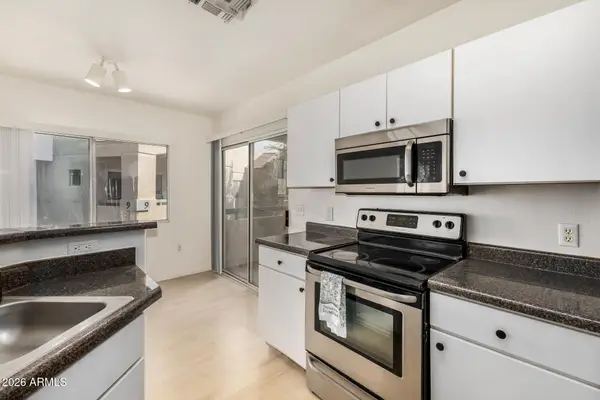 $290,000Active2 beds 2 baths947 sq. ft.
1295 N Ash Street #828, Gilbert, AZ 85233
MLS# 7007813Listed by: KELLER WILLIAMS INTEGRITY FIRST $649,999Active4 beds 2 baths2,245 sq. ft.
3869 E Washington Court, Gilbert, AZ 85234
MLS# 7007687Listed by: HOMESMART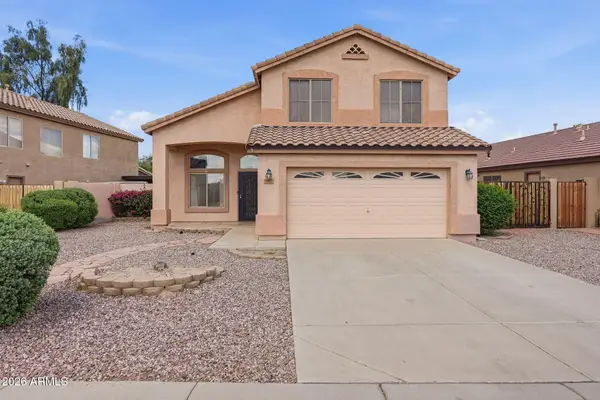 $618,000Pending4 beds 3 baths2,146 sq. ft.
3312 E San Remo Avenue, Gilbert, AZ 85234
MLS# 7007660Listed by: LPT REALTY, LLC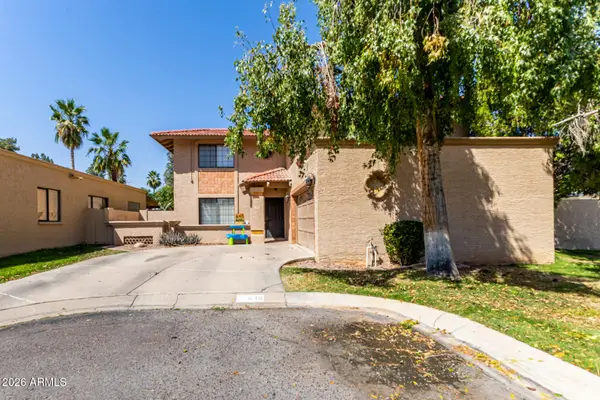 $534,900Active3 beds 3 baths2,302 sq. ft.
640 N Ironwood Way, Gilbert, AZ 85234
MLS# 7007064Listed by: AZ FLAT FEE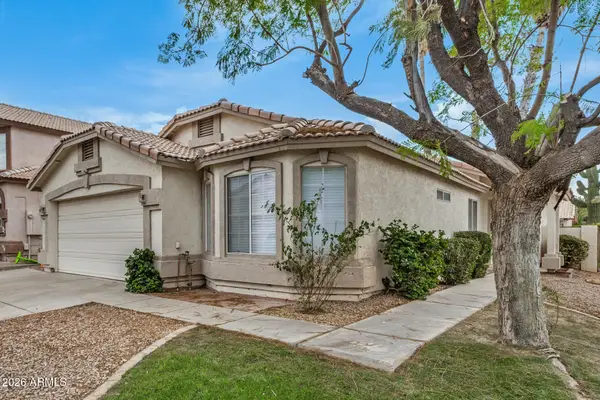 $425,000Active3 beds 2 baths1,326 sq. ft.
4505 E Scott Avenue, Gilbert, AZ 85234
MLS# 7006806Listed by: MY HOME GROUP REAL ESTATE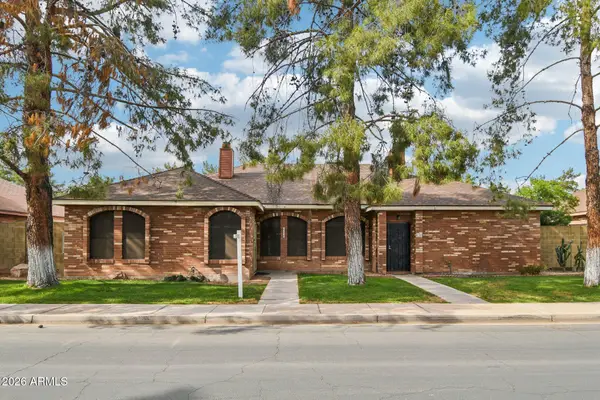 $465,000Pending3 beds 2 baths1,347 sq. ft.
830 E Bruce Avenue, Gilbert, AZ 85234
MLS# 7006151Listed by: W AND PARTNERS, LLC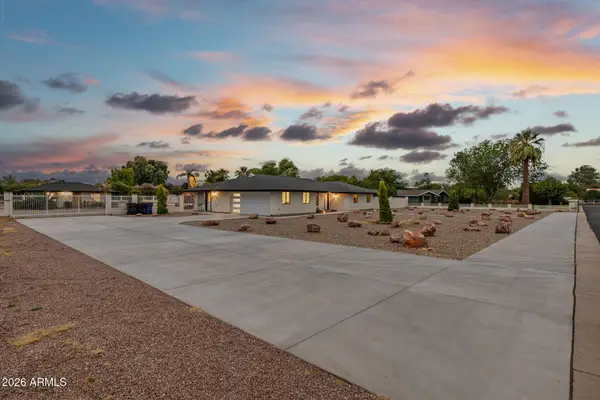 $1,694,999Pending8 beds 4 baths2,881 sq. ft.
803 E Melody Drive, Gilbert, AZ 85234
MLS# 7005659Listed by: REALTY ONE GROUP $650,000Pending5 beds 3 baths2,549 sq. ft.
1919 E Clipper Court, Gilbert, AZ 85234
MLS# 7005576Listed by: KELLER WILLIAMS INTEGRITY FIRST $550,000Pending4 beds 2 baths2,357 sq. ft.
231 N Cottonwood Drive, Gilbert, AZ 85234
MLS# 7005500Listed by: CAMBRIDGE PROPERTIES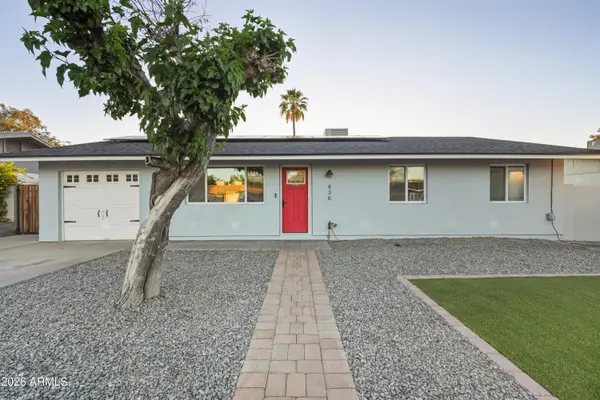 $485,000Pending3 beds 2 baths1,310 sq. ft.
436 N Larkspur Street, Gilbert, AZ 85234
MLS# 7005240Listed by: HOMESMART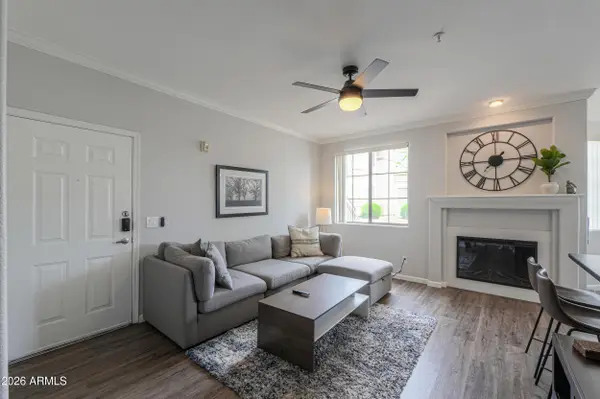 $320,000Active2 beds 2 baths1,056 sq. ft.
1941 S Pierpont Drive #1062, Mesa, AZ 85206
MLS# 7005306Listed by: REAL BROKER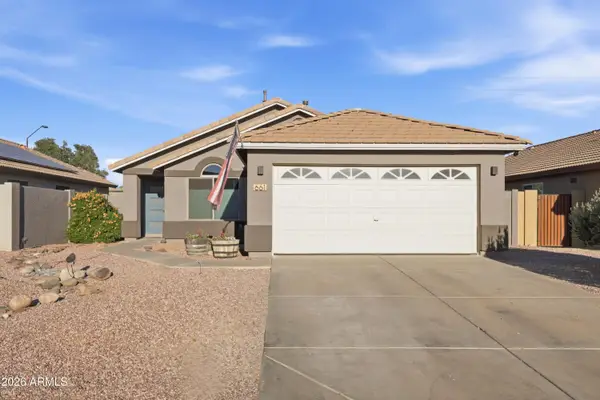 $529,900Active4 beds 2 baths1,489 sq. ft.
661 N Joshua Tree Lane, Gilbert, AZ 85234
MLS# 7005186Listed by: LPT REALTY, LLC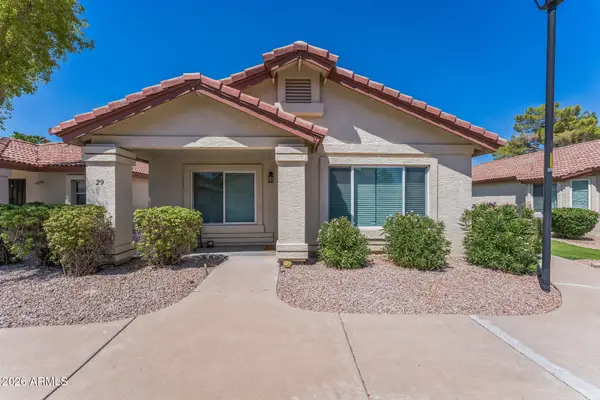 $389,500Active3 beds 2 baths1,176 sq. ft.
1120 N Val Vista Drive #29, Gilbert, AZ 85234
MLS# 7004480Listed by: HOMESMART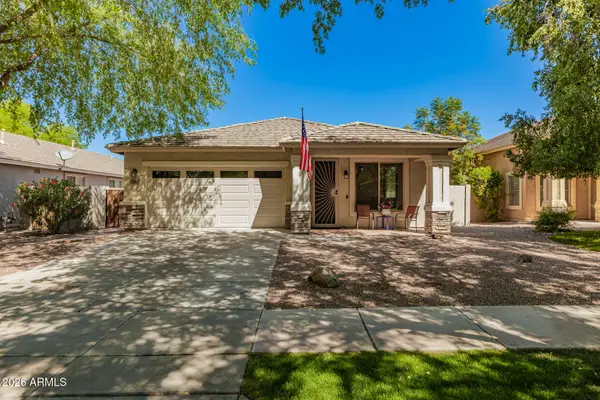 $565,000Active3 beds 2 baths1,699 sq. ft.
3568 E Bruce Avenue, Gilbert, AZ 85234
MLS# 7004529Listed by: WEST USA REALTY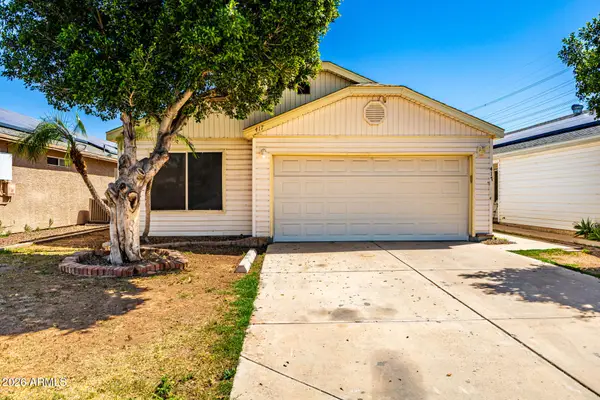 $425,000Pending3 beds 2 baths1,489 sq. ft.
417 N Shaylee Lane, Gilbert, AZ 85234
MLS# 7004464Listed by: E & G REAL ESTATE SERVICES $565,000Pending4 beds 2 baths1,706 sq. ft.
4290 E Palo Verde Street, Gilbert, AZ 85296
MLS# 7004366Listed by: RETSY $1,075,000Active5 beds 4 baths4,171 sq. ft.
3955 E Indigo Bay Court, Gilbert, AZ 85234
MLS# 7004192Listed by: LPT REALTY, LLC $535,000Pending4 beds 2 baths1,892 sq. ft.
408 E Meadows Lane, Gilbert, AZ 85234
MLS# 7003513Listed by: HOMESMART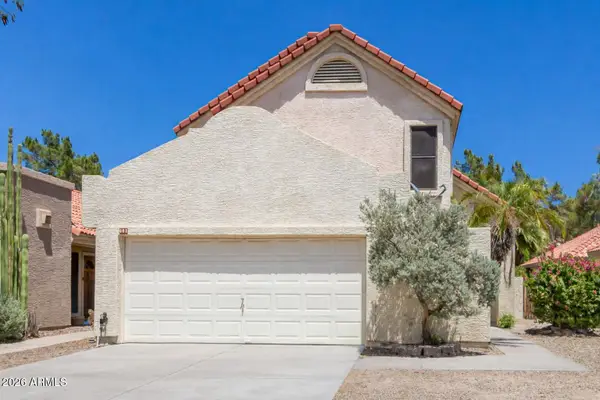 $525,000Active3 beds 3 baths1,754 sq. ft.
601 N Granite Street, Gilbert, AZ 85234
MLS# 7002793Listed by: VALLEY VIEWS RE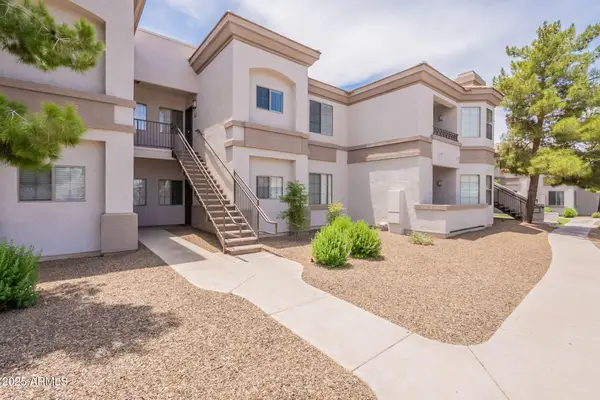 $265,000Active2 beds 2 baths1,023 sq. ft.
1941 S Pierpont Drive #2073, Mesa, AZ 85206
MLS# 7002407Listed by: EVOLUTION REAL ESTATE, LLC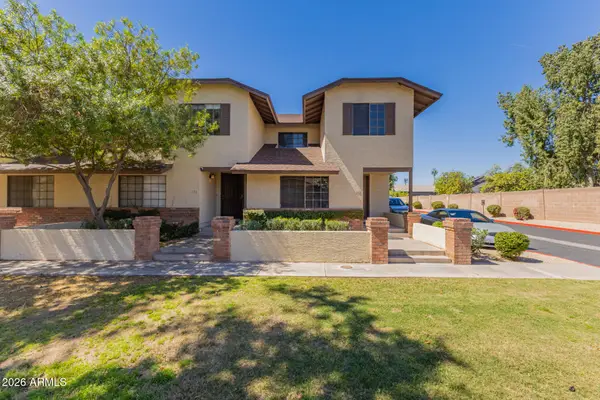 $364,900Active3 beds 3 baths1,535 sq. ft.
170 E Guadalupe Road #173, Gilbert, AZ 85234
MLS# 7002200Listed by: GOLD STANDARD REAL ESTATE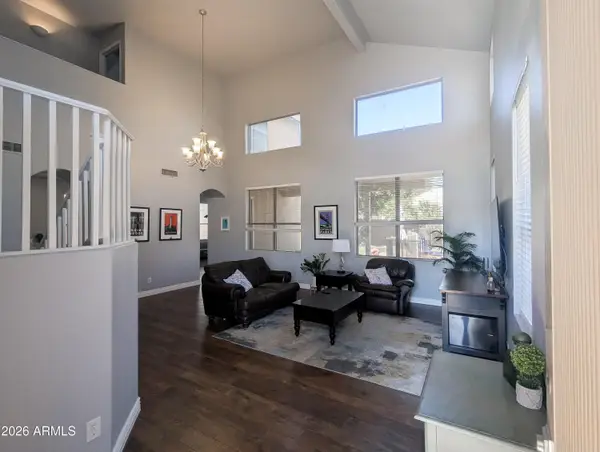 $565,000Pending4 beds 3 baths2,301 sq. ft.
3648 E Cody Avenue, Gilbert, AZ 85234
MLS# 7001700Listed by: SNOW REALTY & PROPERTY MANAGEMENT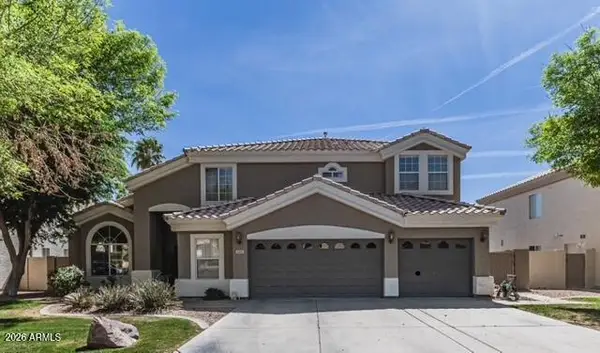 $744,900Pending5 beds 3 baths3,746 sq. ft.
4495 E Aspen Way, Gilbert, AZ 85234
MLS# 7001578Listed by: DELEX REALTY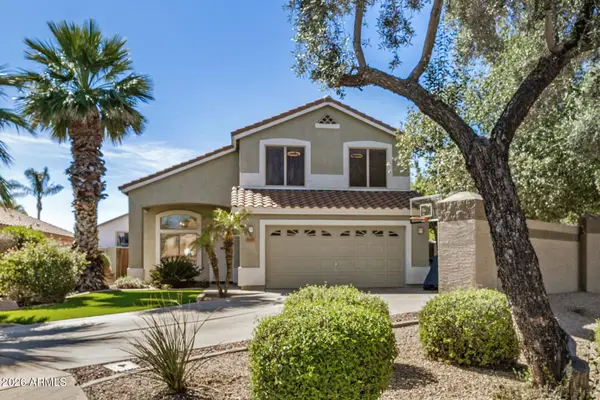 $615,000Pending4 beds 3 baths2,146 sq. ft.
3221 E San Remo Avenue, Gilbert, AZ 85234
MLS# 7001363Listed by: EXP REALTY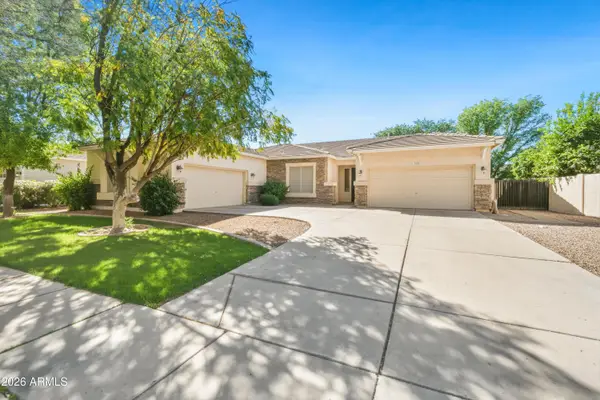 $730,000Pending3 beds 3 baths2,784 sq. ft.
2935 E Lexington Avenue, Gilbert, AZ 85234
MLS# 7001257Listed by: CALL REALTY, INC.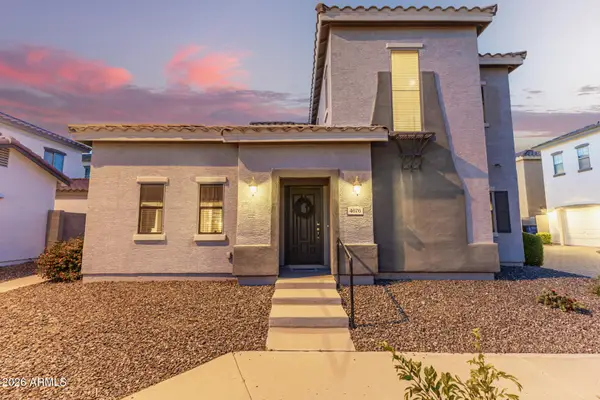 $365,000Active2 beds 3 baths1,164 sq. ft.
4676 E Redfield Road, Gilbert, AZ 85234
MLS# 7000948Listed by: MOMENTUM BROKERS LLC $549,900Active3 beds 2 baths1,832 sq. ft.
1141 E Bruce Avenue, Gilbert, AZ 85234
MLS# 7000714Listed by: DPR REALTY LLC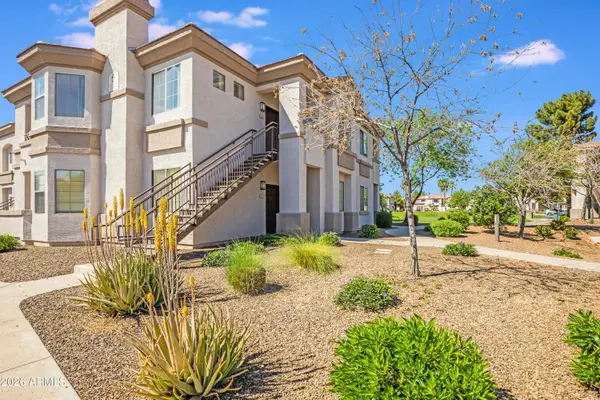 $275,000Active2 beds 2 baths1,056 sq. ft.
1941 S Pierpont Drive #2032, Mesa, AZ 85206
MLS# 7000533Listed by: EXP REALTY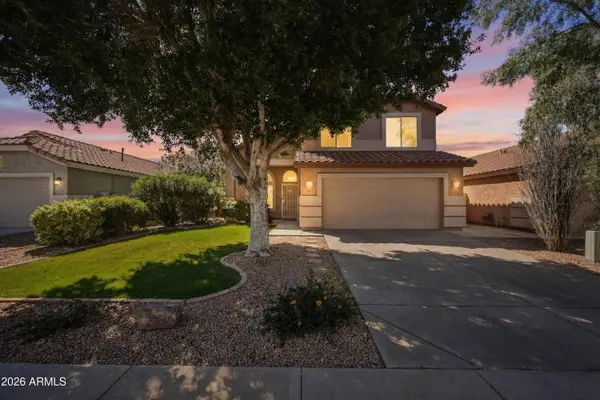 $599,999Active4 beds 3 baths2,146 sq. ft.
3165 E Desert Lane, Gilbert, AZ 85234
MLS# 7000310Listed by: KELLER WILLIAMS INTEGRITY FIRST $1,700,000Pending7 beds 5 baths5,974 sq. ft.
3638 E Tremaine Court, Gilbert, AZ 85234
MLS# 6999807Listed by: KELLER WILLIAMS REALTY PHOENIX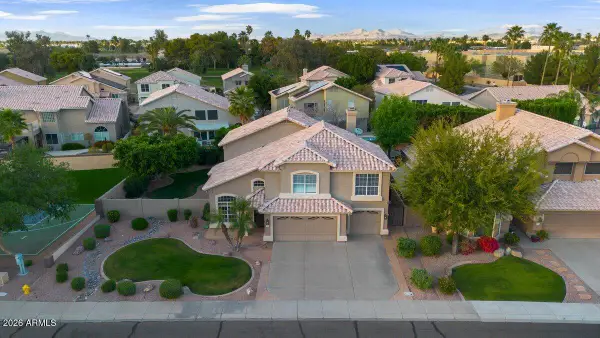 $699,999Active4 beds 3 baths2,376 sq. ft.
4658 E Kelly Drive, Gilbert, AZ 85234
MLS# 6999644Listed by: REALTY ONE GROUP $288,000Active2 beds 2 baths911 sq. ft.
1295 N Ash Street #817, Gilbert, AZ 85233
MLS# 6999740Listed by: COMPASS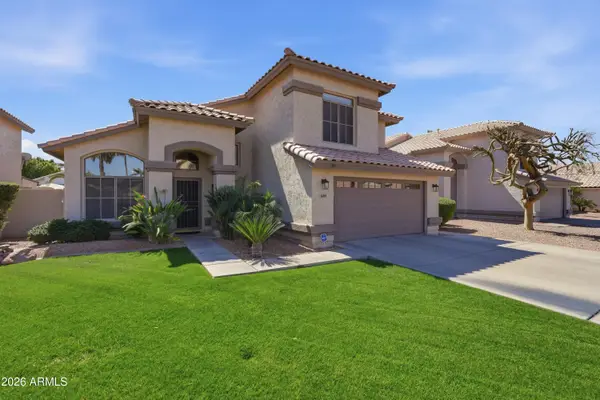 $558,000Pending4 beds 3 baths1,997 sq. ft.
1699 E Olive Avenue, Gilbert, AZ 85234
MLS# 6999434Listed by: COLDWELL BANKER REALTY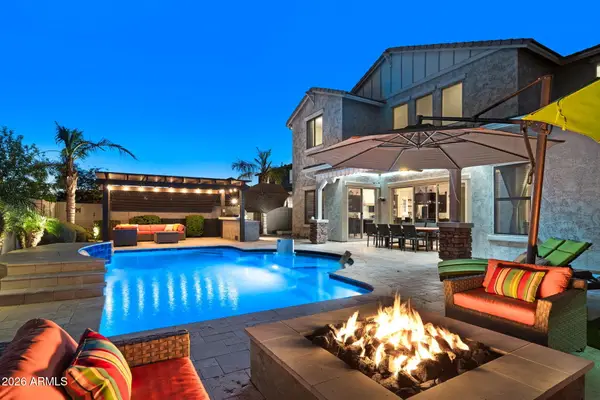 $1,300,000Active5 beds 4 baths4,633 sq. ft.
4269 E Sierra Madre Avenue, Gilbert, AZ 85296
MLS# 6999184Listed by: 72SOLD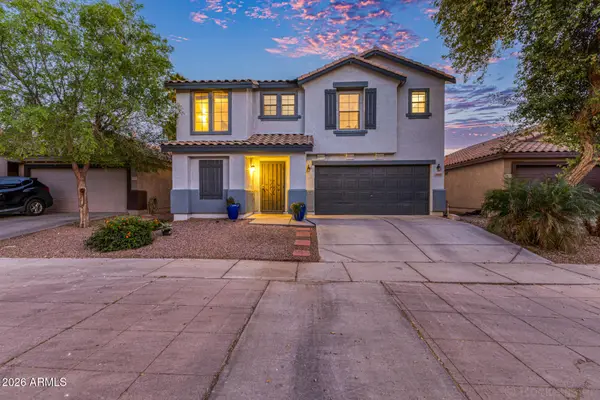 $519,900Active4 beds 3 baths2,267 sq. ft.
3033 E Santa Rosa Drive, Gilbert, AZ 85234
MLS# 6998925Listed by: EXP REALTY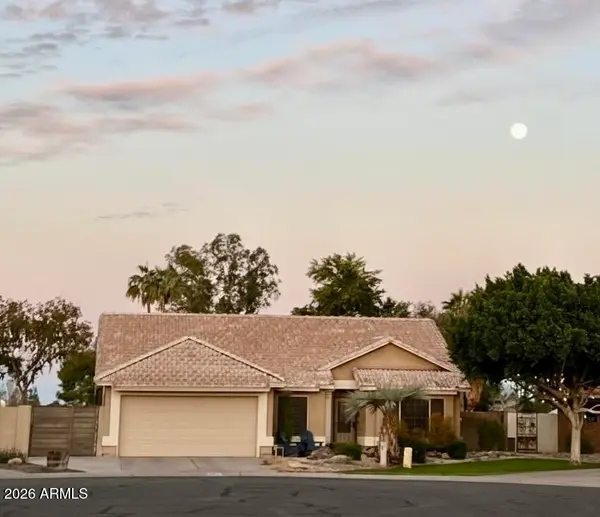 $550,000Pending4 beds 2 baths1,738 sq. ft.
401 E Merrill Avenue, Gilbert, AZ 85234
MLS# 6997928Listed by: PRESIDENTIAL REALTY, LLC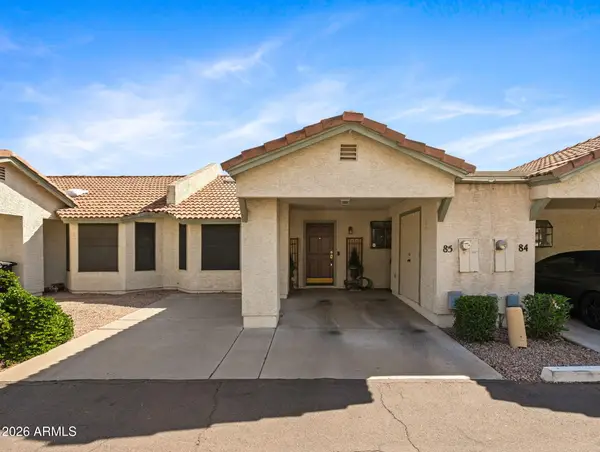 $285,000Active2 beds 2 baths817 sq. ft.
1500 N Sunview Parkway #85, Gilbert, AZ 85234
MLS# 6997952Listed by: THE NOBLE AGENCY $805,000Pending4 beds 3 baths2,583 sq. ft.
1464 E Lexington Avenue, Gilbert, AZ 85234
MLS# 6997720Listed by: DELEX REALTY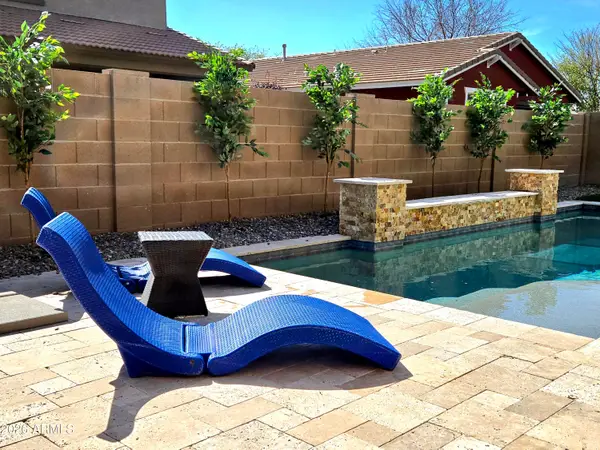 $599,000Pending3 beds 3 baths1,909 sq. ft.
4229 E Mesquite Street, Gilbert, AZ 85296
MLS# 6997558Listed by: HOMESMART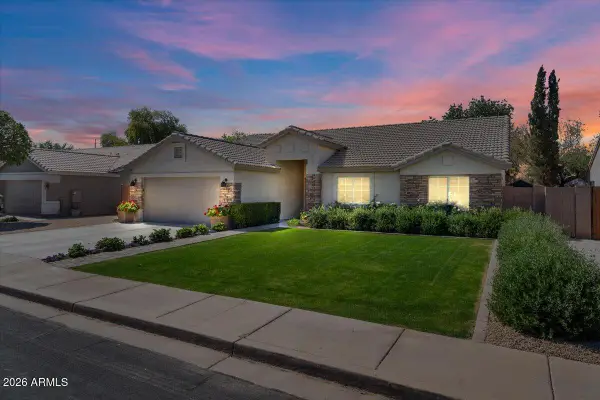 $592,000Pending3 beds 2 baths1,750 sq. ft.
532 N Falcon Drive, Gilbert, AZ 85234
MLS# 6997565Listed by: REALTY ONE GROUP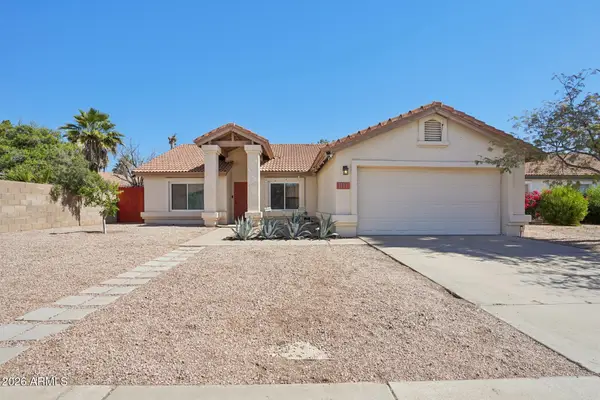 $565,000Pending4 beds 2 baths1,784 sq. ft.
1131 N Pebble Beach Drive, Gilbert, AZ 85234
MLS# 6997570Listed by: REDFIN CORPORATION $725,000Active5 beds 3 baths3,758 sq. ft.
2042 E Dias Drive, Gilbert, AZ 85234
MLS# 6997302Listed by: VENTURE REI, LLC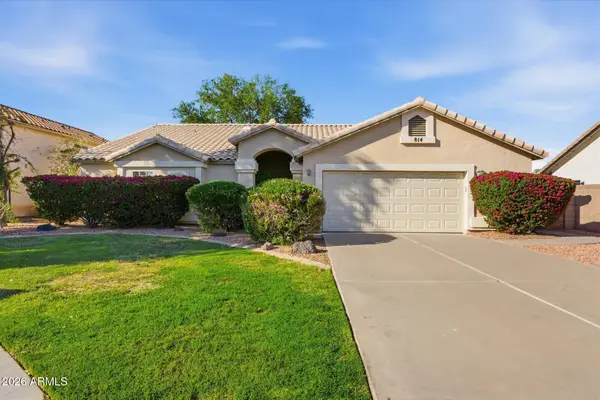 $549,999Active3 beds 2 baths1,879 sq. ft.
814 E Stanford Avenue, Gilbert, AZ 85234
MLS# 6996441Listed by: DR WIN REALTY LLC $527,000Pending4 beds 3 baths2,147 sq. ft.
4384 E Page Avenue, Gilbert, AZ 85234
MLS# 6996047Listed by: OPENDOOR BROKERAGE, LLC $545,000Pending3 beds 3 baths2,096 sq. ft.
3843 E Vaughn Avenue, Gilbert, AZ 85234
MLS# 6995506Listed by: RE OPTIONS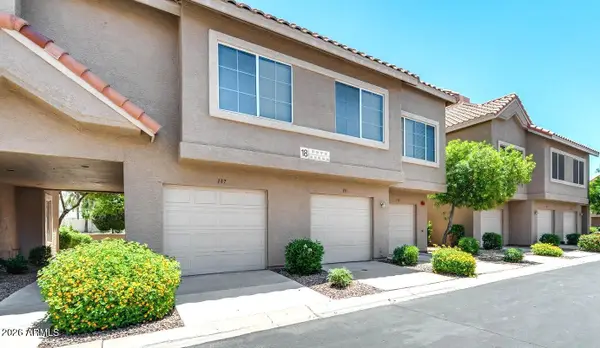 $399,900Active2 beds 2 baths1,092 sq. ft.
1633 E Lakeside Drive #131, Gilbert, AZ 85234
MLS# 6995439Listed by: NATIONAL REALTY OF ARIZONA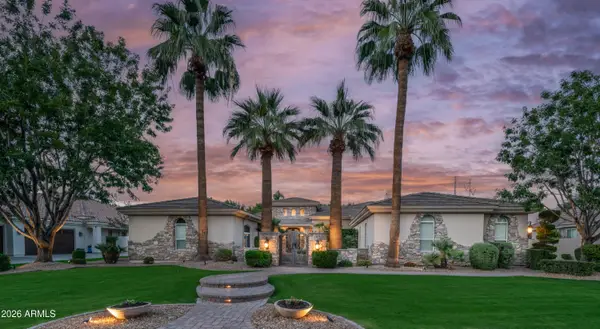 $2,450,000Pending5 beds 6 baths6,219 sq. ft.
2538 E Page Court, Gilbert, AZ 85234
MLS# 6995382Listed by: AFFIRE, LLC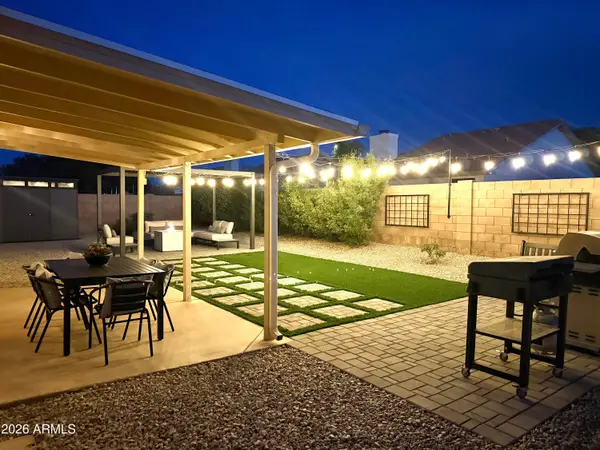 $495,000Pending3 beds 2 baths1,410 sq. ft.
1319 E Douglas Avenue, Gilbert, AZ 85234
MLS# 6995155Listed by: RE/MAX EXCALIBUR $629,000Active4 beds 2 baths2,065 sq. ft.
1033 E Hearne Way, Gilbert, AZ 85234
MLS# 6994360Listed by: HOMESMART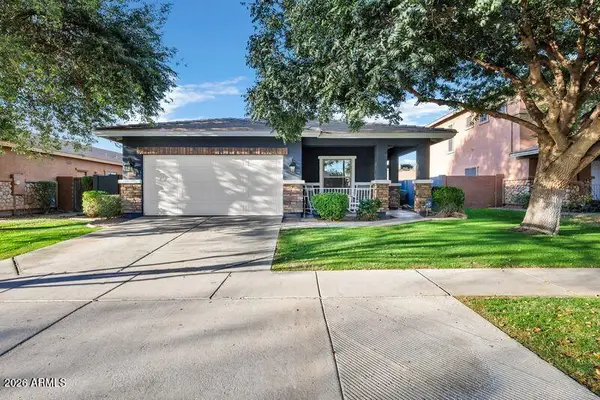 $549,900Pending4 beds 2 baths1,608 sq. ft.
4270 E Washington Court, Gilbert, AZ 85234
MLS# 6994079Listed by: DPR REALTY LLC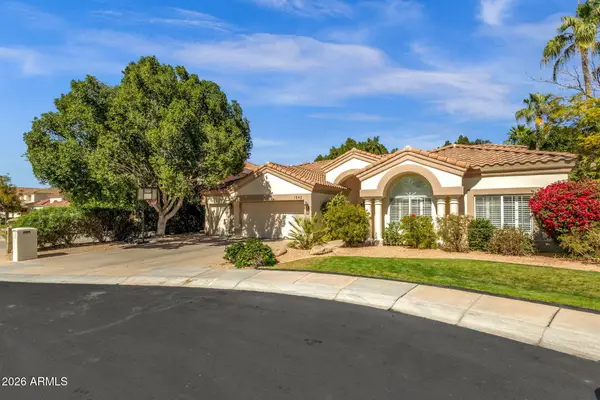 $895,000Pending4 beds 3 baths2,870 sq. ft.
1542 E Catamaran Drive, Gilbert, AZ 85234
MLS# 6994083Listed by: SERHANT.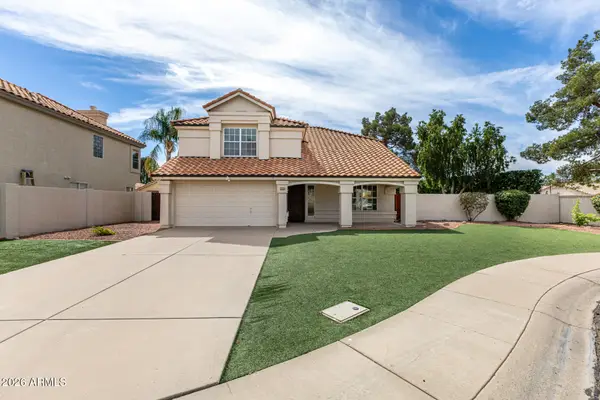 $585,000Pending4 beds 3 baths2,132 sq. ft.
2301 E Millbrae Court, Gilbert, AZ 85234
MLS# 6994087Listed by: REALTY ONE GROUP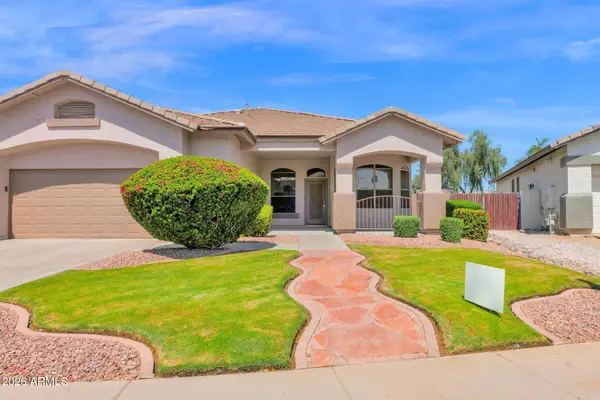 $630,000Active4 beds 2 baths1,884 sq. ft.
3716 E Feather Avenue, Gilbert, AZ 85234
MLS# 6993990Listed by: KELLER WILLIAMS REALTY PHOENIX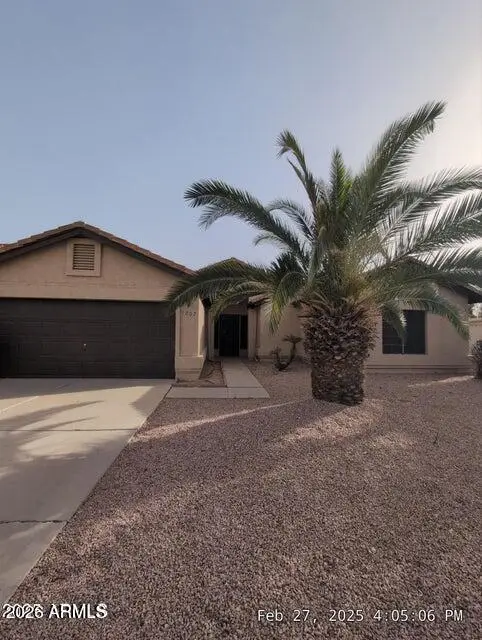 $493,900Active3 beds 2 baths2,161 sq. ft.
1207 E San Remo Avenue, Gilbert, AZ 85234
MLS# 6993343Listed by: ADIRA REALTY GROUP $289,900Active2 beds 2 baths890 sq. ft.
1633 E Lakeside Drive #27, Gilbert, AZ 85234
MLS# 6992848Listed by: REAL BROKER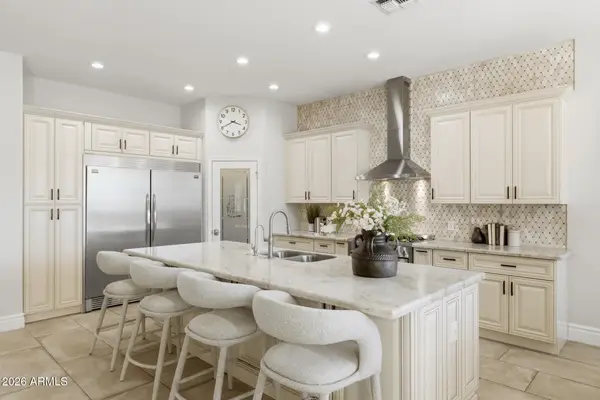 $1,050,000Pending6 beds 4 baths4,603 sq. ft.
3425 E Mockingbird Drive, Gilbert, AZ 85234
MLS# 6992751Listed by: KELLER WILLIAMS REALTY SONORAN LIVING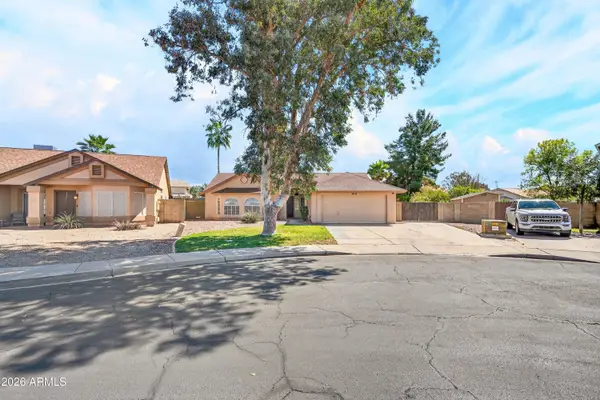 $449,000Pending3 beds 2 baths1,571 sq. ft.
919 N Starling Drive, Gilbert, AZ 85234
MLS# 6992397Listed by: EXP REALTY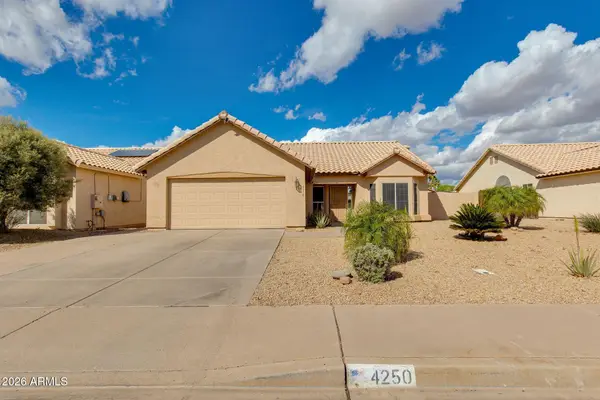 $577,000Active4 beds 2 baths1,914 sq. ft.
4250 E Encinas Avenue, Gilbert, AZ 85234
MLS# 6992224Listed by: THE BROKERY $674,900Pending4 beds 2 baths2,440 sq. ft.
3897 E Cullumber Street, Gilbert, AZ 85234
MLS# 6992227Listed by: REALTY ONE GROUP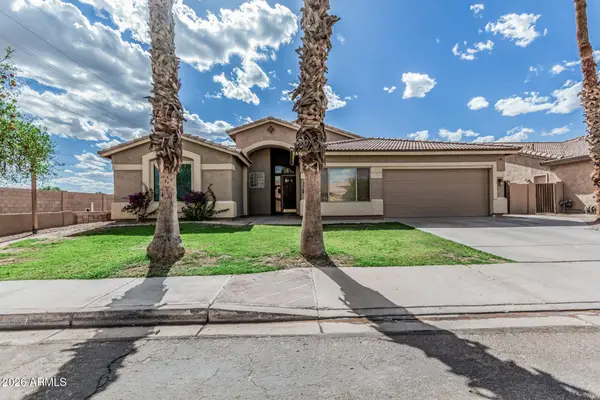 $550,000Pending4 beds 2 baths2,939 sq. ft.
408 N Falcon Court, Gilbert, AZ 85234
MLS# 6991622Listed by: REAL BROKER $1,274,900Active4 beds 4 baths3,090 sq. ft.
4477 E Stanford Avenue, Gilbert, AZ 85234
MLS# 6991431Listed by: REALTY ONE GROUP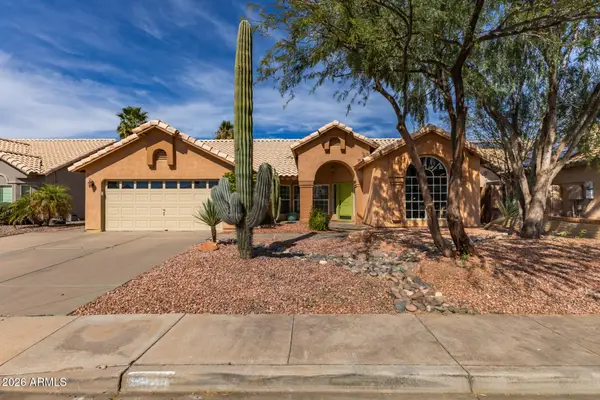 $530,000Pending3 beds 2 baths1,970 sq. ft.
4344 E Encinas Avenue, Gilbert, AZ 85234
MLS# 6990822Listed by: MY HOME GROUP REAL ESTATE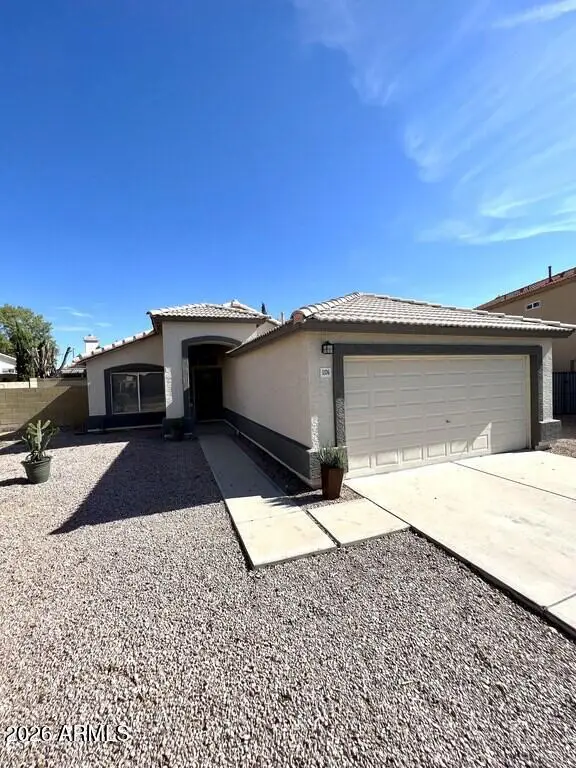 $535,000Active3 beds 2 baths1,262 sq. ft.
1376 E Tradewind Drive, Gilbert, AZ 85234
MLS# 6990426Listed by: ARIZONA ELITE PROPERTIES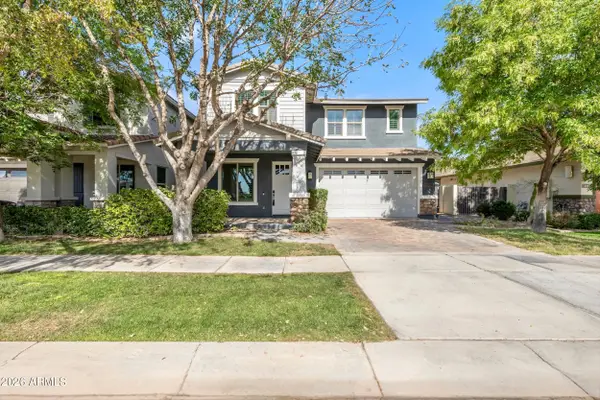 $894,999Active5 beds 4 baths3,453 sq. ft.
4126 E Rawhide Street, Gilbert, AZ 85296
MLS# 6990369Listed by: THE AGENCY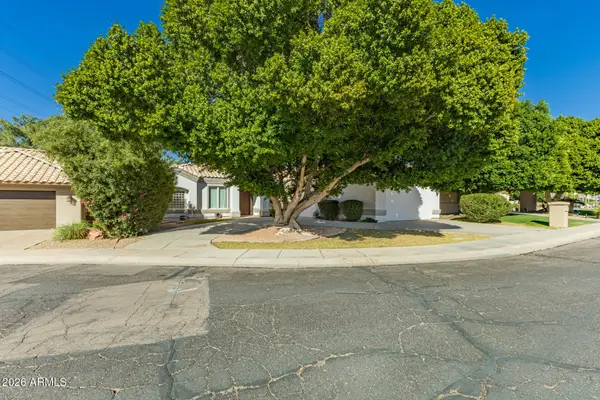 $900,000Active4 beds 3 baths2,645 sq. ft.
1912 E Schooner Court, Gilbert, AZ 85234
MLS# 6989815Listed by: PENFIELD PROPERTIES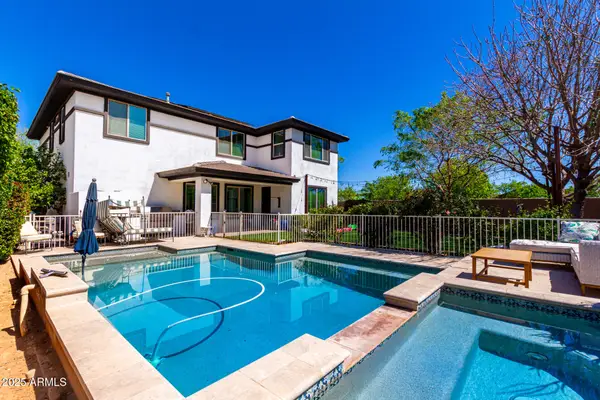 $870,000Pending4 beds 4 baths3,088 sq. ft.
4167 E Sierra Madre Avenue, Gilbert, AZ 85296
MLS# 6989819Listed by: EXP REALTY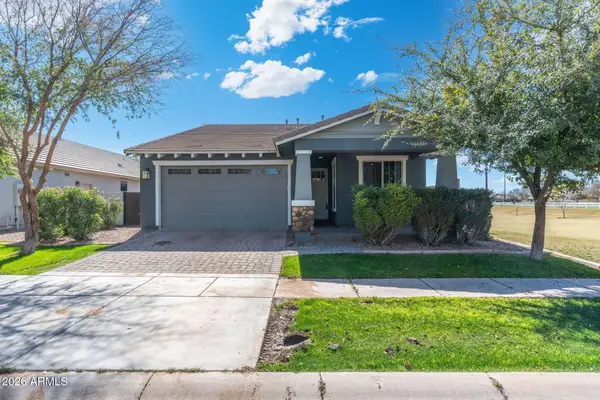 $615,000Active3 beds 2 baths1,823 sq. ft.
4041 E Amber Lane, Gilbert, AZ 85296
MLS# 6989729Listed by: GENTRY REAL ESTATE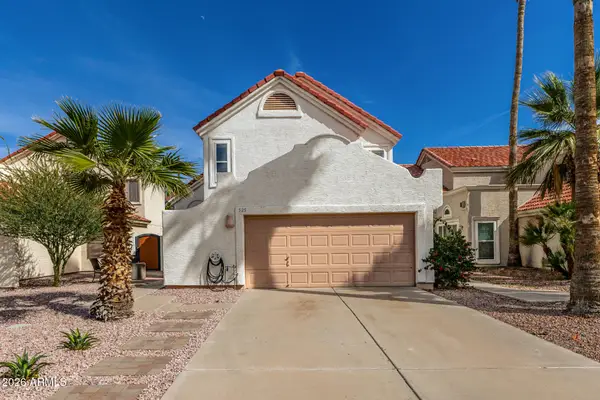 $464,900Pending3 beds 3 baths1,754 sq. ft.
525 N Redrock Street, Gilbert, AZ 85234
MLS# 6989531Listed by: REAL BROKER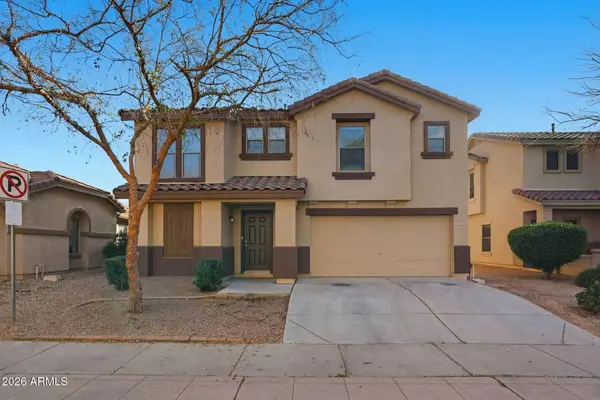 $515,000Active4 beds 3 baths2,267 sq. ft.
1425 N Thunderbird Avenue, Gilbert, AZ 85234
MLS# 6989602Listed by: MAINSTAY BROKERAGE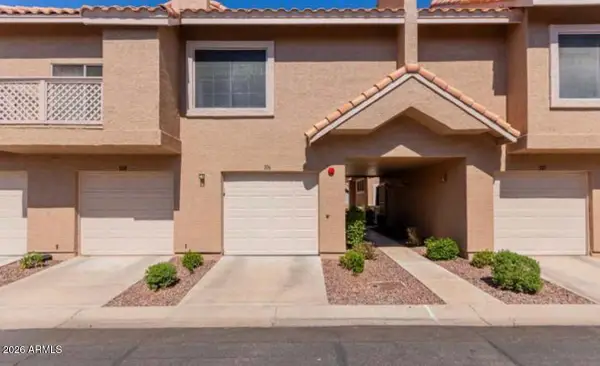 $275,000Active1 beds 1 baths673 sq. ft.
1633 E Lakeside Drive #106, Gilbert, AZ 85234
MLS# 6988680Listed by: 72SOLD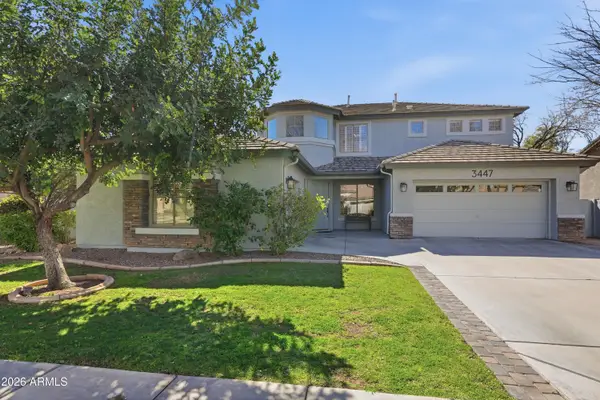 $750,000Pending5 beds 3 baths3,549 sq. ft.
3447 E Vaughn Avenue, Gilbert, AZ 85234
MLS# 6988398Listed by: FATHOM REALTY ELITE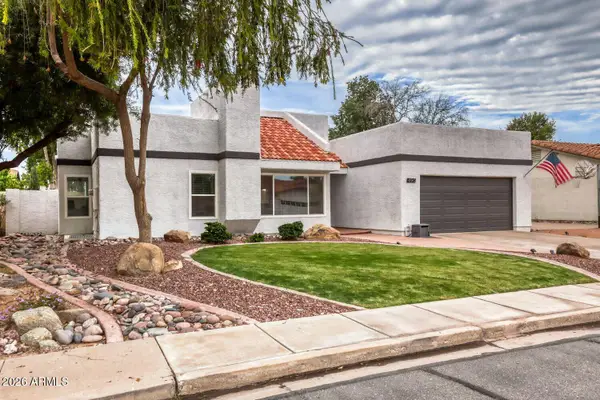 $644,900Active5 beds 3 baths2,104 sq. ft.
490 E San Angelo Avenue, Gilbert, AZ 85234
MLS# 6988111Listed by: CENTURY 21 TOMA PARTNERS $299,900Active2 beds 2 baths890 sq. ft.
1633 E Lakeside Drive #35, Gilbert, AZ 85234
MLS# 6987538Listed by: HOMESMART $349,900Active2 beds 2 baths1,063 sq. ft.
1120 N Val Vista Drive #92, Gilbert, AZ 85234
MLS# 6987360Listed by: CALL REALTY, INC. $1,150,000Active5 beds 4 baths3,568 sq. ft.
1220 N Crystal Shores Drive, Gilbert, AZ 85234
MLS# 6987114Listed by: KELLER WILLIAMS INTEGRITY FIRST $679,000Active4 beds 2 baths2,610 sq. ft.
694 E Washington Avenue, Gilbert, AZ 85234
MLS# 6987081Listed by: WEST USA REALTY $489,999Pending3 beds 2 baths1,587 sq. ft.
270 E Kroll Drive, Gilbert, AZ 85234
MLS# 6986636Listed by: EXP REALTY $410,000Pending3 beds 2 baths1,360 sq. ft.
338 N Heritage Drive, Gilbert, AZ 85234
MLS# 6986560Listed by: HOMESMART $543,000Active3 beds 2 baths1,600 sq. ft.
1426 E Princeton Avenue, Gilbert, AZ 85234
MLS# 6985925Listed by: REAL BROKER $585,000Pending4 beds 3 baths2,389 sq. ft.
1201 E Sea Gull Drive, Gilbert, AZ 85234
MLS# 6985932Listed by: OPENDOOR BROKERAGE, LLC $1,199,000Pending4 beds 3 baths3,122 sq. ft.
640 E Melody Drive, Gilbert, AZ 85234
MLS# 6985765Listed by: VENTURE REI, LLC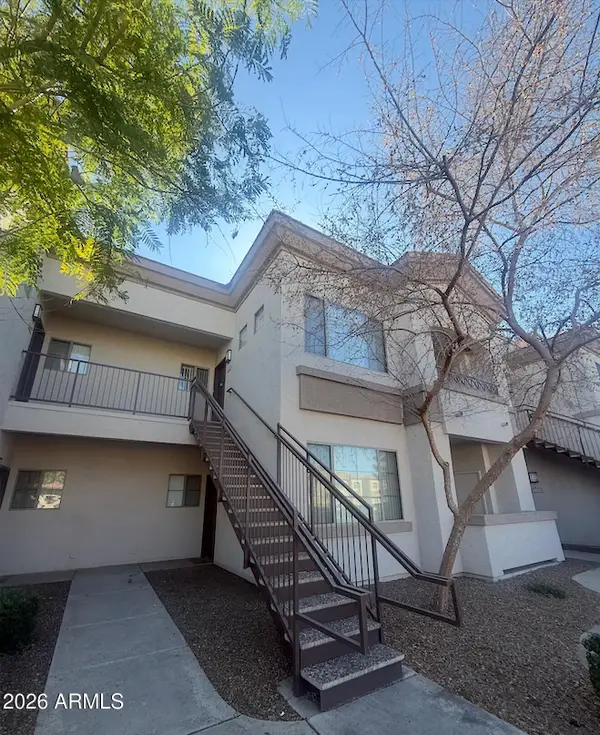 $227,000Active1 beds 1 baths735 sq. ft.
1941 S Pierpont Drive #2118, Mesa, AZ 85206
MLS# 6985197Listed by: SAPPHIRE REALTY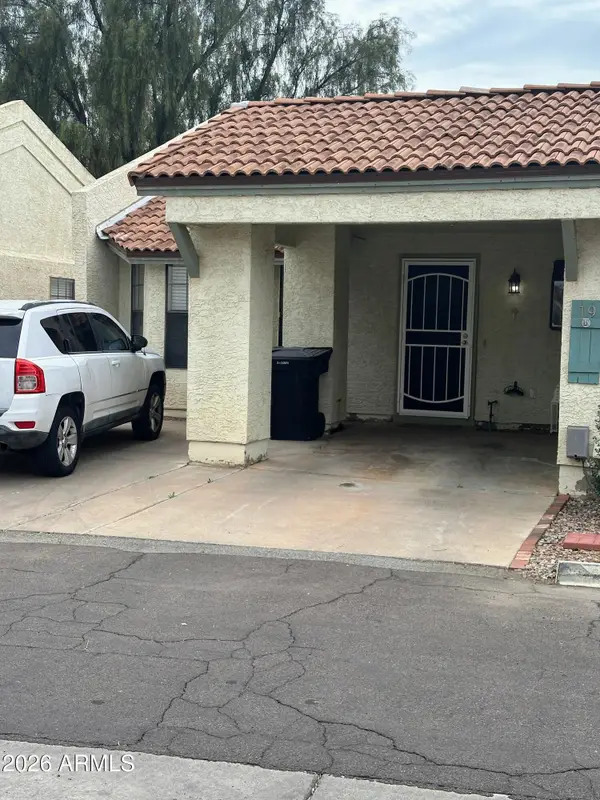 $265,000Active2 beds 2 baths817 sq. ft.
1500 N Sunview Parkway #19, Gilbert, AZ 85234
MLS# 6984610Listed by: RE/MAX EXCALIBUR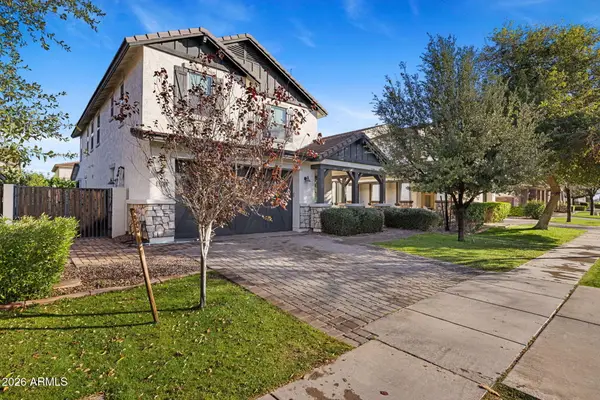 $950,000Active4 beds 4 baths3,156 sq. ft.
4346 E Palo Verde Street, Gilbert, AZ 85296
MLS# 6984438Listed by: RETSY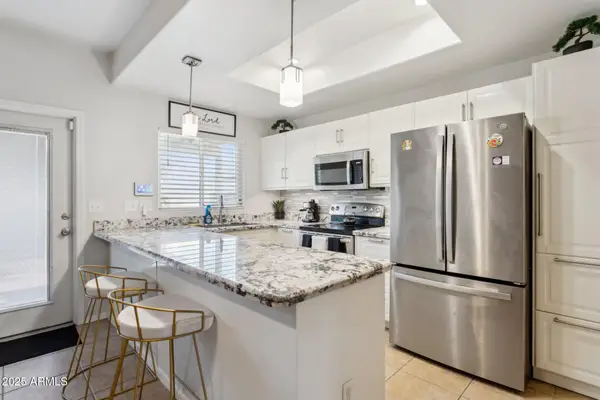 $365,000Active3 beds 3 baths1,535 sq. ft.
170 E Guadalupe Road #152, Gilbert, AZ 85234
MLS# 6983990Listed by: HOMESMART $225,000Active1 beds 1 baths694 sq. ft.
1295 N Ash Street #Apt 617, Gilbert, AZ 85233
MLS# 6983884Listed by: REALTY ONE GROUP $264,900Active2 beds 2 baths1,024 sq. ft.
1941 S Pierpont Drive #2016, Mesa, AZ 85206
MLS# 6983808Listed by: TWO BROTHERS REALTY & CO $349,900Active2 beds 2 baths953 sq. ft.
1633 E Lakeside Drive #170, Gilbert, AZ 85234
MLS# 6983836Listed by: ASHBY REALTY GROUP, LLC $850,000Active3 beds 2 baths2,586 sq. ft.
510 E Houston Avenue, Gilbert, AZ 85234
MLS# 6983204Listed by: SNOW REALTY & PROPERTY MANAGEMENT $459,900Active3 beds 2 baths1,465 sq. ft.
926 E Hearne Way, Gilbert, AZ 85234
MLS# 6982406Listed by: THE FIRM RE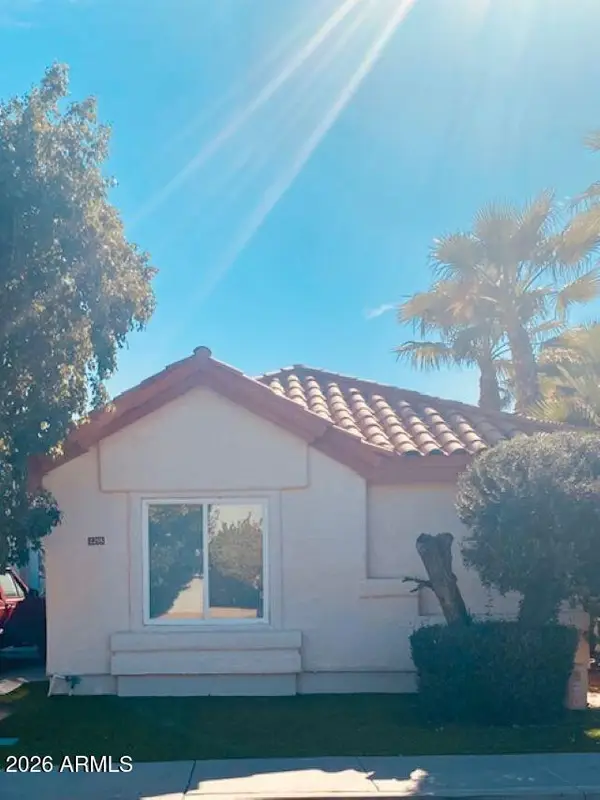 $379,000Active2 beds 3 baths1,292 sq. ft.
2255 E Santa Rosa Drive, Gilbert, AZ 85234
MLS# 6981955Listed by: HOMECOIN.COM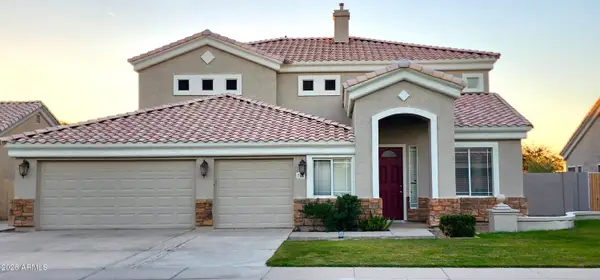 $725,000Pending5 beds 4 baths3,406 sq. ft.
748 N Swan Drive, Gilbert, AZ 85234
MLS# 6981636Listed by: GENTRY REAL ESTATE $1,150,000Active4 beds 3 baths3,275 sq. ft.
338 E Harvard Avenue, Gilbert, AZ 85234
MLS# 6981598Listed by: REALTY ONE GROUP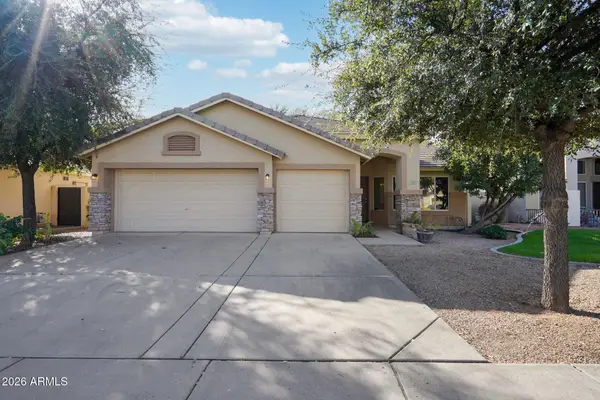 $544,900Active3 beds 2 baths1,836 sq. ft.
3861 E Aspen Way, Gilbert, AZ 85234
MLS# 6981014Listed by: REALTY ONE GROUP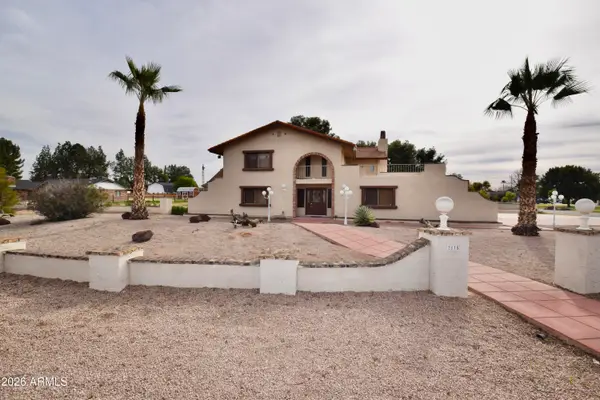 $1,298,995Active4 beds 4 baths3,416 sq. ft.
2815 E Orion Street, Gilbert, AZ 85234
MLS# 6980758Listed by: PROMANAGE REALTY, LLC $550,000Active3 beds 2 baths1,816 sq. ft.
450 E Merrill Avenue, Gilbert, AZ 85234
MLS# 6980895Listed by: HOMESMART $1,285,000Active4 beds 3 baths3,851 sq. ft.
1822 E Lexington Avenue N, Gilbert, AZ 85234
MLS# 6980705Listed by: 72SOLD $730,000Active4 beds 3 baths2,490 sq. ft.
3254 E Washington Avenue, Gilbert, AZ 85234
MLS# 6980298Listed by: REAL BROKER $750,000Active0.5 Acres
884 N Poinciana Court #5, Gilbert, AZ 85234
MLS# 6979845Listed by: HEARTHSTONE REALTY $460,000Active4 beds 3 baths2,025 sq. ft.
468 N Ranger Trail, Gilbert, AZ 85234
MLS# 6979687Listed by: WEST USA REALTY $709,900Pending4 beds 3 baths2,543 sq. ft.
3939 E Park Court, Gilbert, AZ 85234
MLS# 6979398Listed by: VENTURE REI, LLC $599,000Active3 beds 2 baths2,030 sq. ft.
1373 N Roadrunner Drive, Gilbert, AZ 85234
MLS# 6978567Listed by: OPPORTUNITY 2 OWN REAL ESTATE $545,000Active4 beds 3 baths1,952 sq. ft.
1405 N Jamaica Way, Gilbert, AZ 85234
MLS# 6978539Listed by: 72SOLD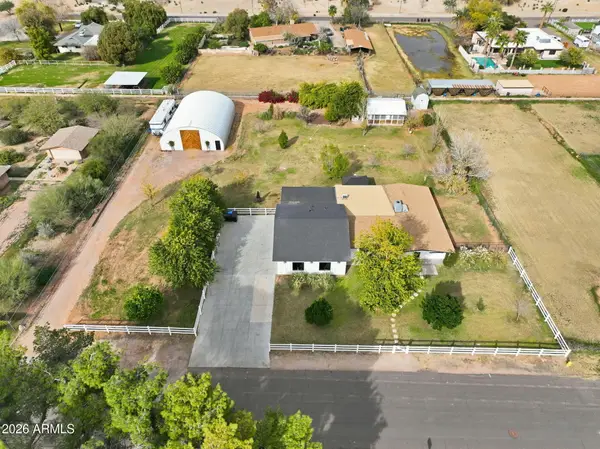 $1,499,999Active3 beds 3 baths2,381 sq. ft.
2858 E Redfield Road, Gilbert, AZ 85234
MLS# 6978256Listed by: REALTY ONE GROUP $524,000Active3 beds 2 baths1,442 sq. ft.
4583 E Olive Court, Gilbert, AZ 85234
MLS# 6977825Listed by: WEST USA REALTY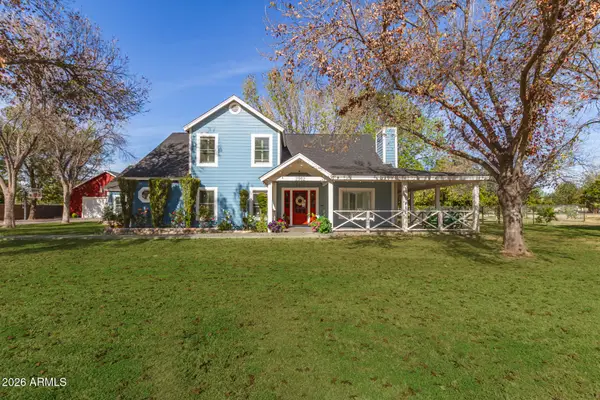 $1,675,000Pending4 beds 3 baths3,491 sq. ft.
2912 E Houston Avenue, Gilbert, AZ 85234
MLS# 6976428Listed by: EXP REALTY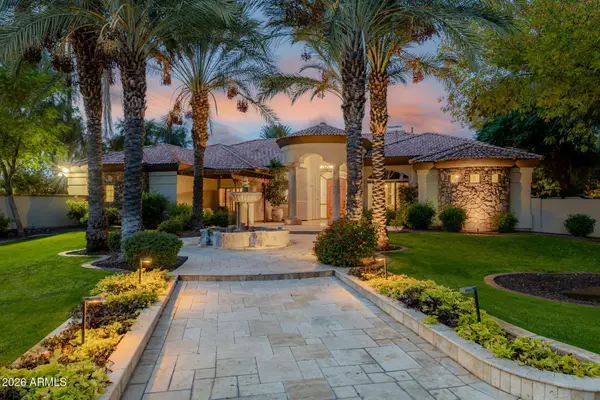 $2,980,000Pending6 beds 6 baths3,960 sq. ft.
1128 E Desert Court, Gilbert, AZ 85234
MLS# 6975874Listed by: GOOD OAK REAL ESTATE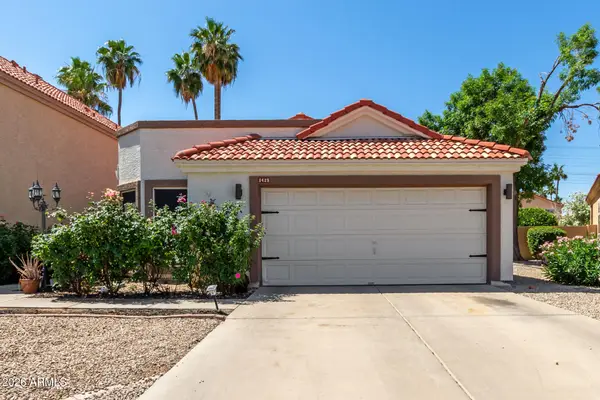 $469,900Active3 beds 2 baths1,383 sq. ft.
1425 E Commerce Avenue, Gilbert, AZ 85234
MLS# 6975527Listed by: REAL BROKER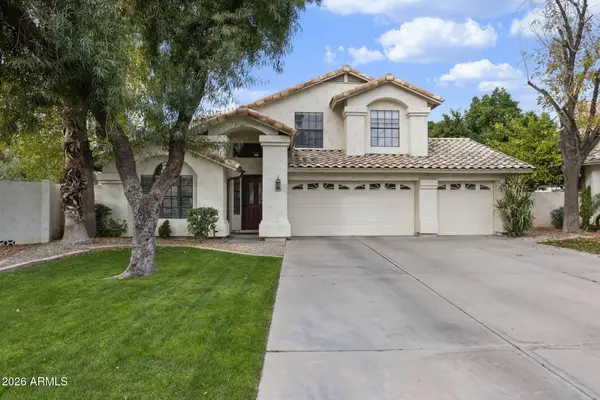 $519,900Pending3 beds 3 baths1,667 sq. ft.
1709 E Watercress Lane, Gilbert, AZ 85234
MLS# 6974845Listed by: RE/MAX FINE PROPERTIES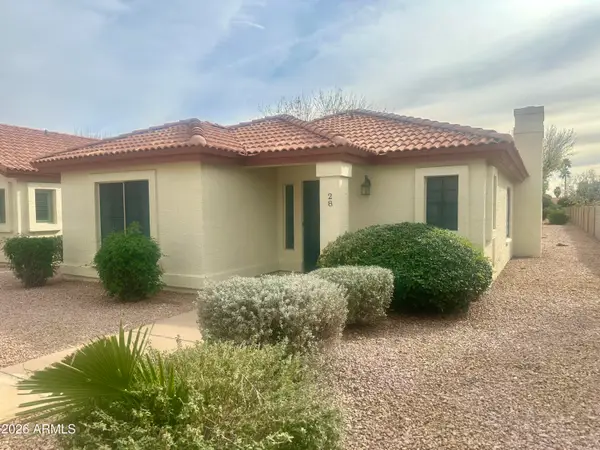 $339,000Active2 beds 2 baths1,063 sq. ft.
1120 N Val Vista Drive #28, Gilbert, AZ 85234
MLS# 6973278Listed by: CENTURY 21-TOWNE & COUNTRY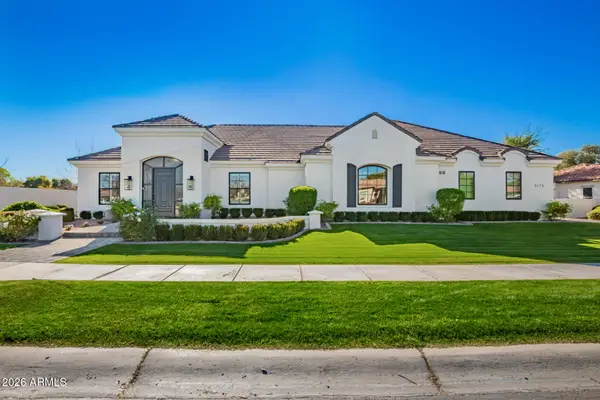 $1,990,000Pending5 beds 5 baths4,359 sq. ft.
3173 E Page Avenue, Gilbert, AZ 85234
MLS# 6971848Listed by: RE/MAX FINE PROPERTIES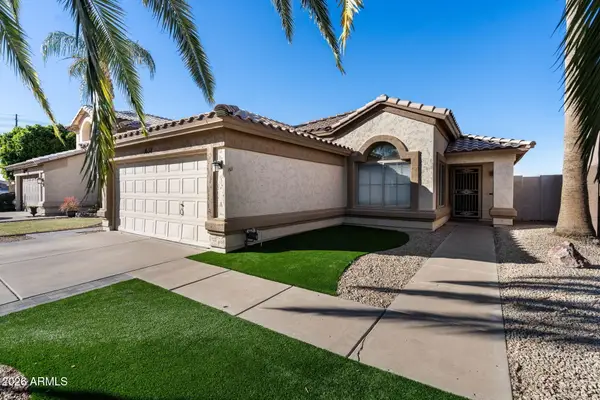 $467,500Active3 beds 2 baths1,248 sq. ft.
1638 E Barbarita Avenue, Gilbert, AZ 85234
MLS# 6970302Listed by: ARIZONA PROPER REAL ESTATE LLC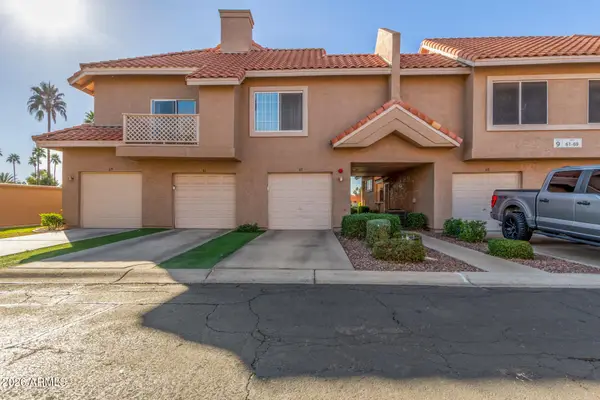 $239,999Pending1 beds 1 baths749 sq. ft.
1633 E Lakeside Drive #67, Gilbert, AZ 85234
MLS# 6968676Listed by: MY HOME GROUP REAL ESTATE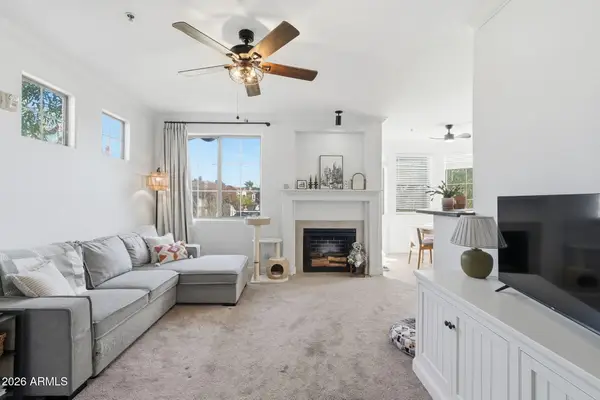 $320,000Active2 beds 2 baths1,056 sq. ft.
1941 S Pierpont Drive #2037, Mesa, AZ 85206
MLS# 6968556Listed by: HOMESMART $705,000Pending5 beds 3 baths3,115 sq. ft.
721 N Pheasant Drive, Gilbert, AZ 85234
MLS# 6965001Listed by: R.O.I. PROPERTIES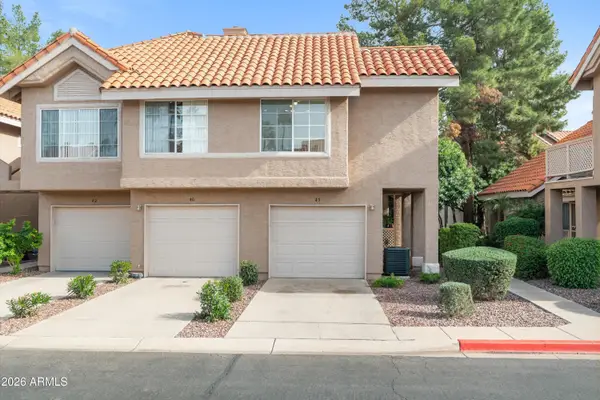 $339,845Active2 beds 2 baths890 sq. ft.
1633 E Lakeside Drive #45, Gilbert, AZ 85234
MLS# 6964804Listed by: REAL BROKER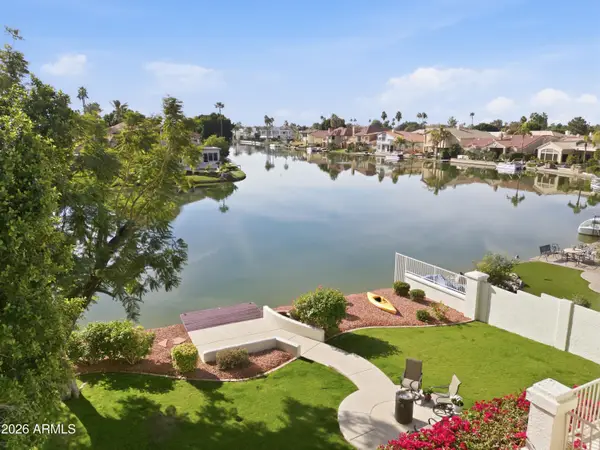 $1,075,000Active5 beds 3 baths3,866 sq. ft.
1349 E Catamaran Drive, Gilbert, AZ 85234
MLS# 6964809Listed by: KELLER WILLIAMS INTEGRITY FIRST $450,000Pending3 beds 2 baths1,443 sq. ft.
301 E Desert Lane, Gilbert, AZ 85234
MLS# 6963944Listed by: NEXTHOME ALLIANCE $759,900Pending4 beds 3 baths2,757 sq. ft.
1064 N Portland Avenue, Gilbert, AZ 85234
MLS# 6963001Listed by: REALTY ONE GROUP $304,000Pending2 beds 2 baths1,024 sq. ft.
1941 S Pierpont Drive #1142, Mesa, AZ 85206
MLS# 6962744Listed by: EXP REALTY $949,000Active5 beds 4 baths3,432 sq. ft.
89 N Riata Street, Gilbert, AZ 85234
MLS# 6962086Listed by: KELLER WILLIAMS ARIZONA REALTY $1,025,000Active4 beds 3 baths2,674 sq. ft.
1819 E Catamaran Drive, Gilbert, AZ 85234
MLS# 6960675Listed by: KELLER WILLIAMS INTEGRITY FIRST $999,500Active5 beds 3 baths3,830 sq. ft.
127 N Date Palm Drive, Gilbert, AZ 85234
MLS# 6959954Listed by: ARROW PROPERTY MANAGEMENT $460,000Pending4 beds 2 baths1,820 sq. ft.
1639 E Redfield Road, Gilbert, AZ 85234
MLS# 6959800Listed by: GENTRY REAL ESTATE $1,949,900Active6 beds 6 baths5,875 sq. ft.
721 E San Pedro Avenue, Gilbert, AZ 85234
MLS# 6959159Listed by: KELLER WILLIAMS REALTY PHOENIX $320,000Active2 beds 2 baths1,040 sq. ft.
1500 N Sunview Parkway #20, Gilbert, AZ 85234
MLS# 6958665Listed by: FIRST SONORAN PROPERTY MANAGEMENT $299,900Active2 beds 2 baths972 sq. ft.
1633 E Lakeside Drive #66, Gilbert, AZ 85234
MLS# 6952155Listed by: WEST USA REALTY $550,000Pending3 beds 2 baths1,591 sq. ft.
3480 E Cullumber Court, Gilbert, AZ 85234
MLS# 6951132Listed by: HOMESMART LIFESTYLES $475,000Pending3 beds 3 baths1,754 sq. ft.
1510 E Campbell Avenue, Gilbert, AZ 85234
MLS# 6947127Listed by: HAIDUK REALTY EXPERIENCE $434,900Active3 beds 2 baths1,308 sq. ft.
907 N Falcon Drive, Gilbert, AZ 85234
MLS# 6943043Listed by: REALTY ONE GROUP $499,000Active3 beds 3 baths1,739 sq. ft.
1538 E Laurel Avenue, Gilbert, AZ 85234
MLS# 6941919Listed by: MY HOME GROUP REAL ESTATE $1,150,000Pending4 beds 2 baths2,992 sq. ft.
1911 E Bruce Avenue, Gilbert, AZ 85234
MLS# 6939725Listed by: MOUNTAIN SAGE REALTY $1,685,000Active4 beds 3 baths4,284 sq. ft.
1748 E Queen Palm Drive, Gilbert, AZ 85234
MLS# 6938547Listed by: KELLER WILLIAMS INTEGRITY FIRST $1,350,000Active4 beds 4 baths3,632 sq. ft.
1831 E Linda Lane, Gilbert, AZ 85234
MLS# 6935214Listed by: EXP REALTY $1,390,000Active1.68 Acres
0 E Baseline Road, Gilbert, AZ 85234
MLS# 6933479Listed by: KATE ROSE REALTY $824,995Pending4 beds 3 baths3,868 sq. ft.
4107 E Palo Verde Street, Gilbert, AZ 85296
MLS# 6929058Listed by: EXP REALTY $1,050,000Pending5 beds 4 baths4,459 sq. ft.
3603 E Indigo Bay Court, Gilbert, AZ 85234
MLS# 6929009Listed by: REAL BROKER $1,895,000Active5 beds 4 baths4,342 sq. ft.
1407 E Coral Cove Drive, Gilbert, AZ 85234
MLS# 6926962Listed by: COMPASS $3,150,000Active4 beds 5 baths6,141 sq. ft.
1519 E Treasure Cove Drive, Gilbert, AZ 85234
MLS# 6925207Listed by: KELLER WILLIAMS INTEGRITY FIRST $644,900Active4 beds 3 baths2,903 sq. ft.
1754 E Cotton Court, Gilbert, AZ 85234
MLS# 6918311Listed by: WEST USA REALTY $2,295,000Pending4 beds 4 baths4,341 sq. ft.
3095 E Page Avenue, Gilbert, AZ 85234
MLS# 6916879Listed by: HOMESMART $239,000Active1 beds 1 baths776 sq. ft.
1941 S Pierpont Drive #2102, Mesa, AZ 85206
MLS# 6911068Listed by: WEST USA REALTY $282,000Pending2 beds 2 baths891 sq. ft.
413 E Linda Lane #D, Gilbert, AZ 85234
MLS# 7000493Listed by: LIBERTAS REAL ESTATE $289,000Active2 beds 2 baths947 sq. ft.
1295 N Ash Street #714, Gilbert, AZ 85233
MLS# 6905114Listed by: DONE DEAL $227,000Active1 beds 1 baths735 sq. ft.
1941 S Pierpont Drive #1114, Mesa, AZ 85206
MLS# 6893650Listed by: INSTASOLD $1,150,000Active5 beds 5 baths4,242 sq. ft.
4292 E Morrison Ranch Parkway, Gilbert, AZ 85296
MLS# 6890320Listed by: BARRETT REAL ESTATE $259,900Active1 beds 1 baths673 sq. ft.
1633 E Lakeside Drive #166, Gilbert, AZ 85234
MLS# 6949850Listed by: CANAM REALTY GROUP $490,000Active3 beds 2 baths1,571 sq. ft.
4537 E Towne Lane, Gilbert, AZ 85234
MLS# 6835964Listed by: WEST USA REALTY $1,170,000Active5 beds 3 baths2,560 sq. ft.
2975 E Campbell Road, Gilbert, AZ 85234
MLS# 6913839Listed by: CONGRESS REALTY, INC. $609,900Active3 beds 3 baths2,097 sq. ft.
142 E Hearne Way, Gilbert, AZ 85234
MLS# 6984912Listed by: MY HOME GROUP REAL ESTATE $650,000Pending0.53 Acres
811 N Poinciana Court #10, Gilbert, AZ 85234
MLS# 6743574Listed by: HEARTHSTONE REALTY
Local realty services provided by:CENTURY 21 Northwest Realty
Popular searches near 85234
Popular neighborhoods near 85234
- Agritopia, Gilbert homes for sale
- Ashland Ranch, Gilbert homes for sale
- Concord Village, Mesa homes for sale
- Finley Farms, Gilbert homes for sale
- Gardens, Gilbert homes for sale
- Gilbert Ranch, Gilbert homes for sale
- Golden Hills, Mesa homes for sale
- Greenfield Lakes, Gilbert homes for sale
- Higley Park, Gilbert homes for sale
- Lago Estancia, Gilbert homes for sale
- Leisure World, Mesa homes for sale
- Lyons Gate, Gilbert homes for sale
- Morrison Ranch, Gilbert homes for sale
- Park Village, Gilbert homes for sale
- Reed Park, Mesa homes for sale
- Sunland Village, Mesa homes for sale
- Superstition Springs, Mesa homes for sale
- Taylor Park, Mesa homes for sale
- Val Vista Lakes, Gilbert homes for sale
- Wind Drift, Gilbert homes for sale
Counties near Gilbert, 85234
Protect your home and budget from life's surprises with an Assurant Home Warranty, backed by a partner that supports you through every step of homeownership. Explore Plans.
©2026 Century 21 Real Estate LLC. All rights reserved. CENTURY 21®, the CENTURY 21 Logo and C21® are service marks owned by Century 21 Real Estate LLC. Century 21 Real Estate LLC fully supports the principles of the Fair Housing Act and the Equal Opportunity Act. Each office is independently owned and operated. Listing information is deemed reliable but not guaranteed accurate.