- Charter Oak homes for sale
- Chino homes for sale
- Chino Hills homes for sale
- Citrus homes for sale
- Claremont homes for sale
- Covina homes for sale
- Diamond Bar homes for sale
- East San Gabriel Valley homes for sale
- Glendora homes for sale
- La Verne homes for sale
- Montclair homes for sale
- Ontario homes for sale
- Phillips Ranch homes for sale
- Pomona homes for sale
- Rowland Heights homes for sale
- San Dimas homes for sale
- South San Jose Hills homes for sale
- Upland homes for sale
- Walnut homes for sale
- West Covina homes for sale
91766, CA - homes for sale
149 of 149 results displayed
- Coming Soon
 $729,000Coming Soon4 beds 2 baths
1701 Manor Circle, Pomona, CA 91766
MLS# MB26124116Listed by: EXCELLENCE RE REAL ESTATE - New
 $1,000,000Active8 beds 9 baths3,970 sq. ft.
2418 Angela Street, Pomona, CA 91766
MLS# 26844543Listed by: MAYWOOD PROPERTY GROUP - New
 $418,000Active2 beds 2 baths930 sq. ft.
3711 Legato Court, Pomona, CA 91766
MLS# TR26120393Listed by: RE/MAX TOP PRODUCERS - New
 $599,990Active3 beds 3 baths1,634 sq. ft.
441 S Eleanor Street, Pomona, CA 91766
MLS# OC26122034Listed by: SEABRIGHT MANAGEMENT - New
 $409,990Active-- beds -- baths1,189 sq. ft.
101 W Mission #312, Pomona, CA 91766
MLS# CV26119332Listed by: THE IVRI GROUP, INC. - New
 $680,000Active3 beds 2 baths1,196 sq. ft.
1609 Calatina, Pomona, CA 91766
MLS# WS26120494Listed by: BLACK FOREST BROKERAGE - New
 $899,800Active3 beds 2 baths1,733 sq. ft.
3 Cimmarron, Pomona, CA 91766
MLS# CV26119137Listed by: RE/MAX OLYMPIC - New
 $960,000Active3 beds 3 baths2,360 sq. ft.
34 Mesa Ridge, Pomona, CA 91766
MLS# WS26120359Listed by: IRN REALTY - New
 $660,000Active3 beds 1 baths1,171 sq. ft.
1642 Vejar, Pomona, CA 91766
MLS# CV26118753Listed by: RE/MAX TIME REALTY - New
 $399,800Active1 beds 1 baths865 sq. ft.
3669 Legato Ct., Phillips Ranch, CA 91766
MLS# WS26117367Listed by: PINNACLE REAL ESTATE GROUP - New
 $710,000Active3 beds 3 baths1,590 sq. ft.
1450 W 9th, Pomona, CA 91766
MLS# CV26119082Listed by: CALIFORNIA PRIME REAL ESTATE - New
 $409,990Active1 beds 2 baths
101 W Mission, Pomona, CA 91766
MLS# CV26119332Listed by: THE IVRI GROUP, INC. - New
 $670,000Active3 beds 2 baths1,544 sq. ft.
1453 Springvale Street, Pomona, CA 91766
MLS# IG26118484Listed by: PAK HOME REALTY - New
 $699,999Active4 beds 2 baths1,176 sq. ft.
2416 Stanford Avenue, Pomona, CA 91766
MLS# TR26118787Listed by: RE/MAX TOP PRODUCERS - New
 $730,000Active3 beds 1 baths1,088 sq. ft.
1335 S Hamilton, Pomona, CA 91766
MLS# IV26117798Listed by: MARC CASTRO, BROKER - New
 $419,999Active1 beds 1 baths913 sq. ft.
6 Brownfield Lane, Pomona, CA 91766
MLS# CV26116961Listed by: CAPITAL & INFLUENCE - New
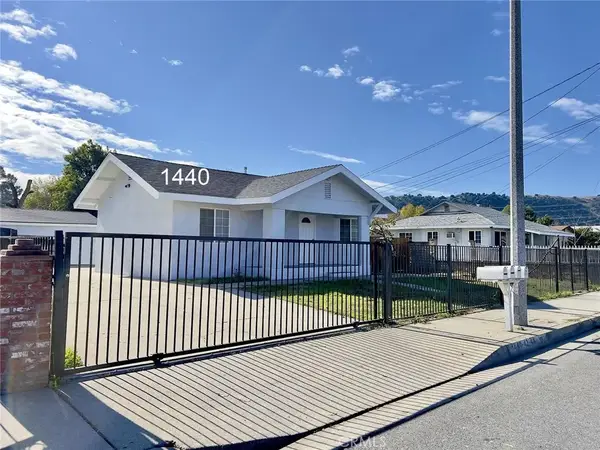 $1,275,000Active8 beds 4 baths
1440 W Grand, Pomona, CA 91766
MLS# CV26116517Listed by: GREENVIEW REALTY - Coming Soon
 $185,000Coming Soon2 beds 2 baths
41-1461 W Mission Boulevard, Pomona, CA 91766
MLS# IV26111550Listed by: REALTY MASTERS & ASSOCIATES 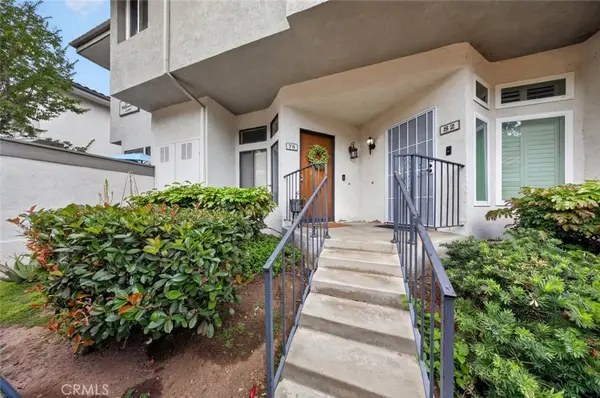 $550,000Active3 beds 3 baths1,265 sq. ft.
76 Willowcrest Lane, Pomona, CA 91766
MLS# CV26111789Listed by: JOHNHART CORP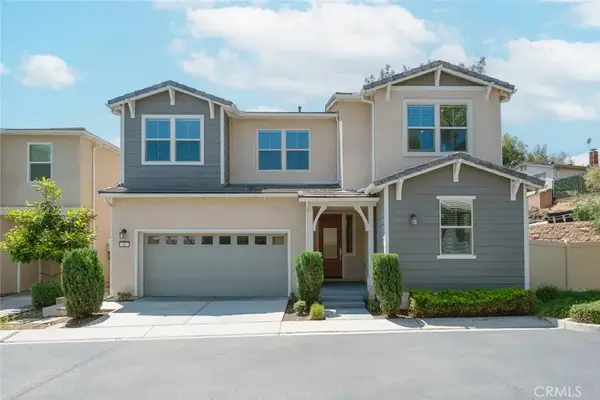 $1,050,000Active5 beds 4 baths2,435 sq. ft.
16 Greensboro Ct, Pomona, CA 91766
MLS# TR26095991Listed by: HOMEQUEST REAL ESTATE $799,000Active4 beds 3 baths2,097 sq. ft.
44 Rolling Hills, Pomona, CA 91766
MLS# PW26107009Listed by: FIRST TEAM REAL ESTATE $899,900Active4 beds 3 baths2,022 sq. ft.
1926 Kizh Way, Pomona, CA 91766
MLS# WS26108627Listed by: REAL BROKERAGE TECHNOLOGIES
 $968,000Active3 beds 3 baths2,083 sq. ft.
6 Blacksmith Circle, Pomona, CA 91766
MLS# DW26083555Listed by: CENTURY 21 ALLSTARS $968,000Active3 beds 3 baths2,083 sq. ft.
6 Blacksmith Circle, Pomona, CA 91766
MLS# DW26083555Listed by: CENTURY 21 ALLSTARS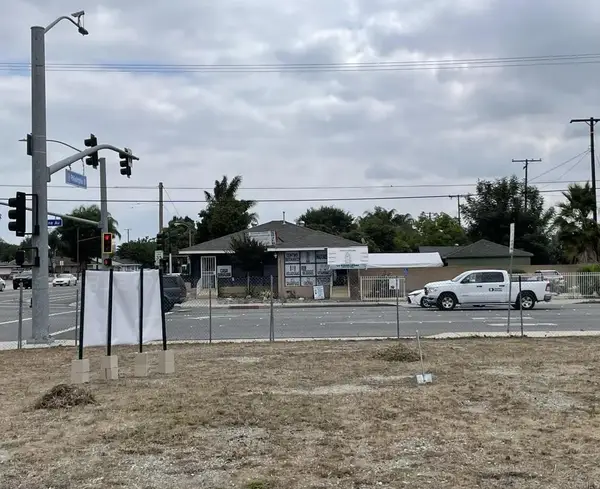 $525,000Active0 Acres
796 Philadelphia, Pomona, CA 91766
MLS# PTP2603992Listed by: REMODEL REALTY, INC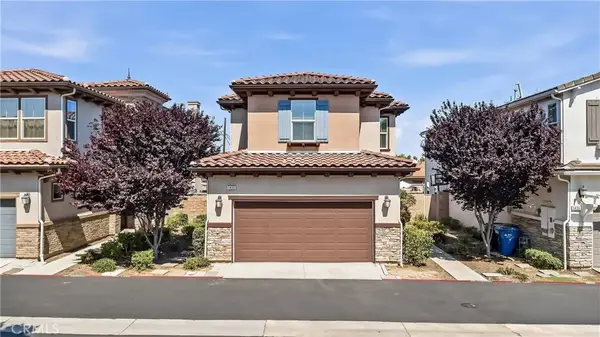 $774,900Active4 beds 3 baths1,845 sq. ft.
1430 Girona Drive, Pomona, CA 91766
MLS# WS26109464Listed by: WETRUST REALTY $478,000Active3 beds 3 baths1,300 sq. ft.
1423 S White Ave #A, Pomona, CA 91766
MLS# TR26107384Listed by: WETRUST REALTY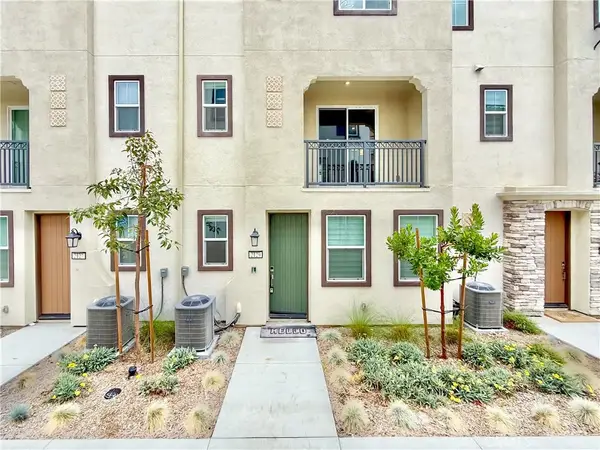 $659,000Active4 beds 4 baths1,631 sq. ft.
2129 Yukon, Pomona, CA 91766
MLS# TR26108407Listed by: RE/MAX TOP PRODUCERS $558,000Active3 beds 3 baths1,400 sq. ft.
1383 S Garey Avenue, Pomona, CA 91766
MLS# AR26102194Listed by: CFPM REALTY $1,199,999Active7 beds 4 baths
1449 S Park Avenue, Pomona, CA 91766
MLS# WS26106406Listed by: SONJA J. TRONCOSO $589,000Active2 beds 3 baths1,332 sq. ft.
17 Mesquite, Pomona, CA 91766
MLS# TR26105619Listed by: IRN REALTY $828,000Active4 beds 2 baths1,640 sq. ft.
1420 W 11th Street, Pomona, CA 91766
MLS# WS26095218Listed by: SUPREME INVESTMENT CORP $838,000Pending3 beds 3 baths1,948 sq. ft.
8 Quiet Hollow Road, Phillips Ranch, CA 91766
MLS# CV26105239Listed by: FIRST TEAM REAL ESTATE $689,900Active3 beds 2 baths1,216 sq. ft.
1791 S Huntington Street, Pomona, CA 91766
MLS# CV26105547Listed by: KELLER WILLIAMS EMPIRE ESTATES $1,098,800Active4 beds 3 baths2,561 sq. ft.
66 Hunter Point, Phillips Ranch, CA 91766
MLS# PW26105419Listed by: NEW STAR REALTY & INVESTMENT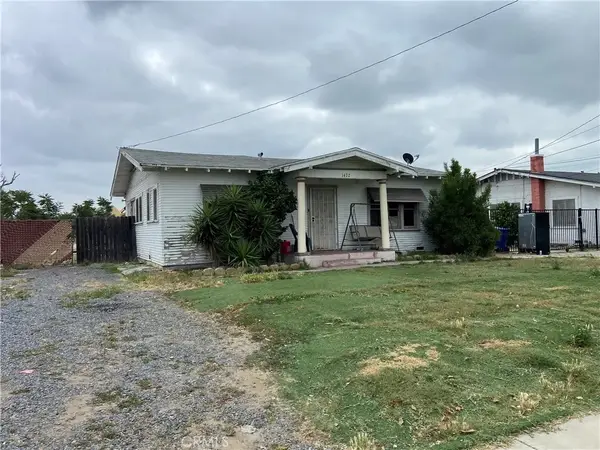 $630,000Active2 beds 1 baths1,088 sq. ft.
1472 S San Antonio Avenue, Pomona, CA 91766
MLS# WS26105111Listed by: HOT HOMES LA $147,500Active0 Acres
3889 E 9th, Pomona, CA 91766
MLS# IG26104988Listed by: REALTY MASTERS & ASSOCIATES- Open Sat, 10am to 12pm
 $599,000Active2 beds 3 baths1,515 sq. ft.
11 Wildflower Pl, Pomona, CA 91766
MLS# AR26078439Listed by: REAL BROKERAGE TECHNOLOGIES, INC  $665,000Active3 beds 2 baths1,035 sq. ft.
11256 Essex, Pomona, CA 91766
MLS# HD26104291Listed by: KELLER WILLIAMS VICTOR VALLEY $995,000Active5 beds 4 baths2,699 sq. ft.
912 W 3rd Street, Pomona, CA 91766
MLS# 26832815Listed by: MARCUS & MILLICHAP $1,068,000Active6 beds 4 baths2,431 sq. ft.
726 W Franklin, Pomona, CA 91766
MLS# OC26098194Listed by: WETRUST REALTY $629,988Active3 beds 1 baths948 sq. ft.
2135 Glenroy, Pomona, CA 91766
MLS# OC26101235Listed by: REAL BROKER $489,900Active3 beds 3 baths1,231 sq. ft.
1571 S Reservoir #D, Pomona, CA 91766
MLS# TR26102401Listed by: FURSTENBERG REALTY $598,000Active2 beds 3 baths1,343 sq. ft.
21 Wildflower, Pomona, CA 91766
MLS# PW26101787Listed by: HELP-U-SELL BEACHSIDE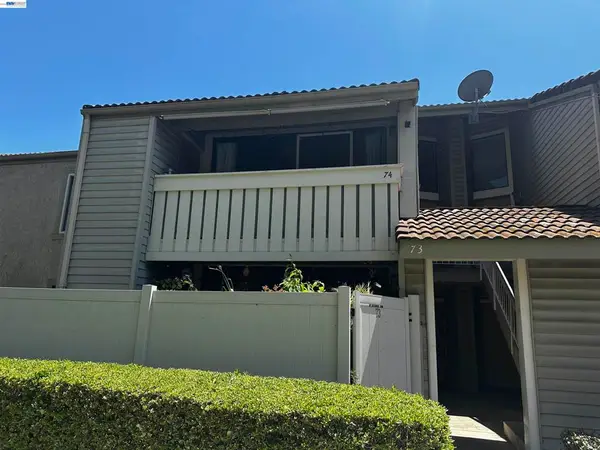 $505,000Active2 beds 3 baths1,204 sq. ft.
74 Carriage Way #74, Pomona, CA 91766
MLS# 41134115Listed by: LEGACY REAL ESTATE & ASSOC. $499,000Active2 beds 3 baths1,109 sq. ft.
2389 S Reservoir, Pomona, CA 91766
MLS# SW26096040Listed by: BERKSHIRE HATHAWAY HOMESERVICES CALIFORNIA PROPERTIES $700,000Active4 beds 2 baths1,304 sq. ft.
1887 Waters Avenue, Pomona, CA 91766
MLS# CV26098697Listed by: CHAMPIONS REAL ESTATE $96,000Active2 beds 2 baths980 sq. ft.
10991 Pipeline, Pomona, CA 91766
MLS# CV26097857Listed by: MERLIN ARGUETA, BROKER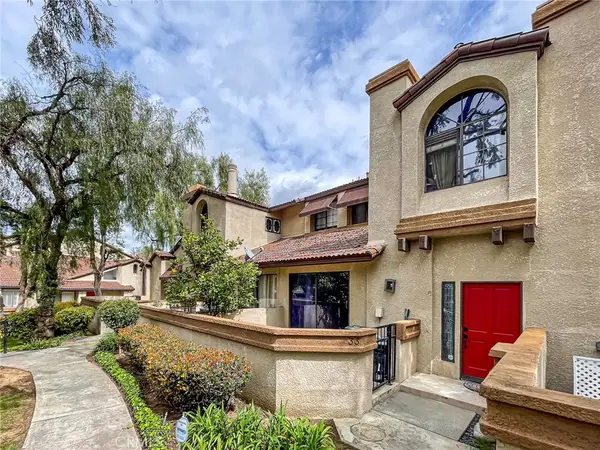 $568,000Active2 beds 3 baths1,332 sq. ft.
33 Wildflower Place, Phillips Ranch, CA 91766
MLS# TR26098133Listed by: RE/MAX TOP PRODUCERS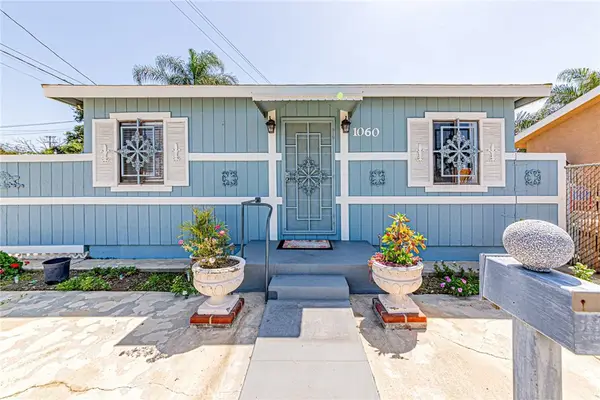 $888,800Active-- beds 2 baths1,384 sq. ft.
1060 S Rebecca, Pomona, CA 91766
MLS# PW26098233Listed by: REDPOINT REALTY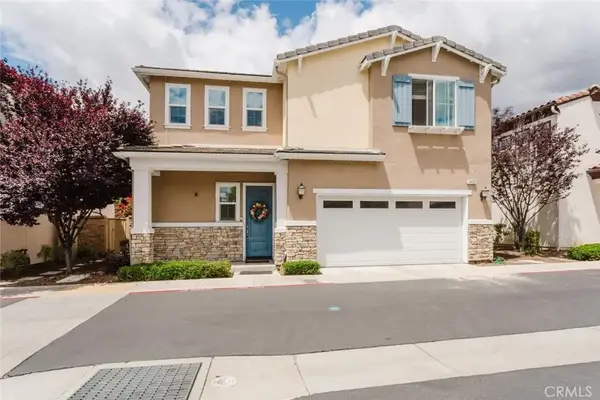 $725,000Active4 beds 3 baths1,639 sq. ft.
1433 Madrid Drive, Pomona, CA 91766
MLS# CV26097459Listed by: JOHNHART CORP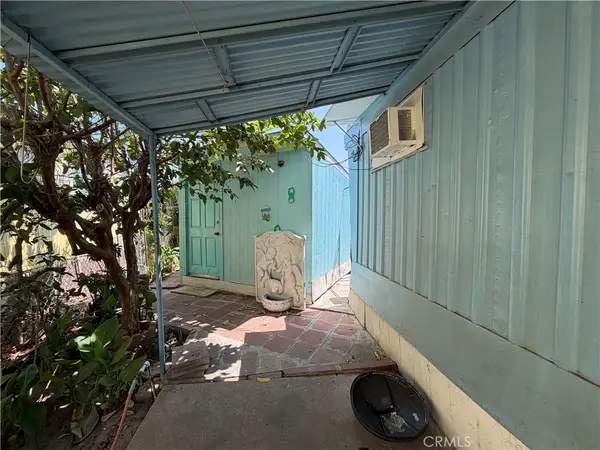 $39,000Pending2 beds 1 baths
1761 E Mission, Pomona, CA 91766
MLS# CV26096165Listed by: EXP REALTY OF CALIFORNIA INC $622,000Active3 beds 3 baths1,676 sq. ft.
6 Goldstar, Pomona, CA 91766
MLS# PW26094309Listed by: T.N.G. REAL ESTATE CONSULTANTS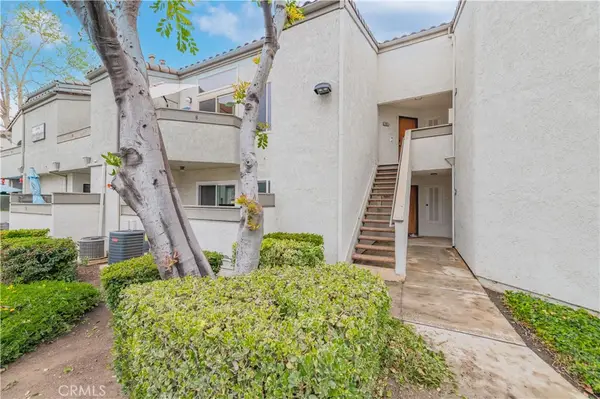 $419,888Active2 beds 2 baths1,050 sq. ft.
7 Town And Country, Pomona, CA 91766
MLS# TR26092507Listed by: RE/MAX GALAXY $484,900Pending3 beds 3 baths1,231 sq. ft.
1575 S Reservoir Street #D, Pomona, CA 91766
MLS# CV26092872Listed by: THE NETWORK AGENCY $460,000Pending2 beds 2 baths1,034 sq. ft.
67 Country Mile, Pomona, CA 91766
MLS# CV26088250Listed by: ALIGN HOMES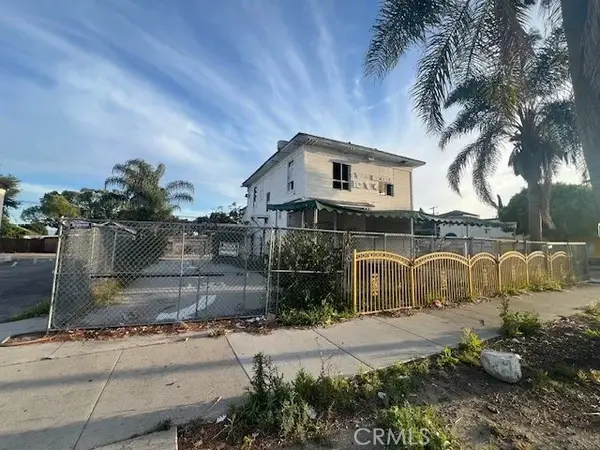 $499,500Active4 beds 1 baths2,197 sq. ft.
604 E Mission, Pomona, CA 91766
MLS# AR26089098Listed by: WETRUST REALTY $950,000Active8 beds 4 baths
1011 W 8th, Pomona, CA 91766
MLS# CV26091397Listed by: REALTY ONE GROUP MASTERS $749,800Pending4 beds 2 baths1,362 sq. ft.
1360 S Thomas, Pomona, CA 91766
MLS# TR26087435Listed by: IRN REALTY $175,000Pending3 beds 2 baths1,152 sq. ft.
1401 W 9th #61, Pomona, CA 91766
MLS# CV26087619Listed by: CENTURY 21 CITRUS REALTY INC $559,000Active3 beds 2 baths1,308 sq. ft.
69 Brownfield, Pomona, CA 91766
MLS# OC26087273Listed by: BERKSHIRE HATHAWAY H.S.C.P $725,000Active3 beds 3 baths1,980 sq. ft.
1350 S Towne, Pomona, CA 91766
MLS# PW26086377Listed by: EDGESTONE REAL ESTATE, INC. $2,200,000Active1.2 Acres
1760 S Towne, Pomona, CA 91766
MLS# CV26078257Listed by: VILLAGE REALTORS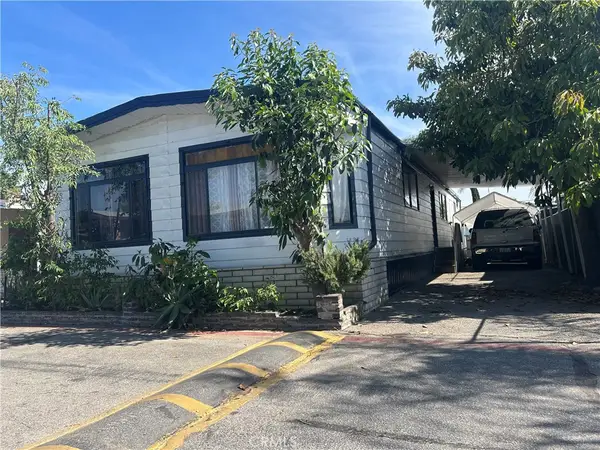 $174,900Pending4 beds 2 baths1,440 sq. ft.
1401 W 9th #148, Pomona, CA 91766
MLS# CV26086508Listed by: CENTURY 21 CITRUS REALTY INC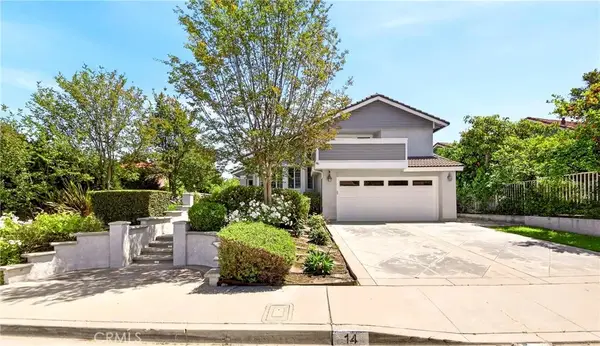 $949,000Active4 beds 3 baths2,020 sq. ft.
14 Rainbow Ridge, Phillips Ranch, CA 91766
MLS# CV26086024Listed by: NEW STAR REALTY & INVESTMENT $658,000Active4 beds 3 baths1,689 sq. ft.
640 W Grand Avenue, Pomona, CA 91766
MLS# TR26075029Listed by: REMAX 2000 REALTY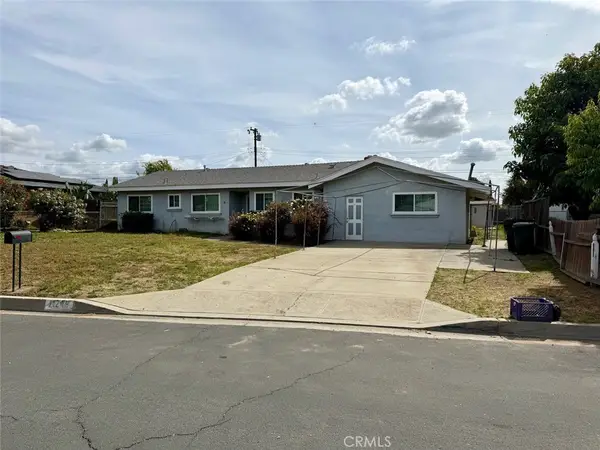 $650,000Pending4 beds 2 baths1,596 sq. ft.
11249 Wesley, Pomona, CA 91766
MLS# IG26082962Listed by: EXP REALTY OF GREATER LOS ANGELES, INC.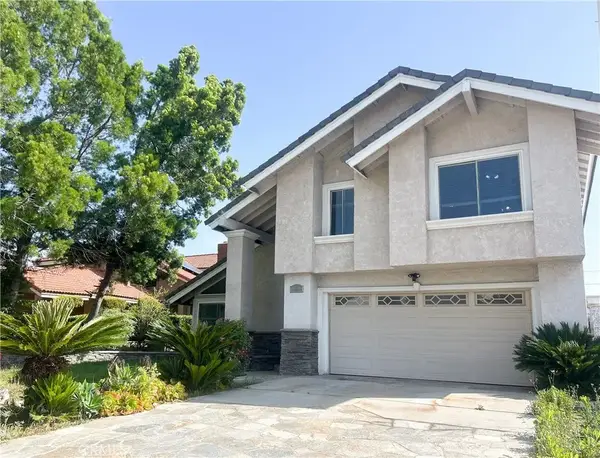 $940,000Active4 beds 3 baths2,060 sq. ft.
10 Bluff Point Circle, Phillips Ranch, CA 91766
MLS# BB26081044Listed by: KELLER WILLIAMS REALTY WORLD MEDIA CENTER $460,000Active2 beds 3 baths1,149 sq. ft.
38 Brownfield Lane, Pomona, CA 91766
MLS# OC26078747Listed by: PRESIDENTIAL INCORPORATED $978,999Active4 beds 3 baths2,000 sq. ft.
42 Rainbow Ridge, Phillips Ranch, CA 91766
MLS# IV26078885Listed by: REAL BROKER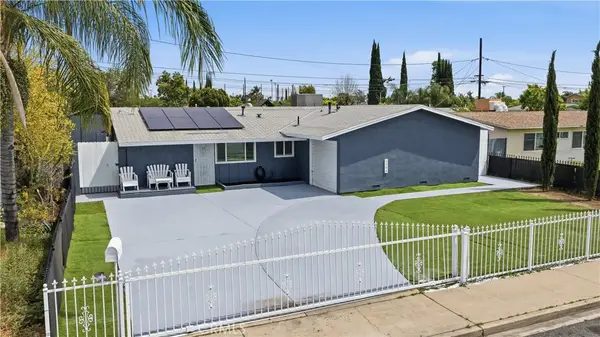 $679,000Active3 beds 2 baths1,670 sq. ft.
1734 Bainbridge Street, Pomona, CA 91766
MLS# IG26078689Listed by: KELLER WILLIAMS REALTY $488,000Active3 beds 2 baths1,293 sq. ft.
23 Willowcrest, Pomona, CA 91766
MLS# TR26078618Listed by: A + REALTY & MORTGAGE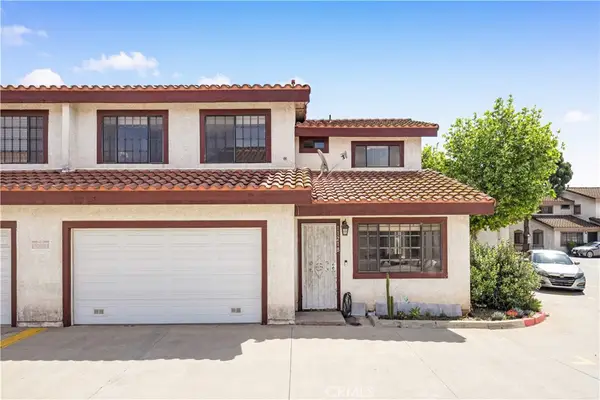 $499,000Active3 beds 3 baths1,341 sq. ft.
1121 E Grand Ave #B, Pomona, CA 91766
MLS# WS26073766Listed by: PINNACLE REAL ESTATE GROUP $728,000Active4 beds 3 baths1,689 sq. ft.
652 W Grand Avenue, Pomona, CA 91766
MLS# WS26068482Listed by: PACIFIC STERLING REALTY/IRVINE $658,000Active4 beds 3 baths1,689 sq. ft.
644 W Grand Avenue, Pomona, CA 91766
MLS# WS26068499Listed by: PACIFIC STERLING REALTY/IRVINE $599,888Active3 beds 3 baths1,602 sq. ft.
6 Wildflower, Pomona, CA 91766
MLS# TR26076601Listed by: RE/MAX TOP PRODUCERS $658,000Active4 beds 3 baths1,689 sq. ft.
650 W Grand Avenue, Pomona, CA 91766
MLS# WS26068487Listed by: PACIFIC STERLING REALTY/IRVINE $658,000Active4 beds 3 baths1,689 sq. ft.
638 W Grand Avenue, Pomona, CA 91766
MLS# WS26068549Listed by: PACIFIC STERLING REALTY/IRVINE $909,900Active5 beds 3 baths1,876 sq. ft.
1163 W 3rd Street, Pomona, CA 91766
MLS# AR26060328Listed by: REAL BROKERAGE TECHNOLOGIES, INC $909,900Active5 beds -- baths1,876 sq. ft.
1163 W 3rd Street, Pomona, CA 91766
MLS# AR26060328Listed by: REAL BROKERAGE TECHNOLOGIES, INC $549,900Pending2 beds 1 baths1,018 sq. ft.
587 W Fernleaf, Pomona, CA 91766
MLS# PW26066096Listed by: WEST POINT REALTY $740,000Pending3 beds 2 baths1,126 sq. ft.
876 Telamon, Pomona, CA 91766
MLS# IV26070570Listed by: NEST REAL ESTATE $625,000Pending3 beds 2 baths1,121 sq. ft.
2260 Kathryn Ave, Pomona, CA 91766
MLS# RS26071046Listed by: CIRCLE REAL ESTATE $32,000Active2.5 Acres
4-E-18 Ridge Dr, McCloud, CA 96057
MLS# 20260364Listed by: COLDWELL BANKER SELECT REAL ESTATE $999,999Active0 Acres
115 S Myrtle Ave, Pomona, CA 91766
MLS# CV26068730Listed by: GATEWAY PROPERTIES GROUP $579,800Active2 beds 3 baths1,332 sq. ft.
3 Saddlewood, Pomona, CA 91766
MLS# CV26040800Listed by: KALEO REAL ESTATE COMPANY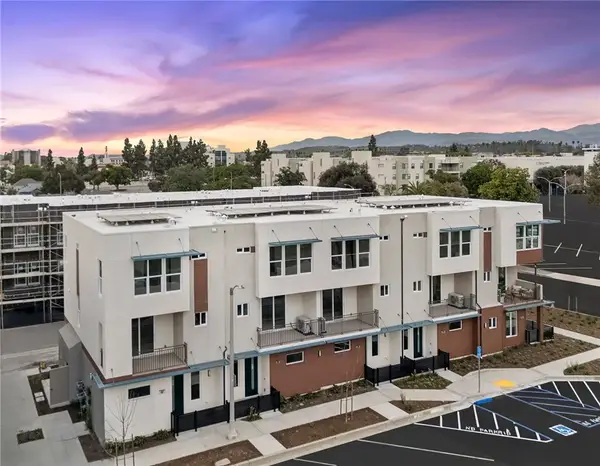 $599,990Active3 beds 3 baths1,634 sq. ft.
427 S Eleanor Street, Pomona, CA 91766
MLS# OC26068428Listed by: SEABRIGHT MANAGEMENT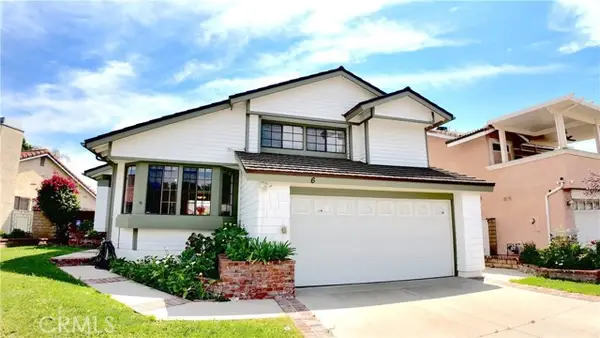 $899,000Pending4 beds 3 baths2,020 sq. ft.
6 Skyline, Pomona, CA 91766
MLS# CRTR26065468Listed by: UNIVERSAL ELITE INC. $499,000Pending3 beds 1 baths1,242 sq. ft.
956 S Reservoir, Pomona, CA 91766
MLS# CV26063007Listed by: KELLER WILLIAMS REALTY COLLEGE PARK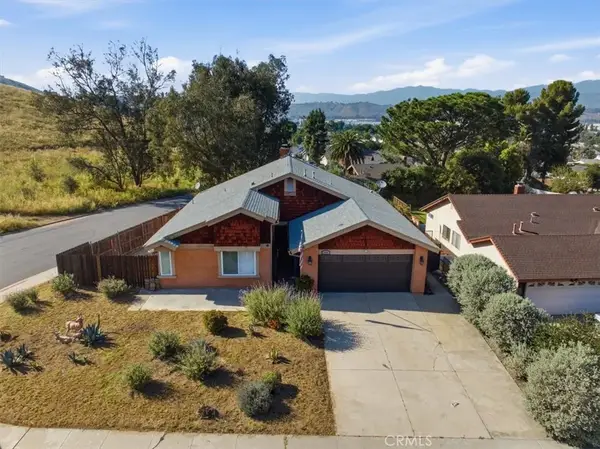 $760,000Active4 beds 2 baths1,530 sq. ft.
1287 Redwood View, Pomona, CA 91766
MLS# IV26063544Listed by: FIRST TEAM REAL ESTATE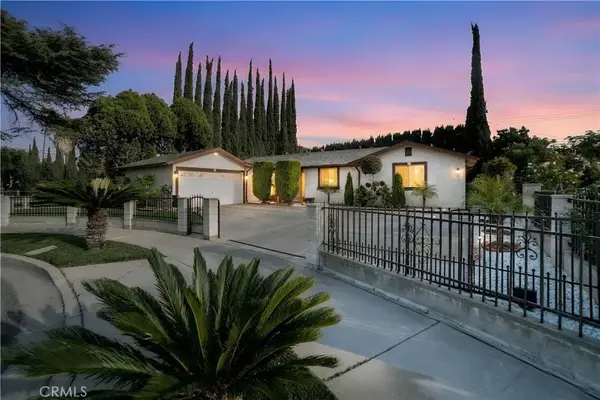 $799,900Pending4 beds 2 baths1,897 sq. ft.
794 Chadwick Court, Pomona, CA 91766
MLS# CV26065955Listed by: RE/MAX TOP PRODUCERS $818,000Pending4 beds 3 baths2,097 sq. ft.
8 Tanglewood, Phillips Ranch, CA 91766
MLS# TR26062378Listed by: COLDWELL BANKER TRI-COUNTIES R $695,000Active3 beds 2 baths1,363 sq. ft.
1696 Manor, Pomona, CA 91766
MLS# CV26057973Listed by: TREC HOMES INC. $399,900Active0.29 Acres
1368 W 1st, Pomona, CA 91766
MLS# CV26058611Listed by: CENTURY 21 CITRUS REALTY INC $579,000Active2 beds 3 baths1,332 sq. ft.
10 Deerpath, Pomona, CA 91766
MLS# IV26057309Listed by: RE/MAX TIME REALTY $450,000Pending2 beds 2 baths1,200 sq. ft.
11430 Cumberland, Pomona, CA 91766
MLS# CRIV26052357Listed by: WESTCOE REALTORS INC- Open Sat, 1pm to 4am
 $650,000Pending3 beds 2 baths1,520 sq. ft.
333 West Grand Avenue, Pomona, CA 91766
MLS# CV26047422Listed by: COMPASS  $679,000Active3 beds 2 baths1,050 sq. ft.
484 Philadelphia, Pomona, CA 91766
MLS# CV26043141Listed by: HIGHER REALTY INC.- Open Wed, 10am to 4:30pm
 $699,990Active3 beds 4 baths1,821 sq. ft.
664 E Fourth Street, Pomona, CA 91766
MLS# OC26053875Listed by: SEABRIGHT MANAGEMENT  $1,199,800Active4 beds 4 baths2,706 sq. ft.
12 Franciscan Place, Phillips Ranch, CA 91766
MLS# TR26052340Listed by: COLDWELL BANKER TRI-COUNTIES R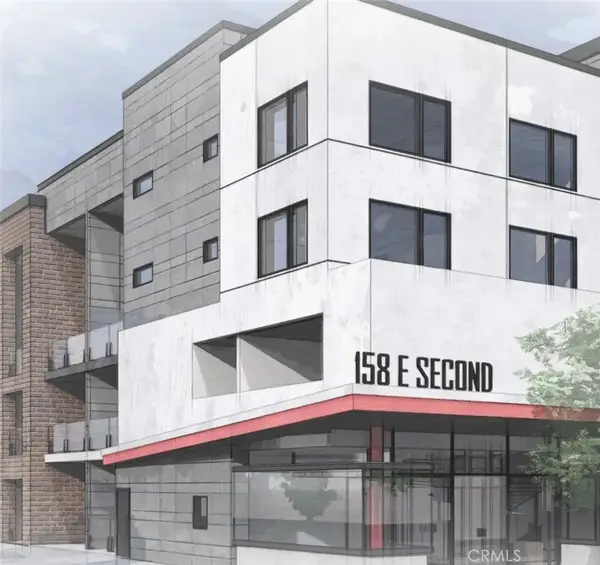 $2,940,000Active0 Acres
158 E 2nd, Pomona, CA 91766
MLS# WS26049818Listed by: PINNACLE REAL ESTATE GROUP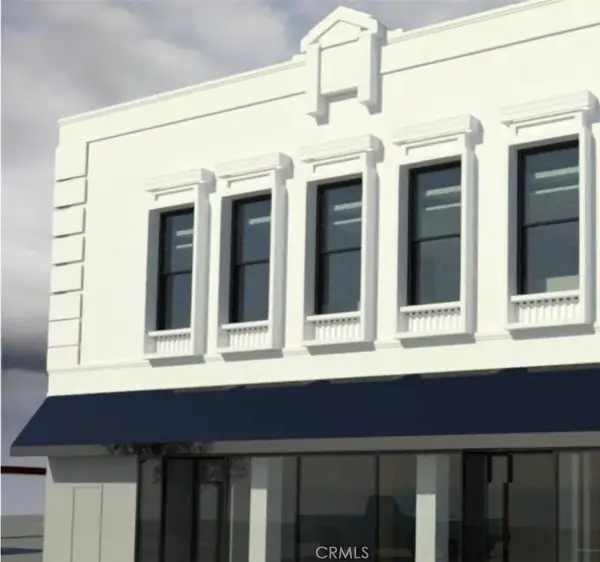 $3,250,000Active0 Acres
160 E 2nd, Pomona, CA 91766
MLS# WS26049829Listed by: PINNACLE REAL ESTATE GROUP- Open Wed, 10am to 4:30pm
 $779,990Active4 beds 3 baths2,079 sq. ft.
445 S Eleanor Street, Pomona, CA 91766
MLS# OC26048755Listed by: SEABRIGHT MANAGEMENT - Open Wed, 10am to 4:30pm
 $749,990Active3 beds 3 baths1,810 sq. ft.
641 E Mission Boulevard, Pomona, CA 91766
MLS# OC26048809Listed by: SEABRIGHT MANAGEMENT - Open Tue, 10am to 4:30pm
 $617,990Active3 beds 3 baths1,634 sq. ft.
415 S Eleanor Street, Pomona, CA 91766
MLS# OC26042945Listed by: SEABRIGHT MANAGEMENT  $715,000Pending3 beds 2 baths1,257 sq. ft.
1634 Lantana, Pomona, CA 91766
MLS# CRIV26038496Listed by: MONACO REALTY $578,800Active2 beds 3 baths1,343 sq. ft.
22 Mesquite Place, Phillips Ranch, CA 91766
MLS# CV26031983Listed by: RE/MAX TOP PRODUCERS $899,000Active2 beds 2 baths1,276 sq. ft.
160 E Franklin, Pomona, CA 91766
MLS# PW26092924Listed by: FIRST TEAM REAL ESTATE $899,000Active0.75 Acres
160 E Franklin, Pomona, CA 91766
MLS# PW26022324Listed by: FIRST TEAM REAL ESTATE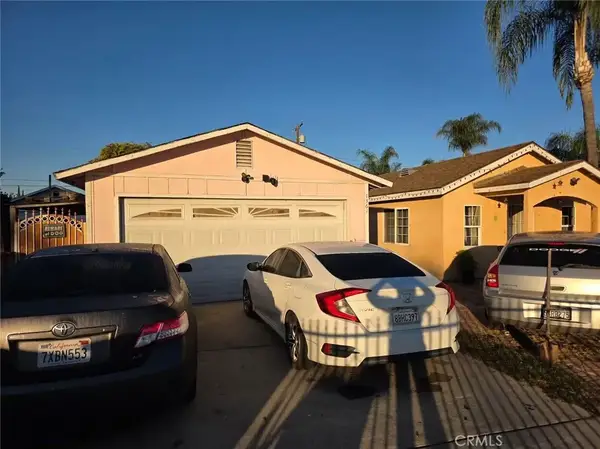 $799,000Active5 beds 3 baths2,110 sq. ft.
1361 S Mountain View Avenue, Pomona, CA 91766
MLS# TR26024349Listed by: PRESIDENTIAL INC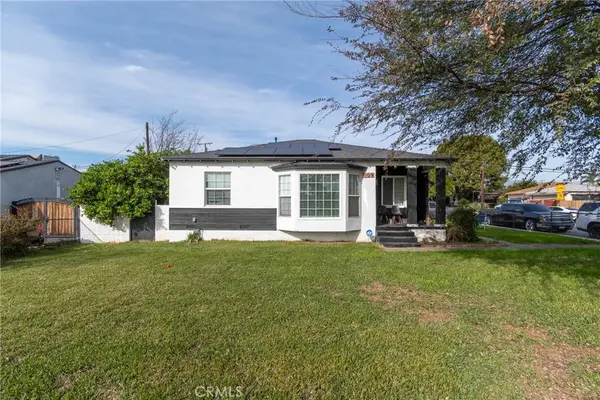 $679,900Pending3 beds 2 baths1,491 sq. ft.
1109 E Olive, Pomona, CA 91766
MLS# CV26021474Listed by: RE/MAX INNOVATIONS $635,000Pending3 beds 3 baths1,687 sq. ft.
12 Deerpath Place, Phillips Ranch, CA 91766
MLS# CV26020769Listed by: RE/MAX MASTERS REALTY $459,000Active2 beds 3 baths1,101 sq. ft.
1425 S White, Pomona, CA 91766
MLS# PW26017188Listed by: CREDENT REAL ESTATE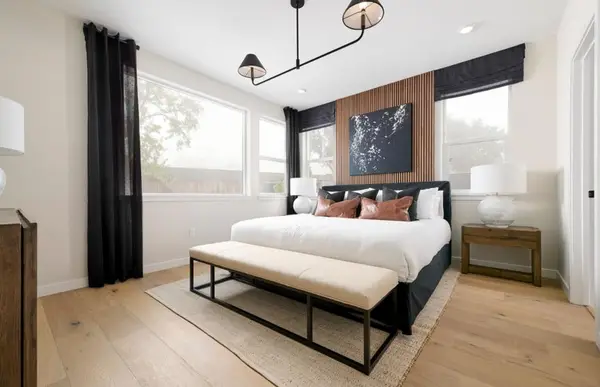 $2,251,263Active3 beds 3 baths1,828 sq. ft.
11240 Cottonwood Place #38-08 Plan 3, Saratoga, CA 95070
MLS# ML82032364Listed by: MICHELLE TANCREDI, BROKER $2,218,208Active3 beds 3 baths1,828 sq. ft.
11315 Cottonwood Place #39-09 Plan 3, Saratoga, CA 95070
MLS# ML82032367Listed by: MICHELLE TANCREDI, BROKER $635,000Pending4 beds 2 baths1,274 sq. ft.
511 W Phillips, Pomona, CA 91766
MLS# IG26017125Listed by: SMART SELL REAL ESTATE $599,000Active2 beds 1 baths1,140 sq. ft.
730 W 9th, Pomona, CA 91766
MLS# SR26017055Listed by: NEW KEY REALTY INC. $469,000Active1 beds 1 baths576 sq. ft.
1151 W Mission, Pomona, CA 91766
MLS# CV26016021Listed by: CENTURY 21 CITRUS REALTY INC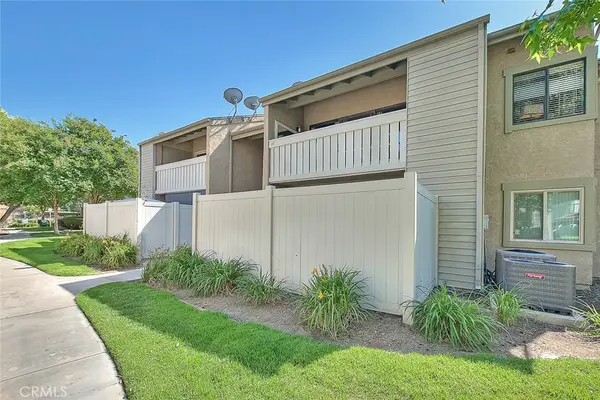 $449,000Active2 beds 1 baths892 sq. ft.
44 Carriage Way #108, Pomona, CA 91766
MLS# IV26012481Listed by: THE ASSOCIATES REALTY GROUP $595,000Active2 beds 3 baths1,332 sq. ft.
17 Rock Cliff Place, Phillips Ranch, CA 91766
MLS# CV26014119Listed by: TANDEM REAL ESTATE. INC. $540,000Active3 beds 3 baths1,339 sq. ft.
55 Willowcrest, Pomona, CA 91766
MLS# TR25281071Listed by: REMAX 2000 REALTY $499,000Active3 beds 2 baths1,239 sq. ft.
609 E Phillips, Pomona, CA 91766
MLS# OC26003426Listed by: 1 VISION REAL ESTATE $498,000Active3 beds 3 baths1,371 sq. ft.
1413 S White Avenue #A, Pomona, CA 91766
MLS# WS26002917Listed by: RE/MAX PREMIER/SANMARINO $949,800Pending4 beds 3 baths2,291 sq. ft.
12 Quail Creek Lane, Pomona, CA 91766
MLS# CRCV25277681Listed by: COMPASS $668,000Pending3 beds 1 baths1,026 sq. ft.
1186 W 9th, Pomona, CA 91766
MLS# TR25273015Listed by: RE/MAX GALAXY $249,900Active0 Acres
968 E Mission Blvd, Pomona, CA 91766
MLS# DW25272325Listed by: EXCELLENCE RE REAL ESTATE, INC. $639,000Pending3 beds 2 baths1,260 sq. ft.
1044 E Dorset Avenue, Pomona, CA 91766
MLS# DW25271208Listed by: T.N.G.REAL ESTATE CONSULTANTS $855,000Pending7 beds 2 baths2,978 sq. ft.
724 W 2nd, Pomona, CA 91766
MLS# CRCV25247525Listed by: KELLER WILLIAMS REALTY COLLEGE PARK $855,000Pending7 beds 2 baths2,978 sq. ft.
724 W 2nd, Pomona, CA 91766
MLS# CV25247525Listed by: KELLER WILLIAMS REALTY COLLEGE PARK $975,000Active4 beds 5 baths
1330 S Reservoir Street, Pomona, CA 91766
MLS# OC25223998Listed by: PACIFIC SHORE GLOBAL, INC. $419,900Active2 beds 1 baths779 sq. ft.
32 Town And Country Road, Phillips Ranch, CA 91766
MLS# TR25195409Listed by: CENTURY 21 MASTERS $910,000Active3 beds 3 baths2,083 sq. ft.
49 Stagecoach Drive, Phillips Ranch, CA 91766
MLS# PW25221583Listed by: REDPOINT REALTY $409,990Active1 beds 2 baths1,189 sq. ft.
101 W Mission Boulevard #312, Pomona, CA 91766
MLS# CV25199138Listed by: THE IVRI GROUP, INC. $2,618,166Pending4 beds 4 baths2,682 sq. ft.
11210 Cottonwood Place #35-08 Plan 4, Saratoga, CA 95070
MLS# ML82017826Listed by: MICHELLE TANCREDI, BROKER $638,000Active0 Acres
25 Franciscan, Phillips Ranch, CA 91766
MLS# TR26013012Listed by: COLDWELL BANKER TRI-COUNTIES R $339,999Pending3 beds 3 baths1,300 sq. ft.
1423 S White Avenue #C, Pomona, CA 91766
MLS# AR19203593Listed by: IRN REALTY $345,000Pending2 beds 3 baths1,204 sq. ft.
74 Carriage Way #230, Phillips Ranch, CA 91766
MLS# CV19209641Listed by: EXP REALTY OF CALIFORNIA INC $949,900Active6 beds 3 baths1,996 sq. ft.
891 E 6th Street, Pomona, CA 91766
MLS# CL26656247Listed by: VOELKEL & ASSOCIATES $549,950Pending3 beds 2 baths960 sq. ft.
1815 W 9th Street, Pomona, CA 91766
MLS# AR25074595Listed by: COMPASS $1,100,000Pending-- beds -- baths3,600 sq. ft.
270 E 6th Street, Pomona, CA 91766
MLS# CV25105233Listed by: REALTY ONE GROUP EMPIRE $960,000Active0 Acres
400 E 4th Street, Pomona, CA 91766
MLS# OC25080387Listed by: JCI REAL ESTATE, INC. $550,000Pending3 beds 1 baths1,104 sq. ft.
903 E 7th Street, Pomona, CA 91766
MLS# IG25043547Listed by: KELLER WILLIAMS REALTY $3,500,000Active1.69 Acres
1367 S Towne Avenue, Pomona, CA 91766
MLS# TR25031301Listed by: WALTON REALTY INC. $734,999Pending5 beds 3 baths1,782 sq. ft.
1535 S Towne Avenue, Pomona, CA 91766
MLS# CV24253416Listed by: REALTY ONE GROUP WEST $870,000Pending3 beds 3 baths1,814 sq. ft.
46 Calle Del Mar, Pomona, CA 91766
MLS# CRSR24233672Listed by: REALTY ONE GROUP ZOOM $900,000Active4 beds 3 baths3,678 sq. ft.
1803 Fleming Street, Pomona, CA 91766
MLS# WS25037024Listed by: TAMMY CHAN $1,400,000Active0 Acres
1284 E 3rd, Pomona, CA 91766
MLS# CV25275142Listed by: RE/MAX CHAMPIONS $950,000Pending4 beds 3 baths2,379 sq. ft.
8 Sundance Drive, Pomona, CA 91766
MLS# CRCV24030505Listed by: JOHN PALMER BROKER $1,499,000Active7 beds 4 baths
1379 S Gibbs Street, Pomona, CA 91766
MLS# WS24000802Listed by: GREAT WALL REALTY, INC.
Local realty services provided by:CENTURY 21 Epic, CENTURY 21 Affiliated, CENTURY 21 Advantage, CENTURY 21 Wildwood Properties, Inc.
The information being provided by California Regional MLS (Southern California) is for the consumer's personal, non-commercial use and may not be used for any purpose other than to identify prospective properties consumer may be interested in purchasing. Any information relating to real estate for sale referenced on this web site comes from the Internet Data Exchange (IDX) program of the California Regional MLS (Southern California). CENTURY 21 Epic is not a Multiple Listing Service (MLS), nor does it offer MLS access. This website is a service of CENTURY 21 Epic, a broker participant of California Regional MLS (Southern California). This web site may reference real estate listing(s) held by a brokerage firm other than the broker and/or agent who owns this web site.
The accuracy of all information, regardless of source, including but not limited to open house information, square footages and lot sizes, is deemed reliable but not guaranteed and should be personally verified through personal inspection by and/or with the appropriate professionals. The data contained herein is copyrighted by California Regional MLS (Southern California) and is protected by all applicable copyright laws. Any unauthorized dissemination of this information is in violation of copyright laws and is strictly prohibited.
Copyright 2021 California Regional MLS (Southern California). All rights reserved. CRMLS Member Broker: Mike Southwick
This information is deemed reliable but not guaranteed. You should rely on this information only to decide whether or not to further investigate a particular property. BEFORE MAKING ANY OTHER DECISION, YOU SHOULD PERSONALLY INVESTIGATE THE FACTS (e.g. square footage and lot size) with the assistance of an appropriate professional. You may use this information only to identify properties you may be interested in investigating further. All uses except for personal, non-commercial use in accordance with the foregoing purpose are prohibited. Redistribution or copying of this information, any photographs or video tours is strictly prohibited. This information is derived from the Internet Data Exchange (IDX) service provided by San Diego MLS®. Displayed property listings may be held by a brokerage firm other than the broker and/or agent responsible for this display. The information and any photographs and video tours and the compilation from which they are derived is protected by copyright. Compilation © 2020 San Diego MLS®, Inc. SANDICOR Member Broker: Nikki Coppa
Popular searches near 91766
Popular neighborhoods near 91766
- Archibald Ranch, Ontario homes for sale
- Chino, Chino homes for sale
- Creekside, Ontario homes for sale
- Harvest at Upland, Upland homes for sale
- Hidden Hills, Yorba Linda homes for sale
- Homecoming at The Preserve, Chino homes for sale
- Kerrigan Ranch, Yorba Linda homes for sale
- New Haven, Ontario homes for sale
- Olinda Ranch, Brea homes for sale
- Park Place, Ontario homes for sale
- Parkside, Ontario homes for sale
- Rancho Santa Ana del Chino, Ontario homes for sale
- Red Hills Rancho Homes, Rancho Cucamonga homes for sale
- Rolling Ridge, Chino Hills homes for sale
- San Antonio Heights, Upland homes for sale
- Southwest Rancho Cucamonga, Rancho Cucamonga homes for sale
- Upland Hills, Upland homes for sale
- Village Oaks, Chino Hills homes for sale
- Vista del Verde, Yorba Linda homes for sale
- Windmill Creek, Chino Hills homes for sale
Protect your home and budget from life's surprises with an Assurant Home Warranty, backed by a partner that supports you through every step of homeownership. Explore Plans.
©2026 Century 21 Real Estate LLC. All rights reserved. CENTURY 21®, the CENTURY 21 Logo and C21® are service marks owned by Century 21 Real Estate LLC. Century 21 Real Estate LLC fully supports the principles of the Fair Housing Act and the Equal Opportunity Act. Each office is independently owned and operated. Listing information is deemed reliable but not guaranteed accurate.