- Bonita homes for sale
- Bostonia homes for sale
- Casa De Oro-Mount Helix homes for sale
- Chula Vista homes for sale
- Coronado homes for sale
- Crest homes for sale
- El Cajon homes for sale
- Granite Hills homes for sale
- Imperial Beach homes for sale
- Jamul homes for sale
- La Mesa homes for sale
- La Presa homes for sale
- Lemon Grove homes for sale
- National City homes for sale
- Otay Mesa homes for sale
- Rancho San Diego homes for sale
- San Ysidro homes for sale
- Santee homes for sale
- Spring Valley homes for sale
- Winter Gardens homes for sale
91902, CA - homes for sale
2 of 2 results displayed
- Open Sat, 10am to 1pm
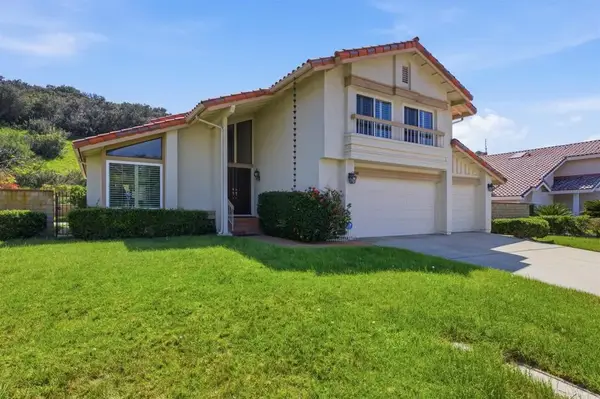 $1,150,000Active4 beds 2 baths2,413 sq. ft.
1066 Surrey Drive, Bonita, CA 91902
MLS# PTP2603716Listed by: REAL BROKER - Open Wed, 11am to 1pm
 $1,150,000Active4 beds 2 baths2,413 sq. ft.
1066 Surrey Drive, Bonita, CA 91902
MLS# PTP2603716Listed by: REAL BROKER
Local realty services provided by:CENTURY 21 Affiliated, CENTURY 21 Epic
This information is deemed reliable but not guaranteed. You should rely on this information only to decide whether or not to further investigate a particular property. BEFORE MAKING ANY OTHER DECISION, YOU SHOULD PERSONALLY INVESTIGATE THE FACTS (e.g. square footage and lot size) with the assistance of an appropriate professional. You may use this information only to identify properties you may be interested in investigating further. All uses except for personal, non-commercial use in accordance with the foregoing purpose are prohibited. Redistribution or copying of this information, any photographs or video tours is strictly prohibited. This information is derived from the Internet Data Exchange (IDX) service provided by San Diego MLS®. Displayed property listings may be held by a brokerage firm other than the broker and/or agent responsible for this display. The information and any photographs and video tours and the compilation from which they are derived is protected by copyright. Compilation © 2020 San Diego MLS®, Inc. SANDICOR Member Broker: Nikki Coppa
The information being provided by California Regional MLS (Southern California) is for the consumer's personal, non-commercial use and may not be used for any purpose other than to identify prospective properties consumer may be interested in purchasing. Any information relating to real estate for sale referenced on this web site comes from the Internet Data Exchange (IDX) program of the California Regional MLS (Southern California). CENTURY 21 Epic is not a Multiple Listing Service (MLS), nor does it offer MLS access. This website is a service of CENTURY 21 Epic, a broker participant of California Regional MLS (Southern California). This web site may reference real estate listing(s) held by a brokerage firm other than the broker and/or agent who owns this web site.
The accuracy of all information, regardless of source, including but not limited to open house information, square footages and lot sizes, is deemed reliable but not guaranteed and should be personally verified through personal inspection by and/or with the appropriate professionals. The data contained herein is copyrighted by California Regional MLS (Southern California) and is protected by all applicable copyright laws. Any unauthorized dissemination of this information is in violation of copyright laws and is strictly prohibited.
Copyright 2021 California Regional MLS (Southern California). All rights reserved. CRMLS Member Broker: Mike Southwick
Popular searches near 91902
Popular neighborhoods near 91902
- Bay Terraces, San Diego homes for sale
- Bonita, Bonita homes for sale
- Colony of la Presa, Spring Valley homes for sale
- Countryside, Chula Vista homes for sale
- Eastlake Greens, Chula Vista homes for sale
- EastLake Shores, Chula Vista homes for sale
- Heritage, Chula Vista homes for sale
- Heritage Hills, Chula Vista homes for sale
- Jamacha-Lomita, San Diego homes for sale
- La Presa, Spring Valley homes for sale
- Lincoln Acres, National City homes for sale
- Rancho Del Rey, Chula Vista homes for sale
- Rolling Hills Ranch, Chula Vista homes for sale
- Salt Creek Ranch, Chula Vista homes for sale
- San Miguel Ranch, Chula Vista homes for sale
- Skyline, San Diego homes for sale
- Sunbowl, Chula Vista homes for sale
- Terra Nova, Chula Vista homes for sale
- Valencia Park, San Diego homes for sale
- Village of Hillsborough, Chula Vista homes for sale
Protect your home and budget from life's surprises with an Assurant Home Warranty, backed by a partner that supports you through every step of homeownership. Explore Plans.
©2026 Century 21 Real Estate LLC. All rights reserved. CENTURY 21®, the CENTURY 21 Logo and C21® are service marks owned by Century 21 Real Estate LLC. Century 21 Real Estate LLC fully supports the principles of the Fair Housing Act and the Equal Opportunity Act. Each office is independently owned and operated. Listing information is deemed reliable but not guaranteed accurate.