- Bonsall homes for sale
- Camp Pendleton homes for sale
- Cardiff homes for sale
- Cardiff by the Sea homes for sale
- Carlsbad homes for sale
- Elfin Forest homes for sale
- Encinitas homes for sale
- Escondido homes for sale
- Fairbanks Ranch homes for sale
- Fallbrook homes for sale
- Harmony Grove homes for sale
- Hidden Meadows homes for sale
- Lake San Marcos homes for sale
- Oceanside homes for sale
- Oceanside-Escondido homes for sale
- Rancho Santa Fe homes for sale
- San Marcos homes for sale
- Solana Beach homes for sale
- Valley Center homes for sale
- Vista homes for sale
92083, CA - homes for sale
78 of 78 results displayed
- Open Sun, 11am to 3pmNew
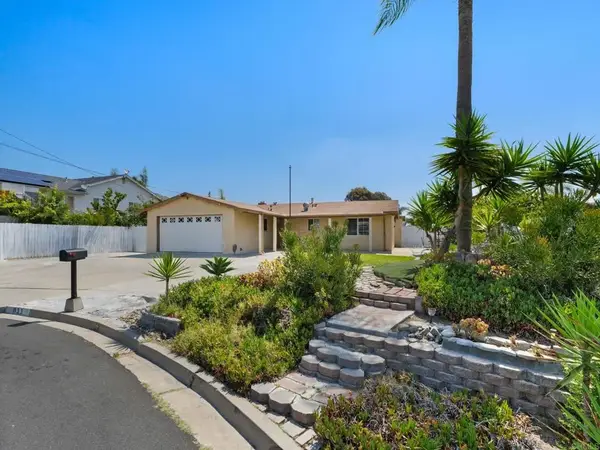
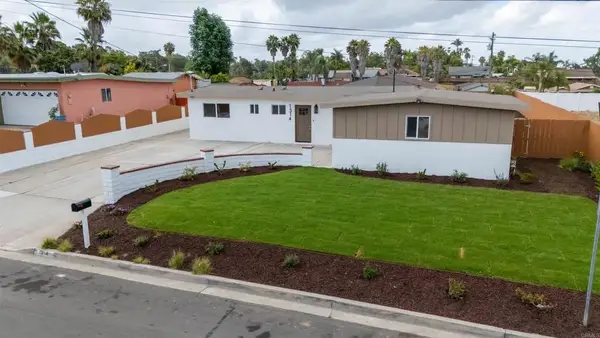
 $739,000Active4 beds 2 baths1,625 sq. ft.
811 Earth Drive, Vista, CA 92083
MLS# NDP2605487Listed by: COLDWELL BANKER REALTY - Open Sun, 11am to 3pmNew
 $739,000Active4 beds 2 baths1,625 sq. ft.
811 Earth Drive, Vista, CA 92083
MLS# NDP2605487Listed by: COLDWELL BANKER REALTY - New
 $420,000Active1 beds 1 baths708 sq. ft.
675 Diamond Way #137, Vista, CA 92083
MLS# 260013563SDListed by: ALTATERA - New
 $585,000Active2 beds 2 baths1,197 sq. ft.
279 Durian St., Vista, CA 92083
MLS# 260013485Listed by: APARTMENT BROKERS NETWORK - New
 $385,000Active1 beds 1 baths708 sq. ft.
669 Diamond Way #235, Vista, CA 92083
MLS# NDP2605258Listed by: COASTAL PREMIER PROPERTIES - New
 $1,420,000Active6 beds 5 baths3,426 sq. ft.
523 Hatherly St, Vista, CA 92083
MLS# 260013265Listed by: EXP REALTY OF SOUTHERN CALIFORNIA, INC. - New
 $1,150,000Active4 beds 3 baths2,302 sq. ft.
2077 Westwood Road, Vista, CA 92083
MLS# NDP2605201Listed by: COLDWELL BANKER WEST - New
 $649,900Active2 beds 2 baths1,370 sq. ft.
191 Bronze Way, Vista, CA 92083
MLS# NDP2605164Listed by: REAL BROKERAGE TECHNOLOGIES  $679,000Pending3 beds 3 baths1,150 sq. ft.
320 Ferrara Way, Vista, CA 92083
MLS# 260012998SDListed by: SERHANT CALIFORNIA, INC.- New
 $1,174,900Active5 beds 8 baths3,086 sq. ft.
675 Grant, Vista, CA 92083
MLS# 260012991Listed by: VIP PREMIER REALTY CORP - New
 $925,000Active4 beds 3 baths1,752 sq. ft.
1314 Bluegrass Road, Vista, CA 92083
MLS# NDP2605136Listed by: AAA REALTY & INVESTMENTS  $899,000Active3 beds 3 baths2,002 sq. ft.
359 Cobalt, Vista, CA 92083
MLS# NDP2605076Listed by: LPT REALTY $899,000Active3 beds 3 baths2,002 sq. ft.
359 Cobalt, Vista, CA 92083
MLS# NDP2605076Listed by: LPT REALTY $759,000Active4 beds 2 baths1,282 sq. ft.
1373 Lawana, Vista, CA 92083
MLS# 260012617Listed by: VALUE T SALES INC DBA PACIFIC PREFERRED
 $899,000Active3 beds 2 baths1,500 sq. ft.
628 Shuboro, Vista, CA 92083
MLS# 260012606Listed by: CENTURY 21 MASTERS $249,000Active2 beds 2 baths1,248 sq. ft.
718 Sycamore #181, Vista, CA 92083
MLS# NDP2604872Listed by: LEAH COLE REALTY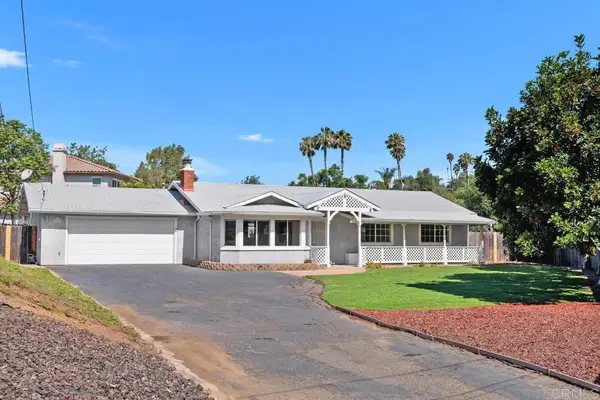 $899,000Pending3 beds 2 baths1,538 sq. ft.
1651 Avocado Drive, Vista, CA 92083
MLS# NDP2604866Listed by: COLDWELL BANKER REALTY $510,000Pending2 beds 2 baths878 sq. ft.
663 Diamond Way #229, Vista, CA 92083
MLS# 260012162SDListed by: KELLER WILLIAMS REALTY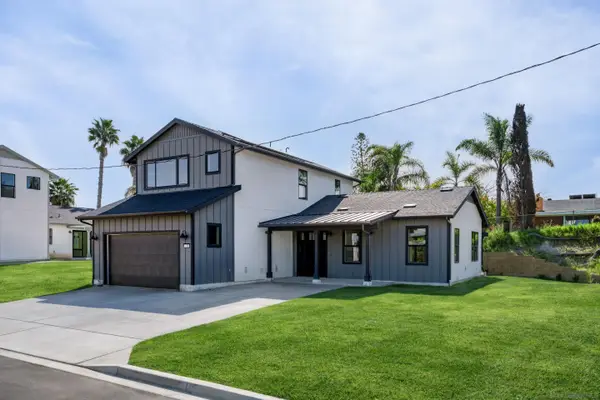 $995,000Active3 beds 3 baths2,006 sq. ft.
710 Passion Court, Vista, CA 92083
MLS# 260012093Listed by: DOLAN REALTY COMPANY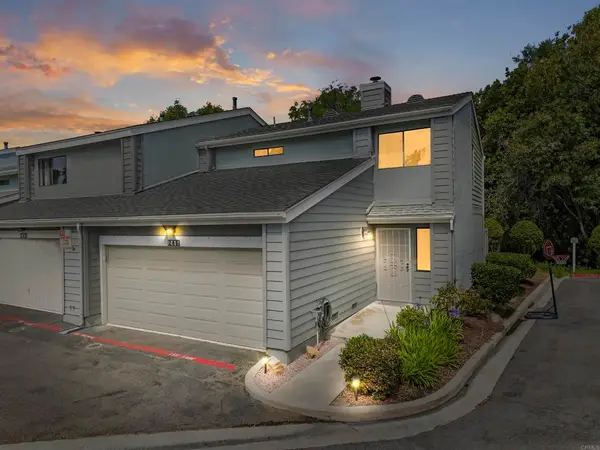 $575,000Active3 beds 3 baths1,386 sq. ft.
285 Durian Street, Vista, CA 92083
MLS# NDP2604815Listed by: EXP REALTY OF CALIFORNIA, INC $575,000Active3 beds 3 baths1,386 sq. ft.
285 Durian Street, Vista, CA 92083
MLS# NDP2604815Listed by: EXP REALTY OF CALIFORNIA, INC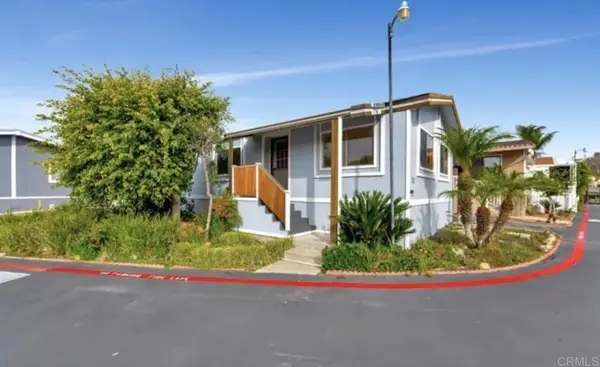 $250,000Active2 beds 2 baths960 sq. ft.
400 N Melrose Dr #22, Vista, CA 92083
MLS# NDP2604798Listed by: PROFESSIONAL REALTY SERVICES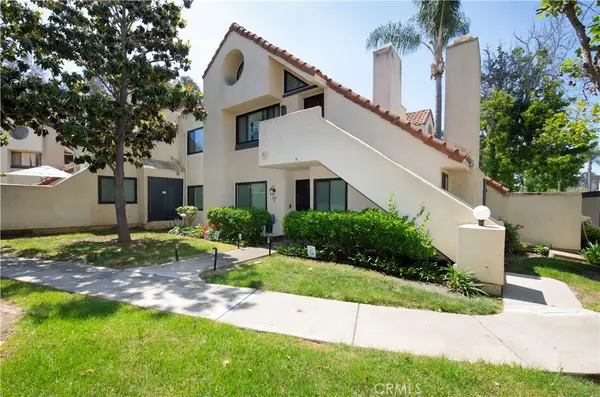 $510,000Pending2 beds 2 baths1,172 sq. ft.
333 N Melrose Drive #E, Vista, CA 92083
MLS# ND26105314Listed by: REAL BROKER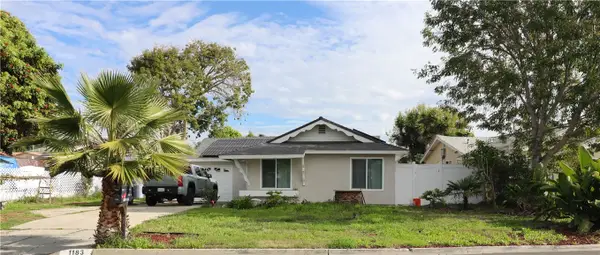 $755,000Active3 beds 2 baths1,292 sq. ft.
1183 Woodrail, Vista, CA 92083
MLS# PW26104699Listed by: 999 INVESTMENTS, INC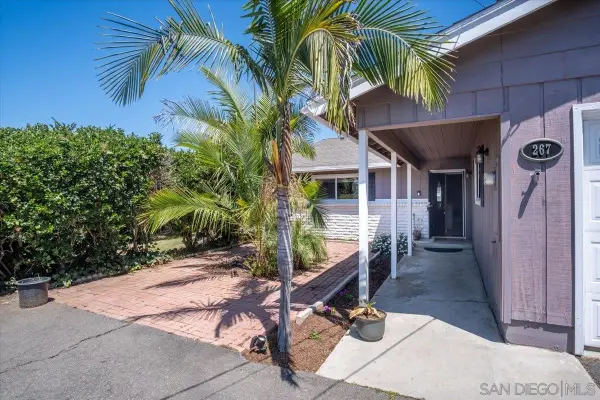 $999,000Active3 beds 2 baths1,424 sq. ft.
267 Hannalei Dr, Vista, CA 92083
MLS# 260011512Listed by: SO-CAL SALES & INVESTMENTS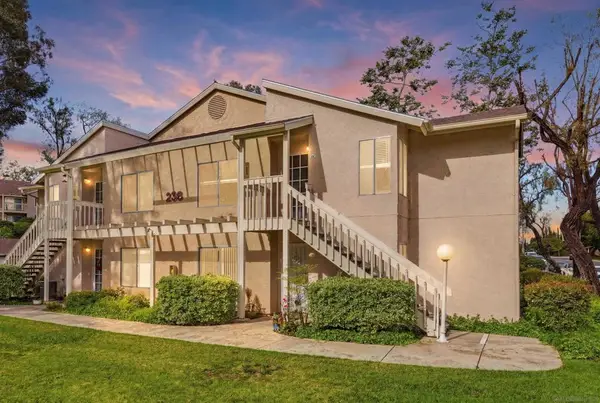 $469,995Active2 beds 2 baths878 sq. ft.
236 Diamond Way #Unit 250, Vista, CA 92083
MLS# 260011404SDListed by: REAL BROKER $329,000Active0 Acres
0 Wallace, Vista, CA 92083
MLS# WS26101892Listed by: COLDWELL BANKER NEW CENTURY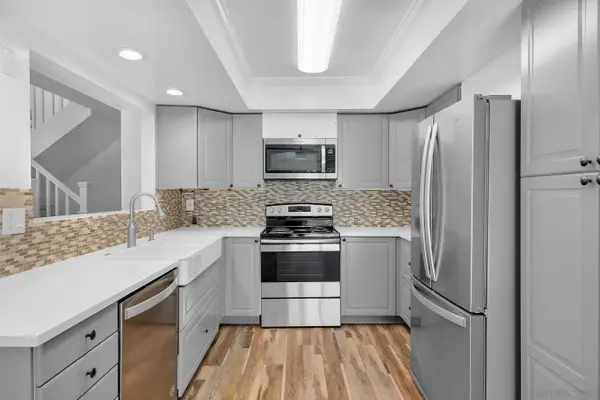 $499,000Active2 beds 2 baths1,159 sq. ft.
687 Ascot Drive #H, Vista, CA 92083
MLS# 260011300Listed by: TENANT PLANET INC.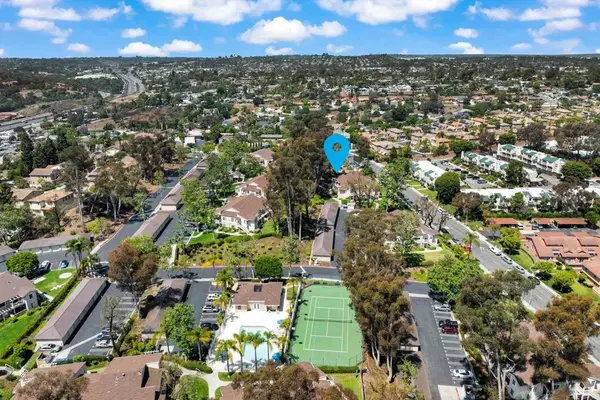 $469,000Active2 beds 2 baths878 sq. ft.
230 Diamond Way #247, Vista, CA 92083
MLS# PTP2603574Listed by: KELLER WILLIAMS REALTY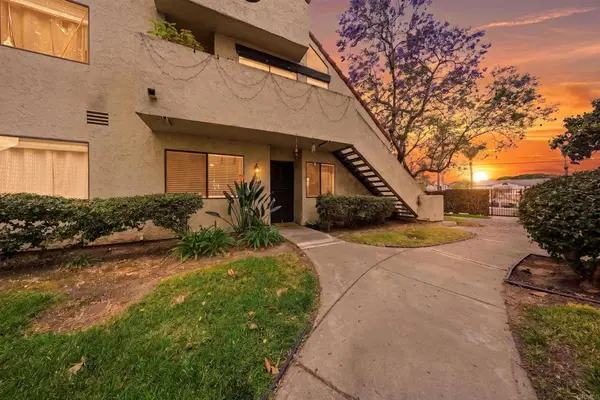 $550,000Active3 beds 2 baths1,298 sq. ft.
341 N Melrose Drive #E, Vista, CA 92083
MLS# NDP2604432Listed by: EXP REALTY OF CALIFORNIA, INC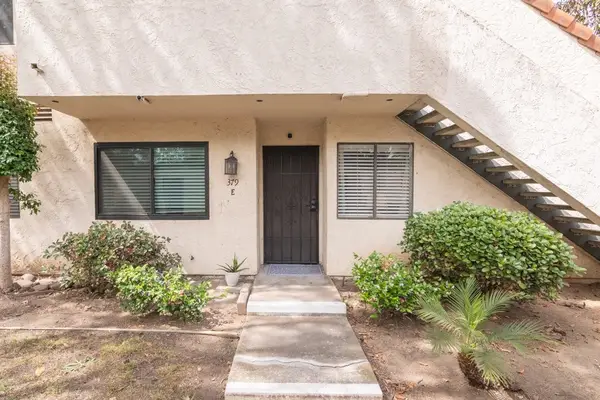 $529,999Active3 beds 2 baths1,298 sq. ft.
379 N Melrose #E, Vista, CA 92083
MLS# SW26099687Listed by: ALLISON JAMES ESTATES & HOMES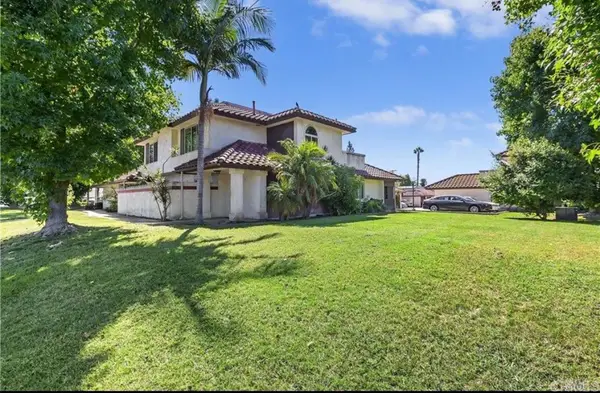 $539,000Pending2 beds 1 baths1,036 sq. ft.
320 Grapevine Road #5, Vista, CA 92083
MLS# NDP2604399Listed by: AARE $899,000Active-- beds -- baths
1855 Kurenda Way, Vista, CA 92083
MLS# NDP2604489Listed by: BEACHSIDE REALTY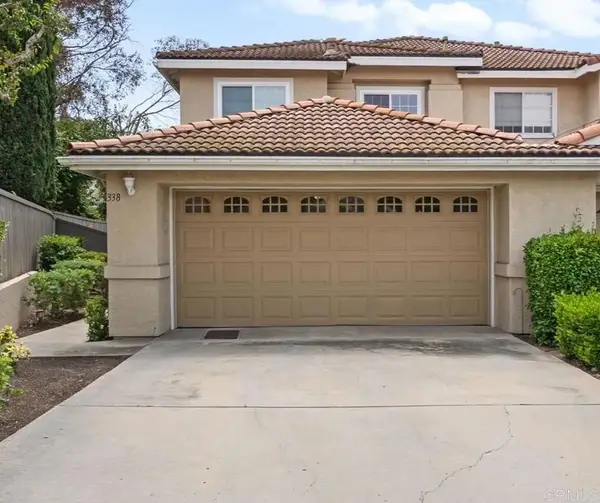 $679,999Active3 beds 3 baths1,266 sq. ft.
338 Ferrara Way, Vista, CA 92083
MLS# PTP2603383Listed by: REAL BROKER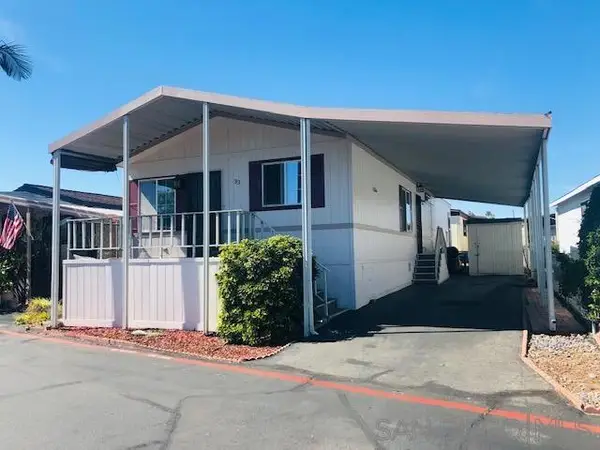 $292,000Pending3 beds 2 baths1,139 sq. ft.
400 N Melrose #33, Vista, CA 92083
MLS# 260010634SDListed by: A TEAM REAL ESTATE $894,000Active4 beds 2 baths2,041 sq. ft.
707 Granada, Vista, CA 92083
MLS# 260010538Listed by: HOMESMART REALTY WEST $1,895,000Active0 Acres
745 S Santa Fe Ave., Vista, CA 92083
MLS# NDP2604200Listed by: LEE & ASSOCIATES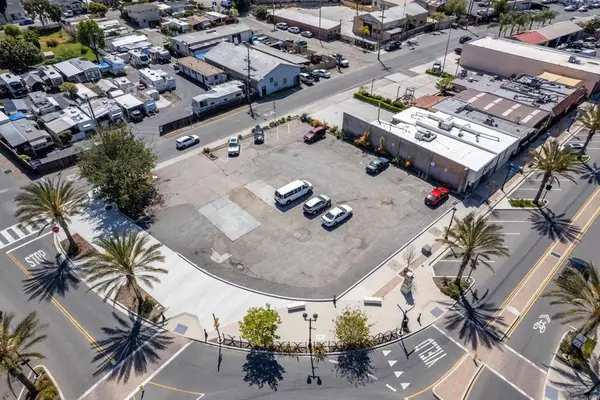 $1,895,000Active0.35 Acres
745 S Santa Fe Ave., Vista, CA 92083
MLS# NDP2604200Listed by: LEE & ASSOCIATES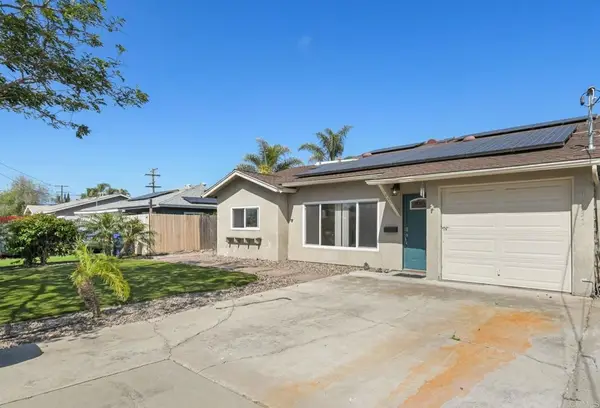 $1,359,999Active4 beds 3 baths2,710 sq. ft.
1231 Teelin Avenue, Vista, CA 92083
MLS# PTP2603176Listed by: COLDWELL BANKER WEST $499,000Active2 beds 2 baths1,008 sq. ft.
320 Grapevine Road #108, Vista, CA 92083
MLS# PTP2603126Listed by: REAL BROKER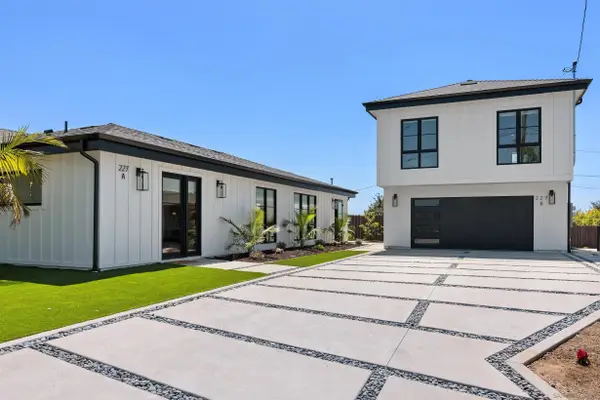 $1,575,000Active4 beds 4 baths2,630 sq. ft.
227 Hill Dr, Vista, CA 92083
MLS# 260009760Listed by: COLDWELL BANKER REALTY $995,000Active4 beds 3 baths2,301 sq. ft.
939 Chablis Lane, Vista, CA 92083
MLS# NDP2603812Listed by: ROA CALIFORNIA INC. $690,000Pending2 beds 1 baths1,080 sq. ft.
976 Olive Avenue, Vista, CA 92083
MLS# NDP2603820Listed by: CUSTOM PROPERTY BROKERS $995,000Active3 beds 3 baths2,006 sq. ft.
702 Passion Court, Vista, CA 92083
MLS# 260009439Listed by: DOLAN REALTY COMPANY $160,000Active2 beds 1 baths
200 Olive #38, Vista, CA 92083
MLS# SW26085641Listed by: REAL BROKERAGE TECHNOLOGIES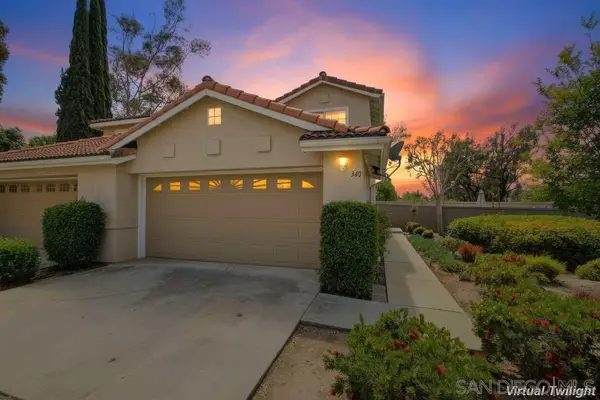 $669,000Pending3 beds 3 baths1,266 sq. ft.
340 Ferrara, Vista, CA 92083
MLS# 260009225SDListed by: COMPASS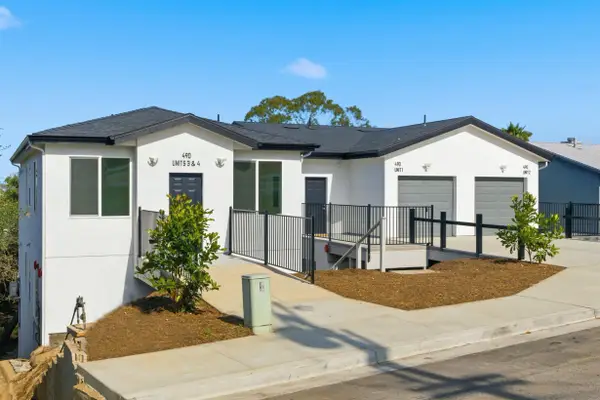 $2,745,000Active12 beds 12 baths5,890 sq. ft.
490 Lado De Loma Dr #1-4, Vista, CA 92083
MLS# 260008453Listed by: KELLER WILLIAMS REALTY $669,000Active3 beds 3 baths1,426 sq. ft.
1772 Promenade Cir, Vista, CA 92083
MLS# 260008376Listed by: EXP REALTY OF CALIFORNIA, INC. $669,000Active3 beds 3 baths1,426 sq. ft.
1772 Promenade Cir, Vista, CA 92083
MLS# 260008376SDListed by: EXP REALTY OF CALIFORNIA, INC. $295,000Active0 Acres
564 Rolling Hills, Vista, CA 92083
MLS# NDP2603322Listed by: EXP REALTY OF SOUTHERN CA $425,900Active1 beds 1 baths892 sq. ft.
333 N Melrose Dr. #F, Vista, CA 92083
MLS# NDP2603247Listed by: COLDWELL BANKER REALTY $925,000Pending4 beds 2 baths1,700 sq. ft.
220 Journeys End, Vista, CA 92083
MLS# NDP2603249Listed by: COLDWELL BANKER REALTY $930,000Active4 beds 3 baths1,798 sq. ft.
648 Cocapah Street, Vista, CA 92083
MLS# NDP2603244Listed by: COMPASS $369,000Pending4 beds 2 baths1,120 sq. ft.
220 Camino Corto #SPC 100, Vista, CA 92083
MLS# 260007566Listed by: EXP REALTY OF CALIFORNIA, INC.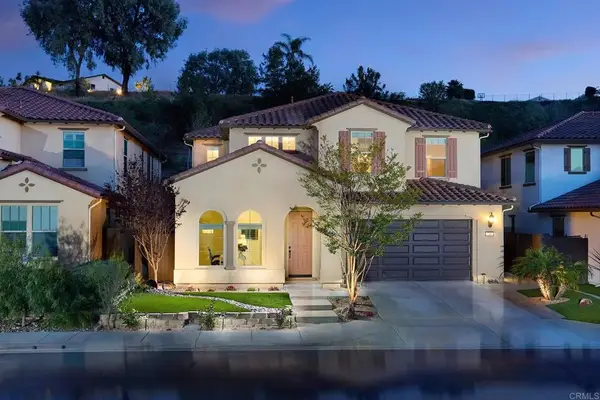 $1,239,000Pending4 beds 3 baths3,368 sq. ft.
219 Flores Lane, Vista, CA 92083
MLS# NDP2603038Listed by: SHEA ADVANTAGE $89,900Active2 beds 2 baths820 sq. ft.
718 Sycamore #21, Vista, CA 92083
MLS# ND26066927Listed by: LEAH COLE REALTY $929,900Pending4 beds 3 baths1,577 sq. ft.
527 Mynah Place, Vista, CA 92083
MLS# NDP2602888Listed by: COASTAL PREMIER PROPERTIES $839,999Active4 beds 2 baths2,335 sq. ft.
469 Lado De Loma Dr., Vista, CA 92083
MLS# 260006887Listed by: AARE $404,500Pending1 beds 1 baths892 sq. ft.
333 N Melore Drive #D, Vista, CA 92083
MLS# 260006686SDListed by: CENTURY 21 AFFILIATED $289,900Active3 beds 2 baths1,368 sq. ft.
718 Sycamore #14, Vista, CA 92083
MLS# NDP2602518Listed by: PACIFIC HOMES $1,399,999Pending5 beds 4 baths3,381 sq. ft.
1517 Leonis Pl, Vista, CA 92083
MLS# 260011507Listed by: REAL BROKER $555,000Pending3 beds 2 baths1,492 sq. ft.
1364 Bobolink Dr., Vista, CA 92083
MLS# NDP2602016Listed by: EXP REALTY OF SOUTHERN CA $16,000Active0 Acres
243 G-4, Unincorporated, CA 93535
MLS# SR24221347Listed by: WILLIAM RYAN REAL ESTATE BROKER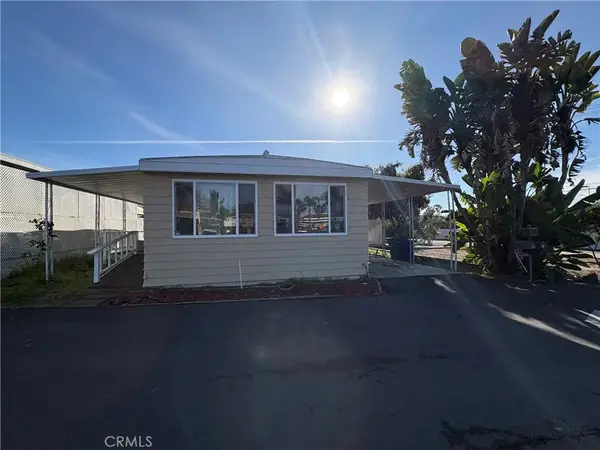 $160,000Active2 beds 2 baths1,224 sq. ft.
718 Sycamore #19, Vista, CA 92083
MLS# IG26040890Listed by: KW THE LAKES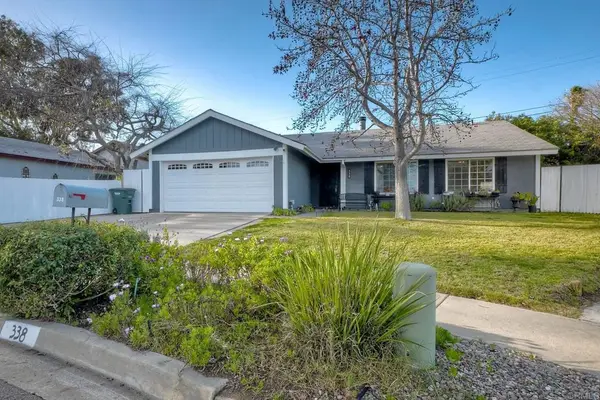 $899,000Pending4 beds 2 baths1,390 sq. ft.
338 Rancho Vista Place, Vista, CA 92083
MLS# NDP2601612Listed by: REALTY PLACE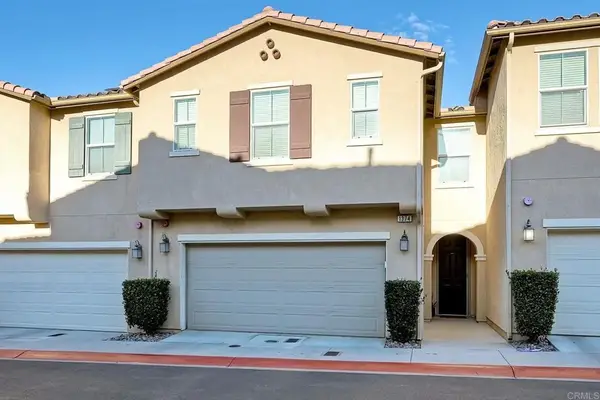 $739,000Active3 beds 3 baths1,679 sq. ft.
1374 Palo Verde Way, Vista, CA 92083
MLS# NDP2601542Listed by: LILY FIELD REALTY $799,999Pending3 beds 2 baths1,177 sq. ft.
1350 Marabou Lane, Vista, CA 92083
MLS# NDP2602864Listed by: REAL BROKERAGE TECHNOLOGIES $799,999Pending3 beds 2 baths1,177 sq. ft.
1350 Marabou Lane, Vista, CA 92083
MLS# NDP2602864Listed by: REAL BROKERAGE TECHNOLOGIES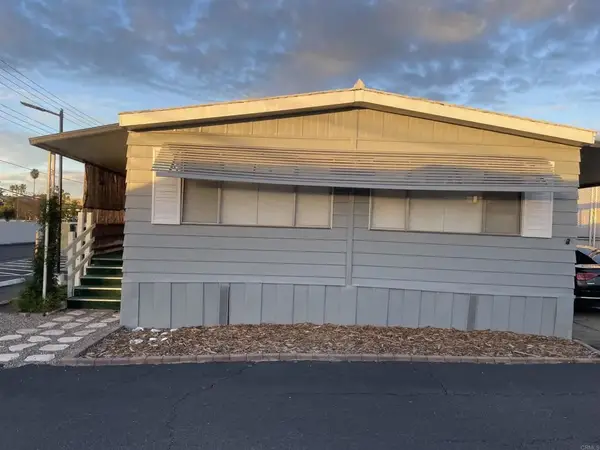 $143,000Active2 beds 2 baths1,224 sq. ft.
718 Sycamore #94, Vista, CA 92083
MLS# NDP2600196Listed by: MORGAN BROWN REAL ESTATE, INC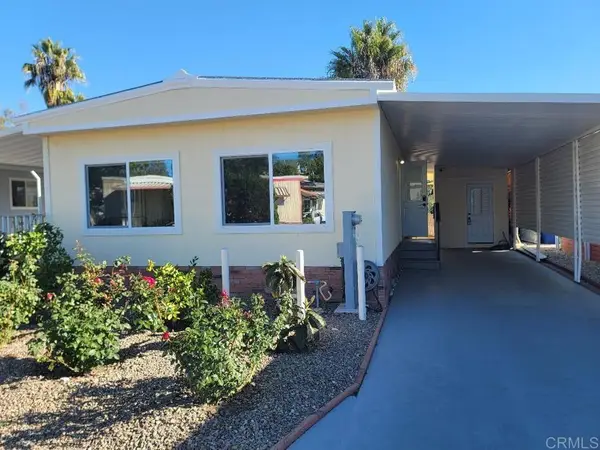 $375,000Pending2 beds 2 baths940 sq. ft.
245 W Bobier Drive #90, Vista, CA 92083
MLS# NDP2511294Listed by: FIRST TEAM REAL ESTATE $969,900Active-- beds 2 baths
224 Astro Court, Vista, CA 92083
MLS# NDP2601421Listed by: ERA RANCH & SEA REALTY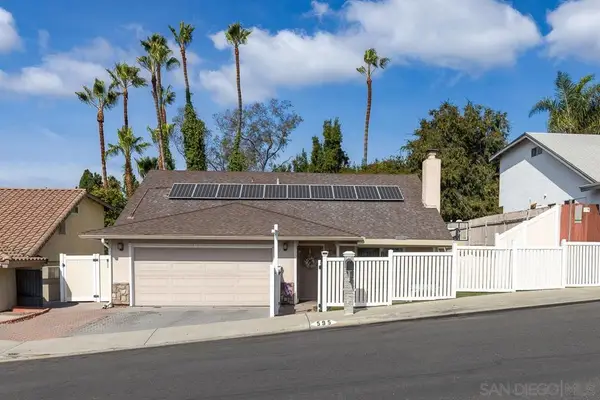 $825,000Pending5 beds 3 baths1,751 sq. ft.
595 Copper Dr., Vista, CA 92083
MLS# 250043567SDListed by: KELLER WILLIAMS REALTY $138,500Active2 beds 2 baths1,176 sq. ft.
718 Sycamore #109, Vista, CA 92083
MLS# NDP2600050Listed by: LEAH COLE REALTY $455,000Pending2 beds 2 baths1,152 sq. ft.
371 N Melrose Drive #D, Vista, CA 92083
MLS# NDP2508255Listed by: COLDWELL BANKER REALTY $8,400,000Active34 beds 28 baths18,195 sq. ft.
628 W California Ave, Vista, CA 92083
MLS# 250036922Listed by: DAVID SANTISTEVAN $11,750,000Active-- beds -- baths27,168 sq. ft.
380 Plymouth Dr, Vista, CA 92083
MLS# 250031535Listed by: BRIDGEPOINT REALTY INC $4,750,000Pending8 Acres
0 Primrose & Lobelia, Vista, CA 92084
MLS# 230006000SDListed by: COMPASS $4,750,000Pending0 Acres
000 Primrose & Lobelia #000, Vista, CA 92084
MLS# 230006000Listed by: COMPASS
Local realty services provided by:CENTURY 21 Adams & Barnes, CENTURY 21 Affiliated
The information being provided by California Regional MLS (Southern California) is for the consumer's personal, non-commercial use and may not be used for any purpose other than to identify prospective properties consumer may be interested in purchasing. Any information relating to real estate for sale referenced on this web site comes from the Internet Data Exchange (IDX) program of the California Regional MLS (Southern California). CENTURY 21 Adams & Barnes is not a Multiple Listing Service (MLS), nor does it offer MLS access. This website is a service of CENTURY 21 Adams & Barnes, a broker participant of California Regional MLS (Southern California). This web site may reference real estate listing(s) held by a brokerage firm other than the broker and/or agent who owns this web site.
The accuracy of all information, regardless of source, including but not limited to open house information, square footages and lot sizes, is deemed reliable but not guaranteed and should be personally verified through personal inspection by and/or with the appropriate professionals. The data contained herein is copyrighted by California Regional MLS (Southern California) and is protected by all applicable copyright laws. Any unauthorized dissemination of this information is in violation of copyright laws and is strictly prohibited.
Copyright 2021 California Regional MLS (Southern California). All rights reserved. CRMLS Member Broker: Thomas Adams
This information is deemed reliable but not guaranteed. You should rely on this information only to decide whether or not to further investigate a particular property. BEFORE MAKING ANY OTHER DECISION, YOU SHOULD PERSONALLY INVESTIGATE THE FACTS (e.g. square footage and lot size) with the assistance of an appropriate professional. You may use this information only to identify properties you may be interested in investigating further. All uses except for personal, non-commercial use in accordance with the foregoing purpose are prohibited. Redistribution or copying of this information, any photographs or video tours is strictly prohibited. This information is derived from the Internet Data Exchange (IDX) service provided by San Diego MLS®. Displayed property listings may be held by a brokerage firm other than the broker and/or agent responsible for this display. The information and any photographs and video tours and the compilation from which they are derived is protected by copyright. Compilation © 2020 San Diego MLS®, Inc. SANDICOR Member Broker: Nikki Coppa
Popular searches near 92083
Popular neighborhoods near 92083
- Calavera Hills, Carlsbad homes for sale
- Guajome, Oceanside homes for sale
- Henie Hills, Oceanside homes for sale
- Industrial Corridor, Carlsbad homes for sale
- Ivey Ranch / Rancho Del Oro, Oceanside homes for sale
- Jeffries Ranch, Oceanside homes for sale
- Lake, Oceanside homes for sale
- Mira Costa, Oceanside homes for sale
- Ocean Hills, Oceanside homes for sale
- Ocean Hills Country Club, Oceanside homes for sale
- Oceana, Oceanside homes for sale
- Orleavo Heights, Vista homes for sale
- Peacock, Oceanside homes for sale
- Rancho Carlsbad, Carlsbad homes for sale
- Rancho Vista Estates, Vista homes for sale
- Robertson Ranch, Carlsbad homes for sale
- Robertson Ranch West Village, Carlsbad homes for sale
- Shadowridge, Vista homes for sale
- Tamarack Point, Carlsbad homes for sale
- Tri-City, Oceanside homes for sale
Protect your home and budget from life's surprises with an Assurant Home Warranty, backed by a partner that supports you through every step of homeownership. Explore Plans.
©2026 Century 21 Real Estate LLC. All rights reserved. CENTURY 21®, the CENTURY 21 Logo and C21® are service marks owned by Century 21 Real Estate LLC. Century 21 Real Estate LLC fully supports the principles of the Fair Housing Act and the Equal Opportunity Act. Each office is independently owned and operated. Listing information is deemed reliable but not guaranteed accurate.