- Aguanga homes for sale
- Anza homes for sale
- Beaumont homes for sale
- Cabazon homes for sale
- East Hemet homes for sale
- French Valley homes for sale
- Green Acres homes for sale
- Hemet homes for sale
- Hemet-San Jacinto homes for sale
- Homeland homes for sale
- Idyllwild homes for sale
- Idyllwild-Pine Cove homes for sale
- Lake Riverside homes for sale
- Mountain Center homes for sale
- Sage homes for sale
- San Gorgonio Pass homes for sale
- San Jacinto homes for sale
- Temecula homes for sale
- Valle Vista homes for sale
- Winchester homes for sale
92544, CA - homes for sale
5 of 5 results displayed
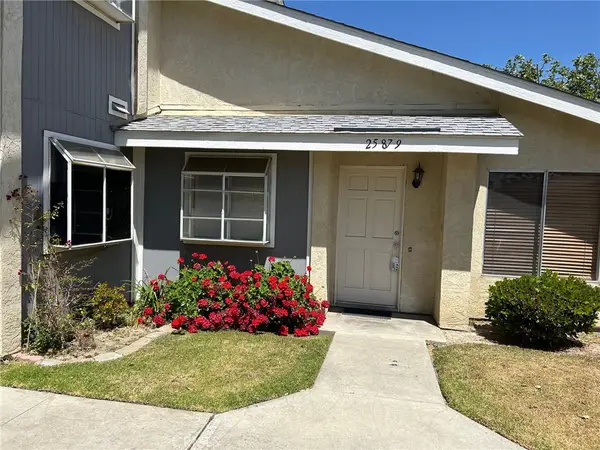
 $197,000Active1 beds 1 baths750 sq. ft.
25879 Baylor, Hemet, CA 92544
MLS# SW26105283Listed by: CENTURY 21 MASTERS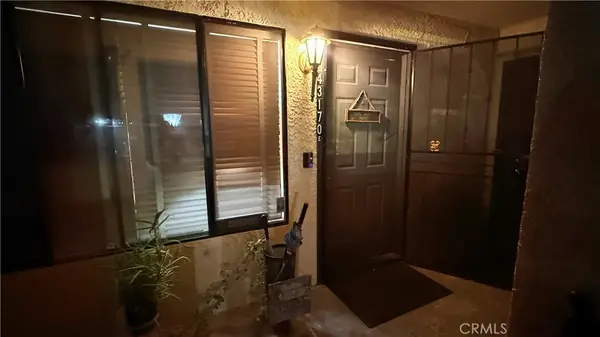 $285,000Active2 beds 2 baths1,384 sq. ft.
43170 Wall #E, Hemet, CA 92544
MLS# SW26063468Listed by: CENTURY 21 MASTERS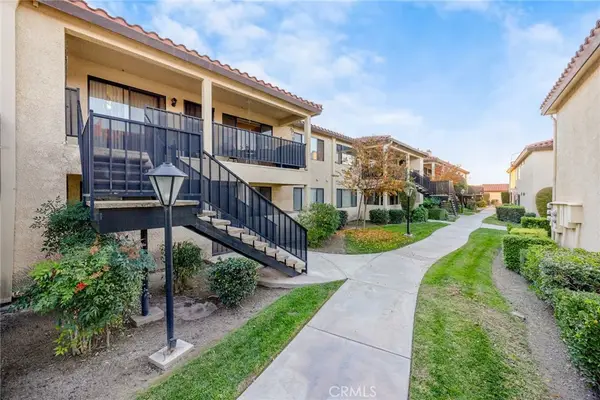 $245,000Pending2 beds 2 baths1,140 sq. ft.
43195 Andrade Avenue #L, Hemet, CA 92544
MLS# CV25266022Listed by: MAINSTREET REALTORS $209,000Active1 beds 1 baths750 sq. ft.
25929 Baylor Way, Hemet, CA 92544
MLS# IV25194560Listed by: CENTURY 21 MASTERS $220,000Active2 beds 1 baths860 sq. ft.
25899 Baylor Way, Hemet, CA 92544
MLS# IV25120604Listed by: L & L REALTORS
Local realty services provided by:CENTURY 21 Select Real Estate, Inc.
The information being provided by California Regional MLS (Southern California) is for the consumer's personal, non-commercial use and may not be used for any purpose other than to identify prospective properties consumer may be interested in purchasing. Any information relating to real estate for sale referenced on this web site comes from the Internet Data Exchange (IDX) program of the California Regional MLS (Southern California). CENTURY 21 Select Real Estate, Inc. is not a Multiple Listing Service (MLS), nor does it offer MLS access. This website is a service of CENTURY 21 Select Real Estate, Inc., a broker participant of California Regional MLS (Southern California). This web site may reference real estate listing(s) held by a brokerage firm other than the broker and/or agent who owns this web site.
The accuracy of all information, regardless of source, including but not limited to open house information, square footages and lot sizes, is deemed reliable but not guaranteed and should be personally verified through personal inspection by and/or with the appropriate professionals. The data contained herein is copyrighted by California Regional MLS (Southern California) and is protected by all applicable copyright laws. Any unauthorized dissemination of this information is in violation of copyright laws and is strictly prohibited.
Copyright 2021 California Regional MLS (Southern California). All rights reserved.
Popular searches near 92544
Protect your home and budget from life's surprises with an Assurant Home Warranty, backed by a partner that supports you through every step of homeownership. Explore Plans.
©2026 Century 21 Real Estate LLC. All rights reserved. CENTURY 21®, the CENTURY 21 Logo and C21® are service marks owned by Century 21 Real Estate LLC. Century 21 Real Estate LLC fully supports the principles of the Fair Housing Act and the Equal Opportunity Act. Each office is independently owned and operated. Listing information is deemed reliable but not guaranteed accurate.