- Canyon Lake homes for sale
- El Sobrante homes for sale
- Elsinore Valley homes for sale
- Good Hope homes for sale
- Lake Elsinore homes for sale
- Lake Mathews homes for sale
- Lakeland Village homes for sale
- Lakeview homes for sale
- Mead Valley homes for sale
- Meadowbrook homes for sale
- Menifee homes for sale
- Nuevo homes for sale
- Perris homes for sale
- Perris Valley homes for sale
- Quail Valley homes for sale
- Romoland homes for sale
- Sun City homes for sale
- Temescal Valley homes for sale
- Warm Springs homes for sale
- Woodcrest homes for sale
92570, CA - homes for sale
273 of 273 results displayed
- Coming Soon
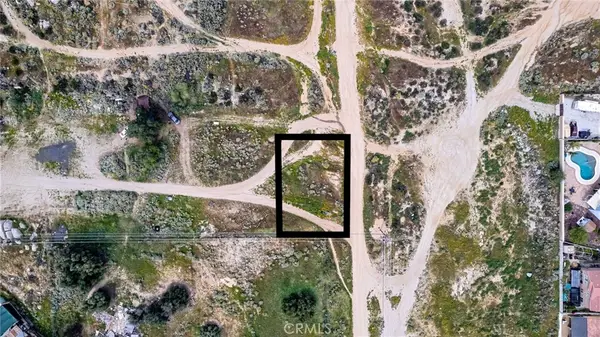
 $299,000Coming Soon-- Acres
0 Yucca Rd, Perris, CA 92570
MLS# IV26098217Listed by: HOMELINK REALTY INC. - New
 $749,000Active7 beds 5 baths3,147 sq. ft.
217 E 5th Street, Perris, CA 92570
MLS# IV26097646Listed by: KELLER WILLIAMS RIVERSIDE CENT - Coming Soon
 $68,000Coming Soon-- Acres
14873 Riza, Perris, CA 92220
MLS# DW26096612Listed by: KELLER WILLIAMS SELA - New
 $655,000Active4 beds 2 baths1,362 sq. ft.
23475 Stafford Street, Perris, CA 92570
MLS# 226056287Listed by: DOMBROSKI REALTY - Coming Soon$1,699,000Coming Soon7 beds 4 baths
23841 Piedras, Lake Mathews, CA 92570
MLS# OC26096927Listed by: NORMAN A. QUINTERO, BROKER - New
 $689,000Active3 beds 2 baths1,821 sq. ft.
21475 Webster, Perris, CA 92570
MLS# IV26095595Listed by: VAN ESTATES, INC - New
 $299,000Active2 beds 2 baths1,000 sq. ft.
22775 Raymond, Perris, CA 92570
MLS# TR26095157Listed by: ELEVATE REAL ESTATE AGENCY - New
 $650,000Active0 Acres
1 Dawson Canyon Rd, Lake Mathews, CA 92570
MLS# OC26095186Listed by: HOMEQUEST REAL ESTATE - New
 $580,000Active4 beds 2 baths1,980 sq. ft.
26201 State Highway 74, Perris, CA 92570
MLS# CV26095125Listed by: ASH REALTY - New
 $1,050,000Active4 beds 3 baths2,450 sq. ft.
23064 Miners Road, Perris, CA 92579
MLS# IG26088894Listed by: KW COLLEGE PARK - New
 $659,900Active4 beds 3 baths3,322 sq. ft.
562 Quigley Lane, Perris, CA 92570
MLS# IG26056419Listed by: WOLF REAL ESTATE & LOANS - New
 $320,000Active3 beds 2 baths1,248 sq. ft.
339 Altura Dr., Perris, CA 92570
MLS# PW26091263Listed by: KC REALTY GROUP - Coming Soon
 $399,900Coming Soon2 beds 2 baths
622 Roadrunner Way, Perris, CA 92570
MLS# DW26091097Listed by: EHOMES - New
 $564,900Active4 beds 2 baths1,808 sq. ft.
2409 Tulip Dr, Perris, CA 92570
MLS# NDP2604045Listed by: DONVITO REALTY - New
 $6,950,000Active-- beds -- baths29,560 sq. ft.
876 S D, Perris, CA 92570
MLS# PW26090989Listed by: JAMES HEBISH BROKER - New
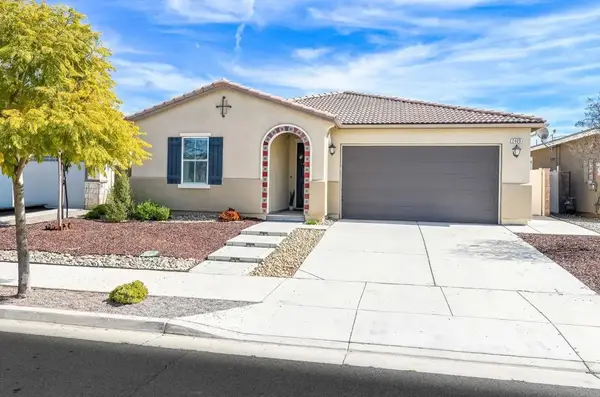
 $690,000Active3 beds 2 baths1,842 sq. ft.
20970 Rider, Perris, CA 92570
MLS# IV26090900Listed by: BETTER HOMES AND GARDENS REAL ESTATE CHAMPIONS - New
 $170,000Active0 Acres
257 W 1st, Perris, CA 92570
MLS# CV26090139Listed by: ACEVEDO REAL ESTATE PROFESSIONALS - New
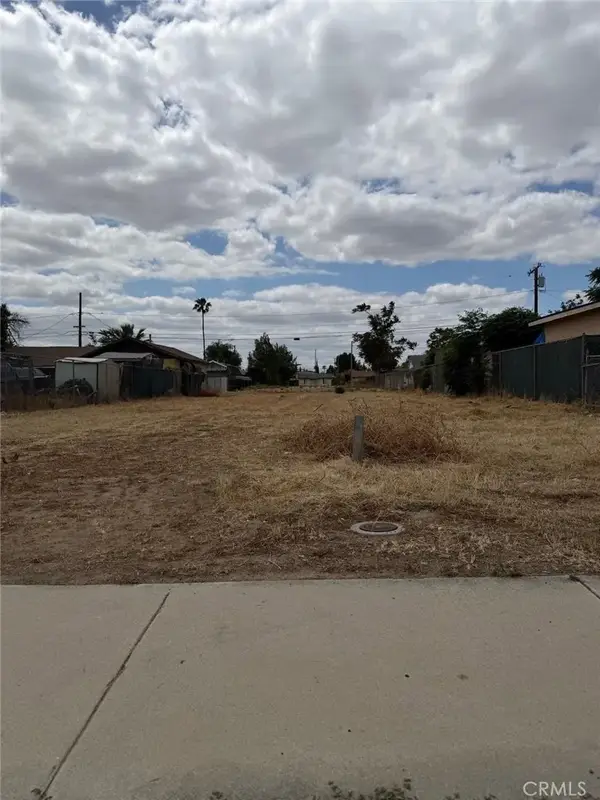
 $200,000Active0.37 Acres
20970 Rider, Perris, CA 92570
MLS# IV26088750Listed by: BETTER HOMES AND GARDENS REAL ESTATE CHAMPIONS  $195,000Active0 Acres
0 Mary, Perris, CA 92570
MLS# PW26089204Listed by: REMAX TIFFANY REAL ESTATE $550,000Active0 Acres
24657 State Highway 74, Perris, CA 92570
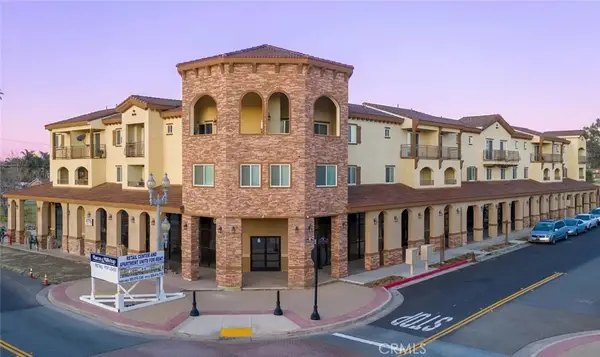
MLS# DW26088803Listed by: REMAX SKY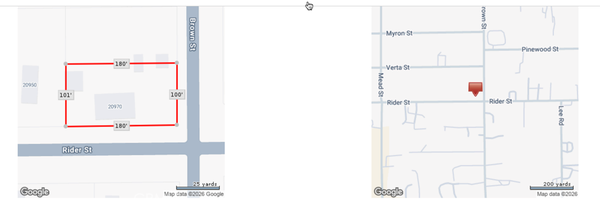 $890,000Active3 beds 2 baths1,842 sq. ft.
20970 Rider Street, Perris, CA 92570
MLS# IV26087178Listed by: BETTER HOMES AND GARDENS REAL ESTATE CHAMPIONS $580,000Active4 beds 2 baths1,654 sq. ft.
18420 Decker, Perris, CA 92570
MLS# IV26087204Listed by: PRICE REAL ESTATE GROUP, INC $659,900Active4 beds 3 baths3,322 sq. ft.
562 Quigley Lane, Perris, CA 92570
MLS# IG26056419Listed by: WOLF REAL ESTATE & LOANS $330,000Active0 Acres
0 Royal Oak Dr, Perris, CA 92570
MLS# IV26087775Listed by: RE/MAX TIME REALTY $360,000Active7 beds 4 baths2,200 sq. ft.
17637 Poquito Lane, Perris, CA 92570
MLS# IV26086660Listed by: PAK HOME REALTY $700,000Active3 beds 3 baths1,736 sq. ft.
22540 Markham Street, Perris, CA 92570
MLS# IV26087152Listed by: PRICE REAL ESTATE GROUP, INC $1,150,000Active4 beds 2 baths2,600 sq. ft.
16620 Rocky Glen Road, Perris, CA 92570
MLS# CV26078658Listed by: NEST REAL ESTATE
 $799,000Active3.7 Acres
3 Highway 74, Perris, CA 92570
MLS# SW26085122Listed by: CENTURY 21 MASTERS $1,000,000Active0 Acres
0 Apn# 287280017, Perris, CA 92570
MLS# SW26083805Listed by: EXIT ALLIANCE REALTY $649,950Active3 beds 3 baths2,906 sq. ft.
239 Monument Parkway, Perris, CA 92570
MLS# OC26080415Listed by: EXP REALTY OF CALIFORNIA INC $489,000Active4 beds 2 baths1,600 sq. ft.
22678 La More, Perris, CA 92570
MLS# SW26083621Listed by: SIMPLIHOM $1,099,990Active5 beds 4 baths3,571 sq. ft.
20370 Lakeridge, Perris, CA 92570
MLS# IV26082692Listed by: RE/MAX HORIZON $875,000Active4 beds 2 baths2,097 sq. ft.
20950 Warren, Perris, CA 92570
MLS# TR26068144Listed by: TOP PRODUCERS REALTY PARTNERS- Coming Soon
 $599,900Coming Soon3 beds 2 baths
21520 Gold Valley, Perris, CA 92570
MLS# IV26082738Listed by: M G R REAL ESTATE  $585,000Active4 beds 3 baths2,640 sq. ft.
3320 Jack Rabbit Court, Perris, CA 92570
MLS# IV26082407Listed by: JOSEPH DODGE, BROKER $439,900Active2 beds 2 baths1,344 sq. ft.
602 Roadrunner, Perris, CA 92570
MLS# CV26082883Listed by: OPTION ONE REAL ESTATE $155,000Active0 Acres
0 Kinney, Perris, CA 92570
MLS# IV26081902Listed by: KELLER WILLIAMS RIVERSIDE CENT $699,990Active5 beds 3 baths2,695 sq. ft.
1562 Mckimball Road, Perris, CA 92570
MLS# SW26078829Listed by: EXP REALTY OF SOUTHERN CALIFORNIA, INC. $835,000Pending4 beds 3 baths3,200 sq. ft.
19247 Mountain Shadow Lane, Perris, CA 92570
MLS# IV26080215Listed by: FIRST TEAM REAL ESTATE $549,000Active4 beds 2 baths1,479 sq. ft.
22661 Fisher Street, Perris, CA 92570
MLS# IV26080624Listed by: GOOD LIFE REALTORS INC $564,999Active4 beds 2 baths1,595 sq. ft.
23800 W Ellis Road, Perris, CA 92570
MLS# 226046015Listed by: JASON J. COLLINS REAL ESTATE $650,000Active0 Acres
0 Park Ave, Perris, CA 92570
MLS# IV26079304Listed by: CASTANEDA REAL ESTATE $310,000Active2 beds 1 baths720 sq. ft.
20276 Oleander, Perris, CA 92570
MLS# PW26077267Listed by: GISELLE ONGKEKO, BROKER $475,000Active3 beds 2 baths1,012 sq. ft.
17035 Hidalgo, Perris, CA 92570
MLS# IV26063484Listed by: BERKSHIRE HATHAWAY HOMESERVICES CALIFORNIA REALTY $735,000Active4 beds 3 baths3,350 sq. ft.
353 Caldera, Perris, CA 92570
MLS# SW26077020Listed by: COLDWELL BANKER REALTY $525,000Pending3 beds 2 baths1,460 sq. ft.
23205 Wildwood, Perris, CA 92570
MLS# SW26076802Listed by: REAL BROKERAGE TECHNOLOGIES $140,000Active0 Acres
0 Old Elsinore #10, Perris, CA 92570
MLS# DW26075108Listed by: WALLSTREET REALTY $130,000Active0 Acres
24330 El Toro, Perris, CA 92570
MLS# IG26073216Listed by: EXP REALTY OF CALIFORNIA INC. $300,000Active60.28 Acres
0 Dawson Canyon, Perris, CA 92570
MLS# IV26074915Listed by: COLDWELL BANKER REALTY $625,000Active3 beds 2 baths1,536 sq. ft.
20801 Hollis Drive, Perris, CA 92570
MLS# CV26074609Listed by: CENTURY 21 EXPERIENCE $525,000Active0 Acres
25605 State Highway 74, Perris, CA 92570
MLS# SR26073876Listed by: TEAM HOUSE REAL ESTATE, INC. $320,000Active2.27 Acres
0 Mundo Avenue, Perris, CA 92570
MLS# PW26068722Listed by: ITS KEY TIME $620,000Pending3 beds 4 baths1,886 sq. ft.
13515 Cajalco Road, Perris, CA 92570
MLS# IG26068883Listed by: FIRST TEAM REAL ESTATE $679,000Pending3 beds 2 baths1,320 sq. ft.
18951 Avenue B, Perris, CA 92570
MLS# IV26073860Listed by: RE/MAX TIME REALTY $370,000Active0.46 Acres
0 G Street, Perris, CA 92570
MLS# IV26073626Listed by: TOWER AGENCY $620,000Pending3 beds 4 baths1,886 sq. ft.
13515 Cajalco Road, Perris, CA 92570
MLS# IG26068883Listed by: FIRST TEAM REAL ESTATE $270,000Active0 Acres
0 Tepee, Perris, CA 92570
MLS# SW26072745Listed by: THE REAL ESTATE FIRM $5,500,000Active3 beds 1 baths1,912 sq. ft.
22761 Cajalco, Perris, CA 92570
MLS# IV26071439Listed by: CENTRAL REALTY GROUP $515,000Pending3 beds 2 baths1,680 sq. ft.
21881 Smoketree Street, Perris, CA 92570
MLS# IV26067881Listed by: BERKSHIRE HATHAWAY HOMESERVICES CALIFORNIA REALTY $529,900Pending2 beds 1 baths960 sq. ft.
22401 Ellis Avenue, Perris, CA 92570
MLS# SW26068650Listed by: MARIN REALTY GROUP $788,000Active0 Acres
0 Gavilan, Lake Mathews, CA 92570
MLS# TR26067489Listed by: COLDWELL BANKER TRI-COUNTIES R $295,000Pending3 beds 2 baths1,152 sq. ft.
21591 Oak, Perris, CA 92570
MLS# OC26070566Listed by: REAL BROKER $699,900Active5 beds 5 baths3,809 sq. ft.
182 Monument, Perris, CA 92570
MLS# CV26067053Listed by: THE REAL BROKERAGE, INC. $399,000Active0.85 Acres
22985 Markham, Perris, CA 92570
MLS# IV26067631Listed by: VISTA SOTHEBY'S INTERNATIONAL REALTY $350,000Active3 beds 2 baths1,440 sq. ft.
295 Cochise, Perris, CA 92570
MLS# CV26068051Listed by: REALTY ONE GROUP HOMELINK $589,990Active4 beds 3 baths2,216 sq. ft.
3439 Joshua Tree Court, Perris, CA 92570
MLS# SW26067837Listed by: LPT REALTY, INC $596,684Active4 beds 2 baths2,194 sq. ft.
366 Deer Lane Way, Perris, CA 92570
MLS# SW26068683Listed by: CENTURY 21 MASTERS $620,502Active3 beds 2 baths2,287 sq. ft.
372 Deer Lane Way, Perris, CA 92570
MLS# SW26068696Listed by: CENTURY 21 MASTERS $568,812Pending3 beds 2 baths1,942 sq. ft.
369 Deer Lane Way, Perris, CA 92570
MLS# SW26068607Listed by: CENTURY 21 MASTERS $609,762Pending3 beds 2 baths2,287 sq. ft.
357 Deer Lane Way, Perris, CA 92570
MLS# SW26068618Listed by: CENTURY 21 MASTERS $575,772Pending3 beds 2 baths1,942 sq. ft.
351 Deer Lane Way, Perris, CA 92570
MLS# SW26068625Listed by: CENTURY 21 MASTERS $590,799Pending4 beds 2 baths2,194 sq. ft.
2365 Lionheart Drive, Perris, CA 92570
MLS# SW26068230Listed by: CENTURY 21 MASTERS $5,000,000Active0 Acres
18591 Cajalco, Perris, CA 92570
MLS# PW26061776Listed by: NEW STAR REALTY & INVESTMENT $1,250,000Active4 beds 4 baths2,836 sq. ft.
20948 Onaknoll Drive, Lake Mathews, CA 92570
MLS# IG26049674Listed by: NATIONAL REALTY GROUP $1,800,000Active2 beds 1 baths688 sq. ft.
17751 Lake Mathews, Perris, CA 92570
MLS# SW26063460Listed by: EXIT ALLIANCE REALTY $309,000Pending3 beds 2 baths1,344 sq. ft.
22495 Deprad Street, Perris, CA 92570
MLS# TR26063720Listed by: RE/MAX EMPIRE PROPERTIES $950,000Active4 beds 2 baths1,864 sq. ft.
19260 Santa Rosa Mine, Perris, CA 92570
MLS# SB26063593Listed by: IMPERIAL 7 REALTY $824,900Active4 beds 3 baths2,696 sq. ft.
19488 Eldorado, Perris, CA 92570
MLS# IV26060314Listed by: ALLISON JAMES EST. & HOMES $75,000Active0.44 Acres
0 Ellis, Perris, CA 92570
MLS# SW26062465Listed by: MARIN REALTY GROUP $135,000Active0 Acres
14750 Briley Ct, Perris, CA 92570
MLS# IV26062344Listed by: REALTY MASTERS & ASSOCIATES $299,900Pending3 beds 2 baths1,440 sq. ft.
20540 Verta, Perris, CA 92570
MLS# SW26062426Listed by: COLDWELL BANKER REALTY $199,900Active0 Acres
0 Candy, Perris, CA 92570
MLS# OC26058197Listed by: KVC INVESTMENTS, INC. $925,000Active4 beds 3 baths3,437 sq. ft.
23729 Citrus Avenue, Perris, CA 92570
MLS# IV26058596Listed by: ALTICORE REALTY $740,000Active4 beds 3 baths2,116 sq. ft.
20541 Hunter, Perris, CA 92570
MLS# IV26058096Listed by: CASTANEDA REAL ESTATE $1,795,000Active3 beds 4 baths4,743 sq. ft.
20390 Christo Court, Lake Mathews, CA 92570
MLS# IG26057974Listed by: EXP REALTY OF CALIFORNIA INC. $350,000Active0 Acres
603 S D, Perris, CA 92570
MLS# IV26057648Listed by: CMB REALTY SERVICES $12,500,000Active0 Acres
0 E. Ellis, Perris, CA 92570
MLS# ND26055026Listed by: BERKSHIRE HATHAWAY HOMESERVICES CALIFORNIA PROPERTIES $593,000Pending4 beds 2 baths2,134 sq. ft.
3319 Appalachian, Perris, CA 92570
MLS# SW26049440Listed by: COLDWELL BANKER KIVETT-TEETERS $799,000Active5 beds 3 baths2,496 sq. ft.
13333 Goldenhorn Drive, Corona, CA 92570
MLS# CV26055057Listed by: CH INVESTMENT GROUP, INC. $575,000Active4 beds 2 baths1,771 sq. ft.
453 Cimarron Drive, Perris, CA 92570
MLS# WS26054424Listed by: WEDGEWOOD HOMES REALTY- Open Sun, 10am to 1pm
 $47,000Pending0.19 Acres
0 Cherokee Rd, Perris, CA 92570
MLS# SW26050427Listed by: THE REAL ESTATE FIRM 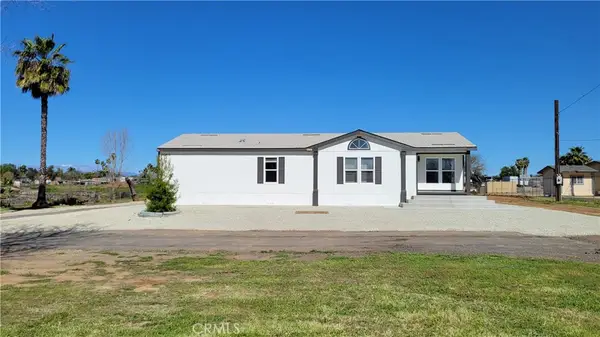 $735,000Pending3 beds 2 baths1,456 sq. ft.
20810 Oleander Avenue, Perris, CA 92570
MLS# IV26048084Listed by: COLDWELL BANKER ASSOC BRKR/CL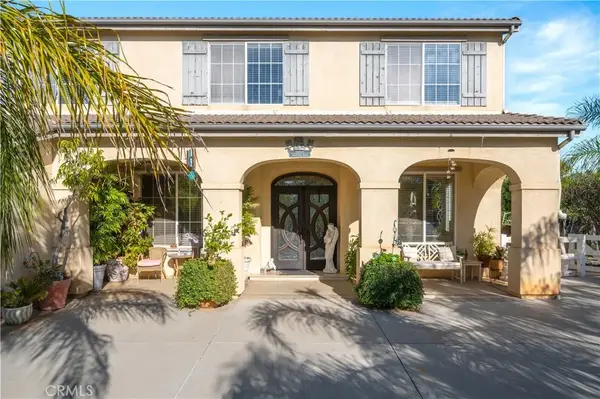 $999,999Active4 beds 3 baths3,725 sq. ft.
18566 Hawkhill, Perris, CA 92570
MLS# BB26043999Listed by: ENRIQUE HENRY VEGA JR. BROKER $1,569,000Active5 beds 5 baths4,292 sq. ft.
14710 Burwood Drive, Lake Mathews, CA 92570
MLS# IV26045604Listed by: GLOBAL REALTY CAPITAL INC.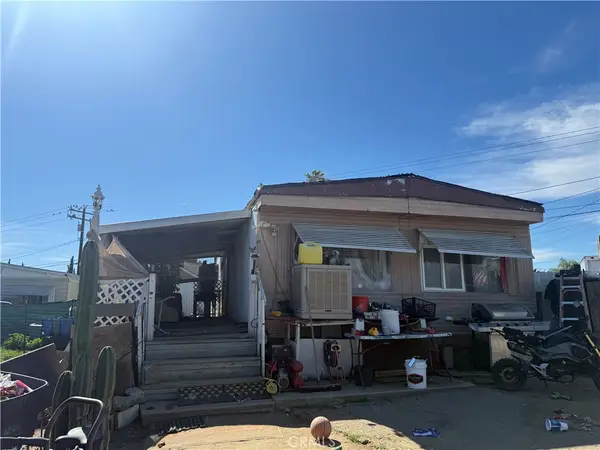 $140,000Pending1 beds 1 baths460 sq. ft.
548 Bond, Perris, CA 92570
MLS# IG26045046Listed by: SMART SELL REAL ESTATE $180,000Pending5.25 Acres
25361 Phillips Street, Perris, CA 92570
MLS# IV26043633Listed by: VISTA SOTHEBY'S INTERNATIONAL REALTY $275,000Active0 Acres
0 Marquez, Perris, CA 92570
MLS# IV26044023Listed by: COLDWELL BANKER TOWN & COUNTRY $549,900Active3 beds 2 baths1,560 sq. ft.
23250 El Nido, Perris, CA 92570
MLS# IV26039679Listed by: PREMIER REAL ESTATE SOLUTIONS $149,000Active0 Acres
39 Burwood, Perris, CA 92570
MLS# SW26042902Listed by: HOMESMART REALTY WEST $500,000Active3 beds 2 baths1,404 sq. ft.
591 W 3rd, Perris, CA 92570
MLS# IG26042453Listed by: SMART SELL REAL ESTATE $1,325,000Active4 beds 4 baths3,356 sq. ft.
23100 Rolling Meadows Drive, Perris, CA 92570
MLS# SW26040560Listed by: MARIN REALTY GROUP $699,000Active0 Acres
14735 Descanso, Lake Mathews, CA 92570
MLS# IV26038198Listed by: KJ REALTY GROUP INC. $1,999,000Active5 beds 3 baths3,723 sq. ft.
14735 Descanso, Lake Mathews, CA 92570
MLS# IV26038729Listed by: KJ REALTY GROUP INC. $641,285Pending5 beds 3 baths3,010 sq. ft.
300 Grand Sky Lane, Perris, CA 92570
MLS# SW26038107Listed by: CENTURY 21 MASTERS $607,900Pending4 beds 3 baths2,583 sq. ft.
2386 Peach Tree Lane, Perris, CA 92570
MLS# SW26038115Listed by: CENTURY 21 MASTERS- Open Sun, 12 to 4pm
 $1,990,000Active5 beds 4 baths3,894 sq. ft.
20976 Bentley Drive, Perris, CA 92570
MLS# SW26027684Listed by: LINK BROKERAGES  $349,999Active0 Acres
0 Olive Ave, Perris, CA 92570
MLS# AR26032212Listed by: WETRUST REALTY $999,880Active4 beds 2 baths2,382 sq. ft.
20705 Onaknoll, Lake Mathews, CA 92570
MLS# IG26033580Listed by: RE/MAX TOP PRODUCERS $375,000Pending3 beds 2 baths1,305 sq. ft.
560 W 10th Street, Perris, CA 92570
MLS# SW26032892Listed by: BERKSHIRE HATHAWAY HOMESERVICES CALIFORNIA PROPERTIES $794,999Active5 beds 5 baths4,000 sq. ft.
332 Monument Parkway, Perris, CA 92570
MLS# PTP2601165Listed by: REAL BROKER $1,500,000Active39.64 Acres
22169 Rocky Hills, Perris, CA 92570
MLS# HD26033046Listed by: CENTURY 21 MASTERS $758,000Active5 beds 3 baths2,432 sq. ft.
22340 Comet Court, Perris, CA 92570
MLS# IV26030767Listed by: HEAVENLY PILIOGLAS, BROKER $499,000Active0 Acres
0 Mauricio St, Perris, CA 92570
MLS# OC26032786Listed by: WEST CAPITAL REAL ESTATE $699,000Pending4 beds 3 baths1,763 sq. ft.
3454 Bryce Canyon, Perris, CA 92570
MLS# SW26031381Listed by: MARIN REALTY GROUP $414,900Active1 beds 1 baths814 sq. ft.
21705 John Street, Perris, CA 92570
MLS# SW26031237Listed by: GOLDEN EAGLE PROPERTIES $420,000Active3 beds 2 baths1,620 sq. ft.
802 Roadrunner Way, Perris, CA 92570
MLS# DW26029925Listed by: T.N.G. REAL ESTATE CONSULTANTS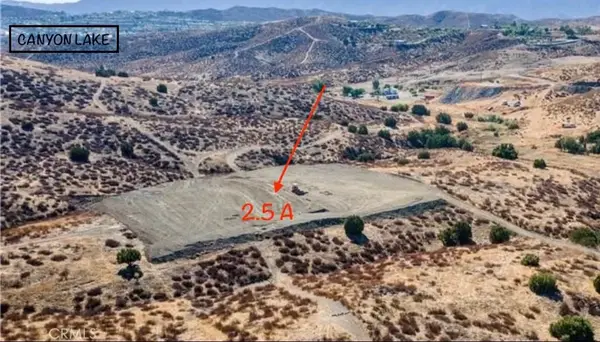 $130,000Active0 Acres
0 Riverside, Perris, CA 92570
MLS# DW26030166Listed by: WALLSTREET REALTY $1,269,000Pending4 beds 4 baths3,953 sq. ft.
14010 Scenic View, Perris, CA 92570
MLS# IG26026718Listed by: REALTY MASTERS & ASSOCIATES $450,000Active0.48 Acres
1 4th Street, Perris, CA 92570
MLS# 219142741DAListed by: KELLER WILLIAMS REALTY $605,000Active2 beds 2 baths1,664 sq. ft.
21131 Martin, Perris, CA 92570
MLS# CV26025602Listed by: HOME VIEW REALTY $549,990Active3 beds 2 baths1,420 sq. ft.
23209 Norrisgrove, Perris, CA 92570
MLS# IV26025623Listed by: OFFERCITY HOMES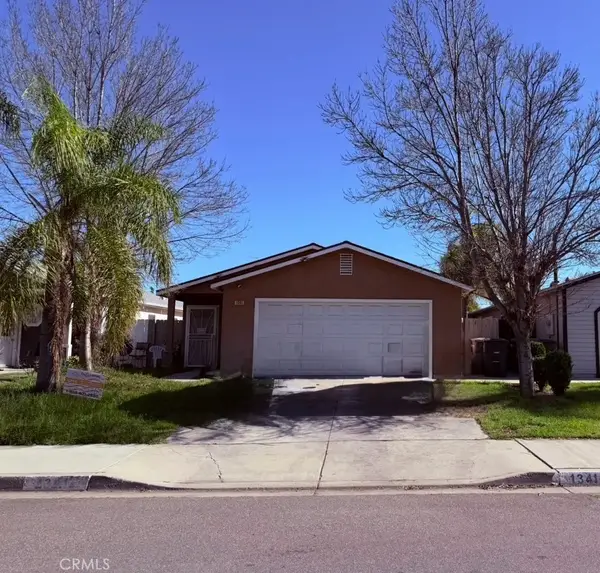 $499,000Active4 beds 2 baths1,230 sq. ft.
1341 Palisades Street, Perris, CA 92570
MLS# IV26023372Listed by: EXP REALTY OF CALIFORNIA INC $1,199,900Active4 beds 4 baths2,421 sq. ft.
21260 Ridgedale, Lake Mathews, CA 92570
MLS# IV26022813Listed by: KELLER WILLIAMS RIVERSIDE CENT $694,999Active5 beds 3 baths2,120 sq. ft.
20398 Bailly, Perris, CA 92570
MLS# SW26021949Listed by: CENTURY 21 AFFILIATED $480,000Active3 beds 2 baths2,136 sq. ft.
22608 Birds Eye, Perris, CA 92570
MLS# IG26022592Listed by: KW THE LAKES $800,000Active0 Acres
37000 Robert, Perris, CA 92570
MLS# OC26013732Listed by: WILLIAM JOHNSON, BROKER $299,000Active0 Acres
1 Blue Sky Road, Perris, CA 92570
MLS# IV26021631Listed by: COLDWELL BANKER COMMERCIAL SC $299,000Active0 Acres
2 Blue Sky Road, Perris, CA 92570
MLS# IV26021641Listed by: COLDWELL BANKER COMMERCIAL SC $1,995,000Active0 Acres
21500 Orange, Perris, CA 92570
MLS# OC26017005Listed by: MARQUIS SIGNATURE PROPERTIES $655,000Active4 beds 2 baths1,362 sq. ft.
23475 Stafford Street, Perris, CA 92570
MLS# FR26017782Listed by: DOMBROSKI REALTY $249,999Active3.68 Acres
21698 Eugene Street, Perris, CA 92570
MLS# 26643717Listed by: TEAM EQUITY L.A. PROPERTY $649,000Active4.13 Acres
595 W 11th Street, Perris, CA 92570
MLS# 26643577Listed by: GT INVESTMENTS $1,000,000Pending4 beds 4 baths2,755 sq. ft.
23140 Western Crest Drive, Lake Mathews, CA 92570
MLS# IG26018469Listed by: RANCHES AND HOMES REAL ESTATE $449,000Active8 beds 3 baths2,286 sq. ft.
23390 Forrest, Perris, CA 92570
MLS# SW26018488Listed by: COLDWELL BANKER RES BROKERAGE $690,000Pending3 beds 2 baths1,597 sq. ft.
20521 Hunter, Perris, CA 92570
MLS# IG26017568Listed by: BEST REALTY PARTNERS $390,000Active2 beds 1 baths870 sq. ft.
311 Red Pine Place, Perris, CA 92570
MLS# CV26017016Listed by: PHF REAL ESTATE SERVICES $240,000Active0 Acres
20893 Mandeville, Perris, CA 92570
MLS# IG26010390Listed by: ELEVATE REAL ESTATE AGENCY $10,800,000Active0 Acres
0 Hwy 74, Perris, CA 92570
MLS# PW26016730Listed by: REAL ESTATE LEGENDS USA $1,500,000Pending7 beds 5 baths2,275 sq. ft.
19030 Santa Rosa Mine Road, Perris, CA 92570
MLS# V1-34253Listed by: DOUGLAS ELLIMAN OF CALIFORNIA $985,000Active6 beds 4 baths3,643 sq. ft.
15281 Ranchito Drive, Perris, CA 92570
MLS# PTP2600550Listed by: REAL BROKER $2,722,500Active0 Acres
22647 Cajalco Road, Perris, CA 92570
MLS# WS26013009Listed by: HOWARD REALTY PARTNERS, INC $760,000Active4 beds 3 baths2,116 sq. ft.
20553 Hunter, Perris, CA 92570
MLS# IV26010527Listed by: CASTANEDA REAL ESTATE $575,000Pending5 beds 3 baths2,383 sq. ft.
3470 Yellowstone Court, Perris, CA 92570
MLS# SW25280575Listed by: SIMPLIHOM $591,720Pending3 beds 2 baths2,287 sq. ft.
2374 Lionheart Drive, Perris, CA 92570
MLS# SW26010459Listed by: CENTURY 21 MASTERS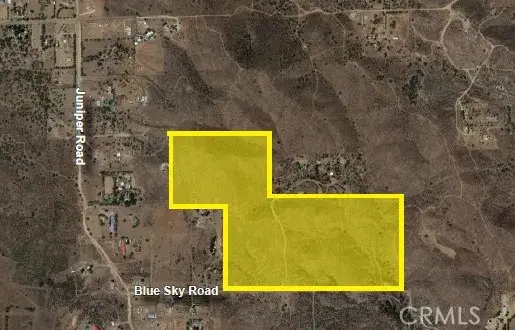 $750,000Active0 Acres
0 Blue Sky Road, Perris, CA 92570
MLS# IV26009386Listed by: COLDWELL BANKER COMMERCIAL SC $350,000Active0 Acres
21321 Cajalco, Perris, CA 92570
MLS# IG26008293Listed by: ELEVATE REAL ESTATE AGENCY $585,000Active5 beds 2 baths1,763 sq. ft.
3470 Bryce Canyon Way, Perris, CA 92570
MLS# SW26004363Listed by: CENTURY 21 MASTERS $450,000Active2 beds 1 baths720 sq. ft.
21274 Cajalco, Perris, CA 92570
MLS# IV26003941Listed by: CASTANEDA REAL ESTATE $299,000Active0 Acres
0 Mustang Court, Lake Mathews, CA 92570
MLS# AR26002055Listed by: PINNACLE REAL ESTATE GROUP $249,000Active0 Acres
0 River, Perris, CA 92570
MLS# IV26003543Listed by: HEAVENLY PILIOGLAS, BROKER $399,000Active0 Acres
0 Aloha Rd., Perris, CA 92570
MLS# 2600318Listed by: COMPASS $800,000Active0 Acres
27080 State Highway 74, Perris, CA 92570
MLS# IV26002288Listed by: COLDWELL BANKER COMMERCIAL SC $459,900Active2 beds 1 baths856 sq. ft.
160 E 3rd, Perris, CA 92570
MLS# PW26001232Listed by: OPEN DOORWAYS REALTY INC $650,000Active0 Acres
509 N D Street, Perris, CA 92570
MLS# IV26002270Listed by: COLDWELL BANKER COMMERCIAL SC $1,400,000Active0 Acres
24755 State Highway 74, Perris, CA 92570
MLS# IG26001539Listed by: FIRST TEAM REAL ESTATE $849,000Active4 beds 3 baths2,136 sq. ft.
18623 Lawton Boulevard, Perris, CA 92570
MLS# PW25280548Listed by: TAURUS REALTY GROUP $695,000Pending3 beds 2 baths2,114 sq. ft.
19808 Gustin, Perris, CA 92570
MLS# IV25280467Listed by: ONEAMERICA REAL ESTATE AND MORTGAGE $99,000Active0 Acres
34605001 No Name, Lake Elsinore, CA 92570
MLS# IV25278265Listed by: TRUST PROPERTIES USA, INC $6,800,000Active0 Acres
17409 El Mineral, Lake Mathews, CA 92570
MLS# IN25276553Listed by: GUY HOCKER REALTORS $190,000Active0 Acres
29620 Broadview, Lake Mathews, CA 92570
MLS# RS25271102Listed by: CAL-ESTATE REALTY $399,000Active3 beds 2 baths1,440 sq. ft.
24121 Bienvenidos, Perris, CA 92570
MLS# SW25273923Listed by: AVM REAL ESTATE SERVICES- Open Wed, 12 to 4pm
 $750,000Active3 beds 2 baths1,584 sq. ft.
1020 Clayton, Perris, CA 92570
MLS# IG25272250Listed by: PONCE & PONCE REALTY, INC  $484,900Pending3 beds 2 baths1,371 sq. ft.
782 Penasco Grande, Perris, CA 92570
MLS# SB25272060Listed by: CENTURY 21 COASTAL PROPERTIES $470,000Pending4 beds 2 baths1,512 sq. ft.
22260 Deprad, Perris, CA 92570
MLS# SR25271998Listed by: BLVD ESTATE PROPERTIES $229,000Active1.39 Acres
0 Kimes Lane, Perris, CA 92570
MLS# CV25272259Listed by: CENTURY 21 PRIMETIME REALTORS $229,000Active1.26 Acres
21080 Kimes, Perris, CA 92570
MLS# CV25270858Listed by: CENTURY 21 PRIMETIME REALTORS $3,400Pending4 beds 2 baths2,670 sq. ft.
21204 Versaie, Perris, CA 92570
MLS# CRSW25269614Listed by: GOLD SHIELD REALTY GROUP $480,000Pending3 beds 3 baths1,431 sq. ft.
20434 Myron Street, Perris, CA 92570
MLS# 250045231SDListed by: ADC REALTY & INVESTMENTS GROUP $1,550,000Active2 beds 1 baths932 sq. ft.
21131 Ellis, Perris, CA 92570
MLS# SW25270897Listed by: COLDWELL BANKER ASSOC BRKR-SC $949,888Active0 Acres
22285 Old Elsinore, Perris, CA 92570
MLS# MB25270746Listed by: ROCKCAL REAL ESTATE $949,888Active9.72 Acres
22285 Old Elsinore Road, Perris, CA 92570
MLS# MB25270746Listed by: ROCKCAL REAL ESTATE $998,240Active0 Acres
0 No Address, Unincorporated, CA 92570
MLS# PW25270361Listed by: RUBEN GUTIERREZ, BROKER $958,800Active0 Acres
0 No Address, Unincorporated, CA 92570
MLS# PW25270364Listed by: RUBEN GUTIERREZ, BROKER $1,171,640Active0 Acres
0 No Address, Unincorporated, CA 92570
MLS# PW25270368Listed by: RUBEN GUTIERREZ, BROKER $3,712,000Active0 Acres
0 No Address, Unincorporated, CA 92570
MLS# PW25270332Listed by: RUBEN GUTIERREZ, BROKER $629,999Pending5 beds 3 baths2,737 sq. ft.
131 Quartz Ln, Perris, CA 92570
MLS# SW25268125Listed by: YOUR HOME IMAGINED, INC. $985,000Pending4 beds 2 baths2,640 sq. ft.
21720 Yucca, Perris, CA 92570
MLS# IV25253098Listed by: REALTY MASTERS & ASSOCIATES $587,039Pending4 beds 2 baths2,194 sq. ft.
366 Sea Bright Road, Perris, CA 92570
MLS# SW25267156Listed by: CENTURY 21 MASTERS $429,000Active0 Acres
0 Stoneridge, Lake Mathews, CA 92570
MLS# IV25266484Listed by: KJ REALTY GROUP INC. $395,000Active0 Acres
0 Magugling, Perris, CA 92570
MLS# IV25259859Listed by: ANCHOR FUNDING, INC $550,000Active8 beds 3 baths1,680 sq. ft.
20785 Burns Street, Perris, CA 92570
MLS# OC25264286Listed by: REAL BROKER $375,000Pending2 beds 2 baths720 sq. ft.
21701 Perry Street, Perris, CA 92570
MLS# PW25263770Listed by: KHORR REALTY $1,881,688Active4 beds 2 baths1,913 sq. ft.
20646 Markham, Perris, CA 92570
MLS# TR25255469Listed by: GOD BLESSING INC. $1,881,688Active4 beds 2 baths1,913 sq. ft.
20646 Markham, Perris, CA 92570
MLS# TR25255469Listed by: GOD BLESSING INC. $1,075,000Active4 beds 4 baths4,149 sq. ft.
18689 Hawkhill, Perris, CA 92570
MLS# CV25254723Listed by: PROSPERA REALTORS $595,000Active3 beds 3 baths2,184 sq. ft.
3516 Mill Creek, Perris, CA 92570
MLS# IV25252949Listed by: ALTICORE REALTY $399,900Active0 Acres
24603 Highway 74, Perris, CA 92570
MLS# SW25250496Listed by: SWIFT REALTY $299,900Pending2.82 Acres
0 Old Elsinore Rd, Perris, CA 92570
MLS# DW25247795Listed by: EXCELLENCE EMPIRE REAL ESTATE $249,500Pending1.04 Acres
0 Olympia Ave, Perris, CA 92570
MLS# CRSW25244457Listed by: LAKE PERRIS REALTY $225,000Active3.6 Acres
28706002 Multiview, Perris, CA 92579
MLS# SR25238725Listed by: SYNC BROKERAGE, INC. $325,000Active0.97 Acres
0 State Highway 74, Perris, CA 92570
MLS# SW25233426Listed by: COLDWELL BANKER ASSOC BRKR-SC $2,100,000Active0 Acres
0 Cajalco, Perris, CA 92570
MLS# IG25230135Listed by: RE/MAX TIME REALTY $4,142,120Active2.57 Acres
24 Malbert, Perris, CA 92570
MLS# PW25228191Listed by: EXP REALTY OF CALIFORNIA INC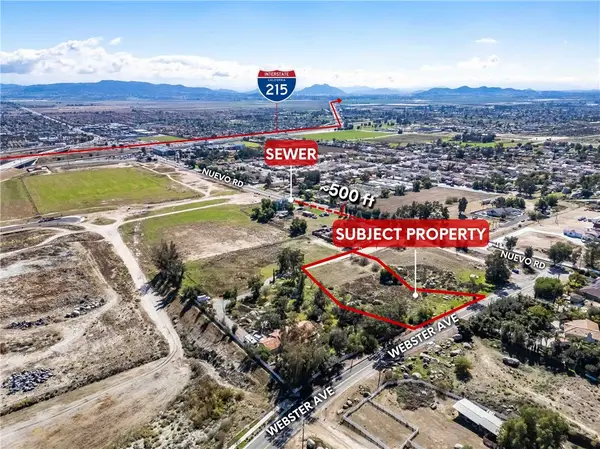 $300,000Pending1.63 Acres
24002 Nuevo Road, Perris, CA 92570
MLS# CV25225742Listed by: EXP REALTY OF GREATER LOS ANGELES $300,000Pending1.45 Acres
24001 Nuevo Road, Perris, CA 92570
MLS# CV25225746Listed by: EXP REALTY OF GREATER LOS ANGELES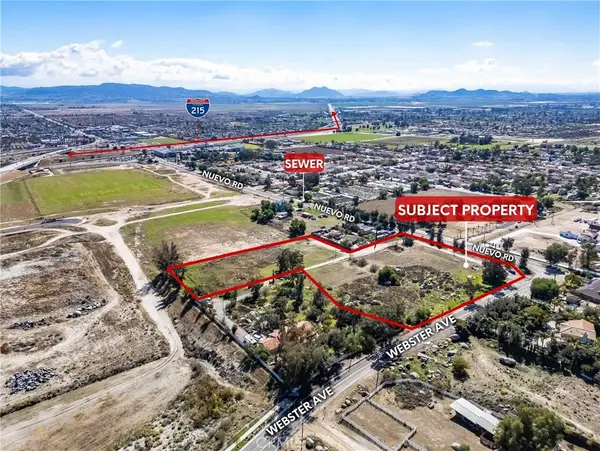 $980,000Pending5.3 Acres
24000 Nuevo Road, Perris, CA 92570
MLS# CV25225766Listed by: EXP REALTY OF GREATER LOS ANGELES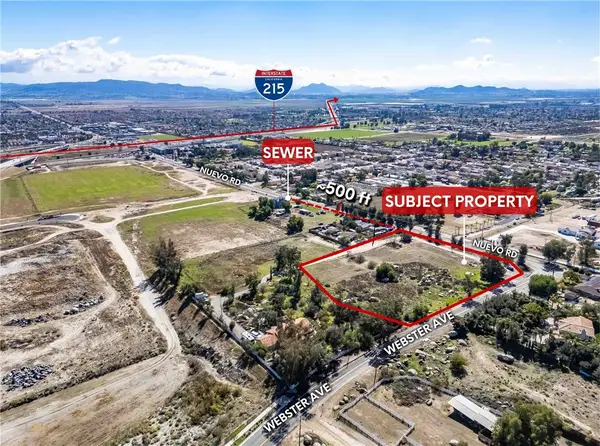 $600,000Pending3.08 Acres
24001 Nuevo Road, Perris, CA 92570
MLS# CV25225771Listed by: EXP REALTY OF GREATER LOS ANGELES $600,000Pending2.22 Acres
24003 Nuevo Road, Perris, CA 92570
MLS# CV25228685Listed by: EXP REALTY OF GREATER LOS ANGELES $330,000Active0 Acres
20653 Mustang, Lake Mathews, CA 92570
MLS# IV25227935Listed by: WESTCOE REALTORS INC $150,000Active0 Acres
1 Heizer, Perris, CA 92570
MLS# IV25222139Listed by: LAND22 REAL ESTATE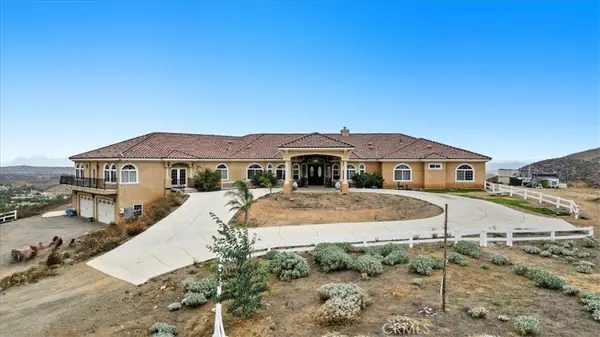 $1,340,000Pending6 beds 6 baths5,012 sq. ft.
20365 Toney Street, Perris, CA 92570
MLS# IV25220291Listed by: CASTANEDA REAL ESTATE $1,000,000Pending4 beds 2 baths2,180 sq. ft.
19310 Ann Way, Lake Mathews, CA 92570
MLS# SW25217792Listed by: NATIONAL REALTY GROUP $225,000Active0 Acres
0 Malta, Perris, CA 92570
MLS# IV25196987Listed by: REAL ESTATE ADVISORS $449,000Active2 beds 2 baths1,440 sq. ft.
642 Roadrunner #1, Perris, CA 92570
MLS# SW25196492Listed by: RISE REALTY $825,000Active4 beds 2 baths1,195 sq. ft.
23970 Hwy 74, Perris, CA 92580
MLS# 225112470Listed by: JASON J. COLLINS REAL ESTATE $340,000Active3 beds 2 baths1,152 sq. ft.
17086 Esperanza Drive, Perris, CA 92570
MLS# IV25185309Listed by: KELLER WILLIAMS RIVERSIDE CENT $589,999Active2 beds 2 baths2,062 sq. ft.
20320 Roads End Drive, Perris, CA 92570
MLS# IV25185261Listed by: CASTANEDA REAL ESTATE- $15,246Active0 Acres
21750 Ethanac, Perris, CA 92570
MLS# IV25179394Listed by: MILATO REALTY GROUP INC.  $499,999Pending3 beds 2 baths1,508 sq. ft.
21889 Mary Street, Perris, CA 92570
MLS# SW25179074Listed by: EXPRESS REALTY & INVESTMENTS $695,000Active0 Acres
0 Highway 74, Perris, CA 92570
MLS# IG25175334Listed by: RE/MAX TIME REALTY $660,000Active0 Acres
1234 Jimmy Taylor Rd, Perris, CA 92570
MLS# SW25174162Listed by: YOUR HOME IMAGINED, INC. $519,000Active0 Acres
0 Niro Road, Perris, CA 92570
MLS# PW25173305Listed by: ARAMIS REALTY GROUP INC. $1,300,000Active5 beds 4 baths3,001 sq. ft.
20243 Lee Road, Perris, CA 92570
MLS# IV25171710Listed by: ALTICORE REALTY $694,900Pending3 beds 2 baths1,580 sq. ft.
18583 Seaton Avenue, Perris, CA 92570
MLS# IV25171894Listed by: VISTA SOTHEBY'S INTERNATIONAL REALTY $399,990Active2 beds 1 baths1,040 sq. ft.
25773 Highway 74, Perris, CA 92570
MLS# OC25170665Listed by: ADVANCE ESTATE REALTY $2,395,000Active0 Acres
0 Archer, Perris, CA 92370
MLS# OC25129356Listed by: CHEN, WE-YU $1,249,000Active0 Acres
24900 El Toro, Lake Elsinore, CA 92532
MLS# CV25166857Listed by: REAL BROKERAGE TECHNOLOGIES $240,000Pending3 beds 2 baths1,120 sq. ft.
540 Shawnee Road, Perris, CA 92570
MLS# IV20006115Listed by: COLDWELL BANKER ASSOC BRKR/CL $628,000Active14.69 Acres
0 Riverside Street, Perris, CA 92570
MLS# TR25165224Listed by: CENTURY 21 MASTERS $1,125,000Active5 beds 3 baths3,194 sq. ft.
20329 Luchs, Perris, CA 92570
MLS# IG26019968Listed by: KELLER WILLIAMS REALTY $715,000Pending4 beds 2 baths2,548 sq. ft.
23930 Marshall Street, Perris, CA 92570
MLS# CV25162511Listed by: EXP REALTY OF CALIFORNIA INC $2,000,000Pending70 Acres
0 Herbert, Perris, CA 92570
MLS# SW25157075Listed by: SWIFT REALTY $140,000Pending0.4 Acres
0 Mural Street, Perris, CA 92570
MLS# IG25262933Listed by: REALTY ONE GROUP EMPIRE $699,000Active0 Acres
0 Diana, Perris, CA 92570
MLS# CV25142363Listed by: HOMEQUEST REAL ESTATE $999,990Active0 Acres
0 Greenwald, Perris, CA 92570
MLS# SW25143777Listed by: LEGACY REALTY INC. $539,000Active0 Acres
20825 Lakemount, Perris, CA 92570
MLS# IG25138655Listed by: REALTY ONE GROUP WEST $444,000Active0 Acres
20755 Bentley, Perris, CA 92570
MLS# HD25119259Listed by: HAMILTON LANDON REAL ESTATE $1,050,000Pending5 beds 6 baths2,770 sq. ft.
2162 Sunpark Drive, Perris, CA 92570
MLS# SW25135307Listed by: MARIN REALTY GROUP $170,000Active0 Acres
0 Cajalco Rd., Perris, CA 92570
MLS# PW25128871Listed by: RE/MAX NEW DIMENSION $629,000Pending4 beds 3 baths2,894 sq. ft.
380 Monument Parkway, Perris, CA 92570
MLS# CRCV25119228Listed by: SERVE FIRST REALTY $279,000Active2 beds 1 baths672 sq. ft.
17126 Hidalgo Drive, Perris, CA 92570
MLS# IV25116642Listed by: ALTICORE REALTY $70,000Active1 beds 1 baths500 sq. ft.
26734 Peach #112, Perris, CA 92570
MLS# CV26030559Listed by: FREEDOM REALTY GROUP $679,000Active3 beds 2 baths1,851 sq. ft.
23850 Estelle Mountain Road, Perris, CA 92570
MLS# IV25095582Listed by: ADRIANA'S REALTY GROUP $600,000Active3 beds 3 baths2,020 sq. ft.
27890 Greenwald Avenue, Perris, CA 92570
MLS# OC25093568Listed by: FIDUCIARY REAL ESTATE SERVICES $70,000Active0 Acres
0 Milo, Perris, CA 92570
MLS# OC25094432Listed by: FIDUCIARY REAL ESTATE SERVICES $1,100,000Active0 Acres
0 Vista Del Lago, Perris, CA 92570
MLS# OC25089034Listed by: REAL BROKER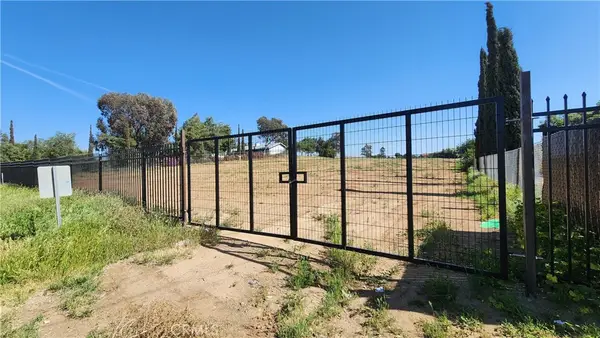 $325,000Pending1.48 Acres
0 W Rider Street, Perris, CA 92570
MLS# IV26058721Listed by: ALTICORE REALTY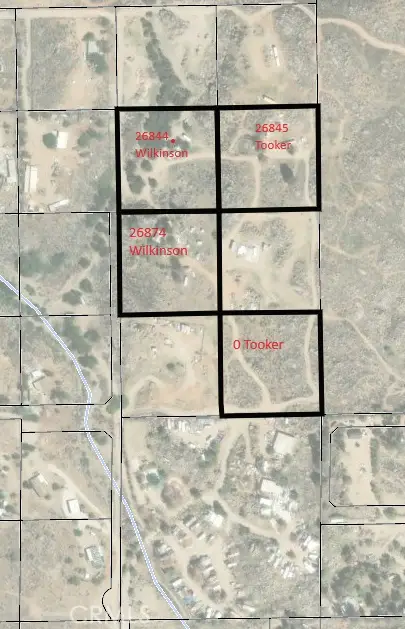 $200,000Active2.5 Acres
26874 Wilkinson Street, Perris, CA 92570
MLS# IV25077389Listed by: DEVLIN REALTY $225,000Active0 Acres
0 Mandeville Dr, Lake Mathews, CA 92570
MLS# IG25052411Listed by: RE/MAX PARTNERS $2,680,000Active10 beds 8 baths10,238 sq. ft.
20455 Somma Drive, Perris, CA 92570
MLS# TR25262874Listed by: PINNACLE REAL ESTATE GROUP $4,000,000Active0 Acres
0 No Address, Perris, CA 92570
MLS# OC25048615Listed by: REAL BROKER $1,497,000Active0 Acres
0 No Address, Perris, CA 92570
MLS# OC25266278Listed by: REAL BROKER $529,900Active7.98 Acres
20920 Sawgo Drive, Perris, CA 92570
MLS# IG25047978Listed by: REALTY MASTERS & ASSOCIATES $640,000Active4 beds 3 baths2,352 sq. ft.
505 Fair Park Way, Perris, CA 92570
MLS# 25489635Listed by: HART IN THE HOUSE $4,900,000Active0 Acres
190 Mapes, Perris, CA 92570
MLS# SW25015193Listed by: HARTMAN TROY, BROKER $320,000Pending1.38 Acres
0 Barton St, Riverside, CA 92508
MLS# CRIV24237712Listed by: ONEAMERICA REAL ESTATE AND MORTGAGE $130,000Active0 Acres
0 Apn 349320011, Perris, CA 92570
MLS# SW24234160Listed by: THE WRIGHT AGENT 4 U $350,000Pending1.2 Acres
0 Day St, Perris, CA 92570
MLS# CV24223167Listed by: CENTURY 21 MASTERS $445,000Active0 Acres
0 Campos Rd, Perris, CA 92570
MLS# IV24176919Listed by: CASTANEDA REAL ESTATE $200,000Active0 Acres
0 Tooker, Perris, CA 92570
MLS# IV24177060Listed by: DEVLIN REALTY $200,000Active0 Acres
26845 Tooker, Perris, CA 92570
MLS# IV24177084Listed by: DEVLIN REALTY $200,000Active0 Acres
26844 Wilkinson, Perris, CA 92570
MLS# IV24177124Listed by: DEVLIN REALTY $899,000Active0 Acres
1020 Clayton Street, Perris, CA 92570
MLS# IV24175227Listed by: COLDWELL BANKER COMMERCIAL SC $499,000Active0.52 Acres
22738 Redwood Drive, Perris, CA 92570
MLS# IV24113233Listed by: VISTA SOTHEBY'S INTERNATIONAL REALTY $1,800,000Active0 Acres
0 Multiview, Lake Mathews, CA 92570
MLS# IV24143673Listed by: ALLISON JAMES EST. & HOMES $175,000Active0 Acres
0 Forrest, Perris, CA 92570
MLS# SB24134281Listed by: BANKERS REALTY EXCLUSIVE, INC. $645,000Active0 Acres
15255 Gavilan Springs, Perris, CA 92570
MLS# SR24047011Listed by: HOMESMART EVERGREEN REALTY $145,000Active0 Acres
9 G, Perris, CA 92570
MLS# IV25106855Listed by: BERKSHIRE HATHAWAY HOMESERVICES CALIFORNIA REALTY $3,999,999Pending37.98 Acres
23251 Placentia Avenue, Perris, CA 92570
MLS# IG24000453Listed by: WESTCOE REALTORS, INC. $450,000Active20.92 Acres
0 Arcaro, Perris, CA 92570
MLS# SW22012066Listed by: COLDWELL BANKER ASSOC BRKR-SC $700,000Pending1.25 Acres
0 Cajalco Rd, Perris, CA 92570
MLS# CRIV23205235Listed by: ACE-TAX & REALTY $610,000Active3 beds 1 baths1,120 sq. ft.
21732 Mountain Avenue, Perris, CA 92570
MLS# 23328843Listed by: COMPASS $299,999Active0 Acres
0 W Ellis, Perris, CA 92570
MLS# IG23198974Listed by: WESTCOE REALTORS, INC. $299,998Active25.33 Acres
0 Marie Road, Perris, CA 92570
MLS# SW23171609Listed by: CAMOU AND ASSOCIATES $299,998Active0 Acres
0 Marie, Perris, CA 92570
MLS# SW23171609Listed by: CAMOU AND ASSOCIATES $170,000Active0.75 Acres
0 Hwy 74, Perris, CA 92570
MLS# SW25233451Listed by: COLDWELL BANKER ASSOC BRKR-SC $399,000Active4 beds 3 baths2,015 sq. ft.
21444 Vista Caballero, Perris, CA 92570
MLS# CL23305633Listed by: MARCUS & MILLICHAP $85,000Pending3 beds 2 baths1,536 sq. ft.
0 Hwy 74, Perris, CA 92570
MLS# CRSW23161040Listed by: LAKE PERRIS REALTY $289,900Active3.88 Acres
1 Little Valley, Perris, CA 92570
MLS# SW23133725Listed by: COLDWELL BANKER ASSOC.BRKS-CL $325,000Active0.24 Acres
336 S B Street, Perris, CA 92570
MLS# CRSW22120679Listed by: COLDWELL BANKER ASSOC BRKR-SC $99,999Pending1 beds 1 baths480 sq. ft.
225 W 4th St, Perris, CA 92570
MLS# 160051886Listed by: COLDWELL BANKER RES BROKERAGE $4,995,900Active40.11 Acres
19203 Cajalco Road, Perris, CA 92570
MLS# IV25152612Listed by: VISTA SOTHEBY'S INTERNATIONAL REALTY $1,999,999Active0 Acres
0 Ellis Avenue, Perris, CA 92570
MLS# CV22207553Listed by: VILLAGE REALTORS
Local realty services provided by:CENTURY 21 Masters, CENTURY 21 Affiliated, CENTURY 21 Sierra Properties
The information being provided by California Regional MLS (Southern California) is for the consumer's personal, non-commercial use and may not be used for any purpose other than to identify prospective properties consumer may be interested in purchasing. Any information relating to real estate for sale referenced on this web site comes from the Internet Data Exchange (IDX) program of the California Regional MLS (Southern California). CENTURY 21 Masters is not a Multiple Listing Service (MLS), nor does it offer MLS access. This website is a service of CENTURY 21 Masters, a broker participant of California Regional MLS (Southern California). This web site may reference real estate listing(s) held by a brokerage firm other than the broker and/or agent who owns this web site.
The accuracy of all information, regardless of source, including but not limited to open house information, square footages and lot sizes, is deemed reliable but not guaranteed and should be personally verified through personal inspection by and/or with the appropriate professionals. The data contained herein is copyrighted by California Regional MLS (Southern California) and is protected by all applicable copyright laws. Any unauthorized dissemination of this information is in violation of copyright laws and is strictly prohibited.
Copyright 2021 California Regional MLS (Southern California). All rights reserved.
This information is deemed reliable but not guaranteed. You should rely on this information only to decide whether or not to further investigate a particular property. BEFORE MAKING ANY OTHER DECISION, YOU SHOULD PERSONALLY INVESTIGATE THE FACTS (e.g. square footage and lot size) with the assistance of an appropriate professional. You may use this information only to identify properties you may be interested in investigating further. All uses except for personal, non-commercial use in accordance with the foregoing purpose are prohibited. Redistribution or copying of this information, any photographs or video tours is strictly prohibited. This information is derived from the Internet Data Exchange (IDX) service provided by San Diego MLS®. Displayed property listings may be held by a brokerage firm other than the broker and/or agent responsible for this display. The information and any photographs and video tours and the compilation from which they are derived is protected by copyright. Compilation © 2020 San Diego MLS®, Inc.
MetroList MLS 2026. This information is being provided by MetroList MLS. All measurements and calculations of area are approximate. Information provided by Seller/Other sources, not verified by Broker. All interested persons should independently verify accuracy of information. Provided properties may or may not be listed by the office/agent presenting the information. Data Updated: May 3, 2026. Information being provided is for consumers' personal, non-commercial use and may not be used for any purpose other than to identify prospective properties consumers may be interested in purchasing. Information deemed reliable but not guaranteed. Any offer of compensation is made only to Participants of MLS where the subject listing is filed and in accordance with such MLS's regulations or rules.
Popular searches near 92570
Popular neighborhoods near 92570
- Alberhill, Lake Elsinore homes for sale
- Central Perris, Perris homes for sale
- Country Club Heights, Lake Elsinore homes for sale
- Downtown Perris, Perris homes for sale
- Good Hope, Perris homes for sale
- Lake Elsinore Business District, Lake Elsinore homes for sale
- Lake Elsinore Hills, Lake Elsinore homes for sale
- Lake Elsinore Historic District, Lake Elsinore homes for sale
- Lake Mathews, Perris homes for sale
- Mead Valley, Perris homes for sale
- Meadowbrook, Perris homes for sale
- North Perris, Perris homes for sale
- Orangecrest, Riverside homes for sale
- Perris Valley Commerce Center, Perris homes for sale
- South Perris, Perris homes for sale
- Southeast Perris, Menifee homes for sale
- Sun City, Menifee homes for sale
- Warm Springs, Lake Elsinore homes for sale
- West Perris, Perris homes for sale
- Woodcrest, Riverside homes for sale
Protect your home and budget from life's surprises with an Assurant Home Warranty, backed by a partner that supports you through every step of homeownership. Explore Plans.
©2026 Century 21 Real Estate LLC. All rights reserved. CENTURY 21®, the CENTURY 21 Logo and C21® are service marks owned by Century 21 Real Estate LLC. Century 21 Real Estate LLC fully supports the principles of the Fair Housing Act and the Equal Opportunity Act. Each office is independently owned and operated. Listing information is deemed reliable but not guaranteed accurate.