- Anaheim homes for sale
- Anaheim Hills homes for sale
- Anaheim-Santa Ana-Garden Grove homes for sale
- Costa Mesa homes for sale
- Foothill Ranch homes for sale
- Fountain Valley homes for sale
- Garden Grove homes for sale
- Irvine homes for sale
- Irvine-Lake Forest homes for sale
- Laguna Woods homes for sale
- Lake Forest homes for sale
- North Tustin homes for sale
- Orange homes for sale
- Placentia homes for sale
- Santa Ana homes for sale
- Silverado homes for sale
- Tustin homes for sale
- Villa Park homes for sale
- Williams Canyon homes for sale
- Yorba Linda homes for sale
92782, CA - homes for sale
81 of 81 results displayed
- Coming SoonOpen Sun, 11am to 3pm
 $1,399,000Coming Soon3 beds 4 baths
253 Waypoint, Tustin, CA 92782
MLS# OC26122994Listed by: HOM REALTY GROUP, INC. - New
 $1,295,000Active3 beds 3 baths1,598 sq. ft.
2051 Pueblo, Tustin, CA 92782
MLS# OC26122700Listed by: REALTY ONE GROUP WEST - New
 $1,650,000Active3 beds 3 baths2,287 sq. ft.
80 Ballast, Tustin, CA 92782
MLS# OC26122596Listed by: REAL BROKER - New
 $1,175,000Active3 beds 3 baths1,678 sq. ft.
13367 Calle Antequera, Tustin, CA 92782
MLS# OC26117544Listed by: COLDWELL BANKER REALTY - New
 $2,250,000Active5 beds 3 baths3,001 sq. ft.
2573 Newman, Tustin, CA 92782
MLS# OC26107953Listed by: COLDWELL BANKER REALTY - Coming Soon
 $2,000,000Coming Soon4 beds 3 baths
11555 Allen, Tustin, CA 92782
MLS# OC26118395Listed by: EXP REALTY OF CALIFORNIA, INC. - New
 $1,229,000Active2 beds 3 baths1,772 sq. ft.
2493 Tequestra, Tustin, CA 92782
MLS# PW26114438Listed by: FIRST TEAM REAL ESTATE - Coming Soon
 $839,000Coming Soon2 beds 2 baths
2756 Monza, Tustin, CA 92782
MLS# PW26117470Listed by: BHHS CA PROPERTIES - New
 $1,199,000Active3 beds 3 baths1,620 sq. ft.
13459 Savanna, Tustin, CA 92782
MLS# OC26116995Listed by: COLDWELL BANKER REALTY - New
 $1,159,000Active3 beds 3 baths1,848 sq. ft.
2856 Ballesteros Lane, Tustin, CA 92782
MLS# PW26117187Listed by: ONETOP REALTY - New
 $1,099,000Active3 beds 3 baths1,724 sq. ft.
12647 Trent Jones Lane, Tustin, CA 92782
MLS# OC26116482Listed by: REALTY ONE GROUP WEST - New
 $788,000Active1 beds 2 baths1,391 sq. ft.
15231 Calverton, Tustin, CA 92782
MLS# AR26108282Listed by: IRN REALTY - New
 $2,999,950Active5 beds 5 baths3,443 sq. ft.
16398 Veterans Way, Tustin, CA 92782
MLS# OC26116489Listed by: EHOMES  $595,000Active1 beds 1 baths736 sq. ft.
225 Gallery, Tustin, CA 92782
MLS# OC26105808Listed by: FIRST TEAM REAL ESTATE $499,000Active1 beds 1 baths550 sq. ft.
154 Gallery, Tustin, CA 92782
MLS# OC26112218Listed by: REALTY ONE GROUP WEST $1,100,000Active3 beds 3 baths1,350 sq. ft.
2329 Sunningdale, Tustin, CA 92782
MLS# OC26111089Listed by: O'DONNELL REAL ESTATE $969,000Active2 beds 3 baths1,388 sq. ft.
2894 Player Ln, Tustin, CA 92782
MLS# OC26111529Listed by: REAL BROKER $915,000Active2 beds 3 baths1,241 sq. ft.
2452 Paseo Circulo, Tustin, CA 92782
MLS# PW26067958Listed by: LISA TANG, BROKER $1,029,000Active3 beds 3 baths1,298 sq. ft.
12921 Ternberry Court, Tustin, CA 92782
MLS# PW26091431Listed by: COLDWELL BANKER BEST REALTY $899,999Active2 beds 3 baths1,035 sq. ft.
2444 Sunningdale, Tustin, CA 92782
MLS# PW26108693Listed by: FIRST TEAM REAL ESTATE $2,795,000Active5 beds 4 baths3,400 sq. ft.
403 Hudson Drive, Tustin, CA 92782
MLS# OC26108381Listed by: HARCOURTS PLACE $924,900Active3 beds 3 baths1,307 sq. ft.
251 Gallery, Tustin, CA 92782
MLS# PW26108899Listed by: EXP REALTY OF GREATER LOS ANGELES $1,679,900Active4 beds 3 baths2,416 sq. ft.
15530 Bonsai Way, Tustin, CA 92782
MLS# PW26109033Listed by: EXP REALTY OF CALIFORNIA INC $2,795,000Active5 beds 4 baths3,400 sq. ft.
403 Hudson Drive, Tustin, CA 92782
MLS# OC26108381Listed by: HARCOURTS PLACE $924,900Active3 beds 3 baths1,307 sq. ft.
251 Gallery, Tustin, CA 92782
MLS# PW26108899Listed by: EXP REALTY OF GREATER LOS ANGELES $868,000Active2 beds 2 baths1,047 sq. ft.
2960 Champion Way #2301, Tustin, CA 92782
MLS# OC26108728Listed by: COLDWELL BANKER REALTY $1,239,800Active3 beds 3 baths1,500 sq. ft.
312 Nimbus, Tustin, CA 92782
MLS# OC26107553Listed by: UNIVERSAL ELITE INC. $1,390,000Active3 beds 3 baths1,813 sq. ft.
1345 Sun Dial Drive, Tustin, CA 92782
MLS# OC26107305Listed by: REDFIN $560,000Active1 beds 1 baths738 sq. ft.
2800 Keller #239, Tustin, CA 92782
MLS# OC26104277Listed by: EXP REALTY OF CALIFORNIA, INC. $1,999,999Active4 beds 3 baths2,650 sq. ft.
2544 Wilson Drive, Tustin, CA 92782
MLS# OC26105381Listed by: REDFIN $1,250,000Pending3 beds 3 baths1,804 sq. ft.
15210 Linden Way, Tustin, CA 92782
MLS# OC26104898Listed by: KELLER WILLIAMS REALTY IRVINE $1,785,000Active4 beds 4 baths2,489 sq. ft.
16158 Veterans Way, Tustin, CA 92782
MLS# OC26105376Listed by: REALTY ONE GROUP WEST $2,749,000Pending5 beds 5 baths4,452 sq. ft.
1447 Charleston Street, Tustin, CA 92782
MLS# PW26101065Listed by: KATNIK BROTHERS R.E. SERVICES $1,200,000Active2 beds 3 baths1,675 sq. ft.
1413 Manchester Way, Tustin, CA 92782
MLS# OC26103619Listed by: COLDWELL BANKER REALTY $2,749,000Pending5 beds 5 baths4,452 sq. ft.
1447 Charleston Street, Tustin, CA 92782
MLS# PW26101065Listed by: KATNIK BROTHERS R.E. SERVICES $895,000Pending3 beds 3 baths1,590 sq. ft.
2481 Paseo Circulo, Tustin, CA 92782
MLS# DW26085996Listed by: REMAX TIFFANY REAL ESTATE $1,399,000Pending3 beds 3 baths1,476 sq. ft.
2891 Carner Drive, Tustin, CA 92782
MLS# OC26098741Listed by: COLDWELL BANKER REALTY $3,549,000Active5 beds 6 baths4,038 sq. ft.
2508 Platt Place, Tustin, CA 92782
MLS# PW26101962Listed by: KATNIK BROTHERS R.E. SERVICES $2,275,000Active4 beds 4 baths3,195 sq. ft.
2225 Bowman Avenue, Tustin, CA 92782
MLS# PW26097450Listed by: BERKSHIRE HATHAWAY HOMESERVICES CALIFORNIA PROPERTIES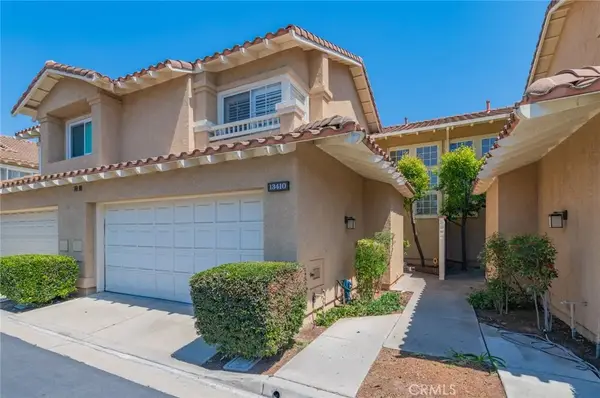 $1,195,000Active3 beds 3 baths1,586 sq. ft.
13410 Via Alicante, Tustin, CA 92782
MLS# OC26099259Listed by: AMERIHOME REALTY $1,250,000Active3 beds 3 baths1,677 sq. ft.
2462 Via Corella, Tustin, CA 92782
MLS# ND26095497Listed by: KELLER WILLIAMS REALTY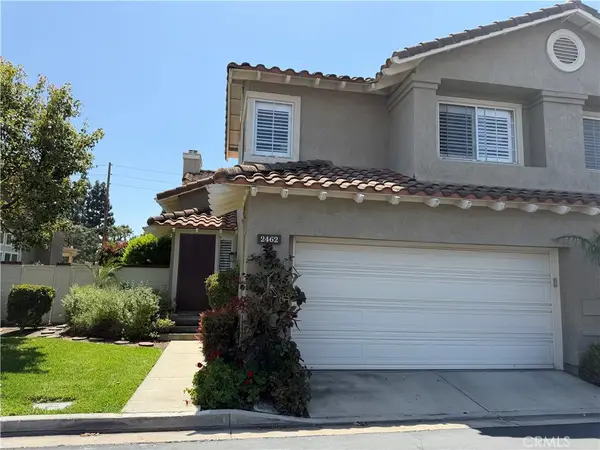 $1,250,000Active3 beds 3 baths1,677 sq. ft.
2462 Via Corella, Tustin, CA 92782
MLS# ND26095497Listed by: KELLER WILLIAMS REALTY $824,888Active2 beds 2 baths1,053 sq. ft.
10951 Alderman Avenue, Tustin, CA 92782
MLS# OC26100508Listed by: COLDWELL BANKER REALTY $1,150,000Active3 beds 3 baths1,610 sq. ft.
13595 Banyon, Tustin, CA 92782
MLS# OC26100558Listed by: REGENCY REAL ESTATE BROKERS $888,000Active2 beds 3 baths1,324 sq. ft.
2645 Dunstan, Tustin, CA 92782
MLS# OC26100497Listed by: KELLER WILLIAMS REALTY IRVINE $1,125,000Active2 beds 2 baths1,501 sq. ft.
16175 Dawn #202, Tustin, CA 92782
MLS# OC26099817Listed by: KELLER WILLIAMS REALTY $939,000Pending3 beds 3 baths1,298 sq. ft.
12817 Ternberry Court, Tustin, CA 92782
MLS# PW26098640Listed by: MJC REALTY $1,400,000Active4 beds 2 baths2,014 sq. ft.
16175 Dawn #207, Tustin, CA 92782
MLS# OC26098820Listed by: BARRENA REAL ESTATE GROUP $475,913Pending3 beds 3 baths1,404 sq. ft.
350 Flyers, Tustin, CA 92782
MLS# OC26097091Listed by: COLDWELL BANKER REALTY $1,149,000Active3 beds 3 baths1,676 sq. ft.
15247 Cambridge Street, Tustin, CA 92782
MLS# PW26090008Listed by: EXP REALTY OF CALIFORNIA INC $1,178,000Active2 beds 2 baths1,501 sq. ft.
16289 Dawn Way #209, Tustin, CA 92782
MLS# PW26094374Listed by: FRONTIER REALTY INC $9,500,000Active5 beds 6 baths6,202 sq. ft.
11765 Riehl, Tustin, CA 92782
MLS# OC26043698Listed by: META REALTY INC. $9,500,000Active5 beds 6 baths6,202 sq. ft.
11765 Riehl, Tustin, CA 92782
MLS# OC26043698Listed by: META REALTY INC. $2,290,000Active4 beds 3 baths3,462 sq. ft.
13252 Tiburon Way, Tustin, CA 92782
MLS# OC26088742Listed by: REAL BROKER $1,649,000Pending4 beds 3 baths2,650 sq. ft.
2531 Aquasanta, Tustin, CA 92782
MLS# OC26078364Listed by: COLDWELL BANKER REALTY $825,000Active2 beds 2 baths962 sq. ft.
2659 Dietrich, Tustin, CA 92782
MLS# OC26084776Listed by: EXP REALTY OF CALIFORNIA, INC.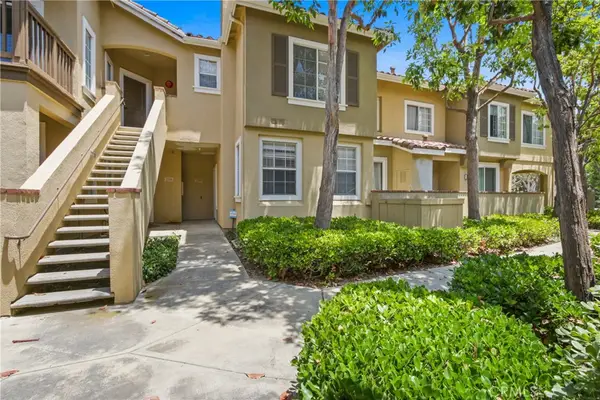 $845,500Active2 beds 3 baths1,154 sq. ft.
259 Gallery Way, Tustin, CA 92782
MLS# PW26084030Listed by: FERRAGAMO REAL ESTATE $1,299,000Active3 beds 4 baths1,985 sq. ft.
16330 Moonstone Cir, Tustin, CA 92782
MLS# TR26083577Listed by: STAR MAX REALTY $1,990,000Active5 beds 4 baths3,069 sq. ft.
13091 Ranchwood Road, Tustin, CA 92782
MLS# AR26079435Listed by: IRN REALTY $1,299,000Pending3 beds 4 baths1,985 sq. ft.
16328 Helber Way, Tustin, CA 92782
MLS# OC26080394Listed by: DOUGLAS ELLIMAN OF CALIFORNIA $849,800Active2 beds 2 baths1,325 sq. ft.
2744 Monza, Tustin, CA 92782
MLS# OC26068434Listed by: COLDWELL BANKER REALTY $2,400,000Active5 beds 3 baths2,837 sq. ft.
16632 Camilia, Tustin, CA 92782
MLS# OC26074197Listed by: KASE REAL ESTATE $1,180,000Active3 beds 3 baths1,718 sq. ft.
2316 Cascade, Tustin, CA 92782
MLS# PW26074779Listed by: HOMESMART, EVERGREEN REALTY $2,400,000Active5 beds 3 baths2,837 sq. ft.
16632 Camilia, Tustin, CA 92782
MLS# OC26074197Listed by: KASE REAL ESTATE $2,199,000Active4 beds 3 baths2,900 sq. ft.
11625 Allen, Tustin, CA 92782
MLS# OC26072326Listed by: EXP REALTY OF CALIFORNIA INC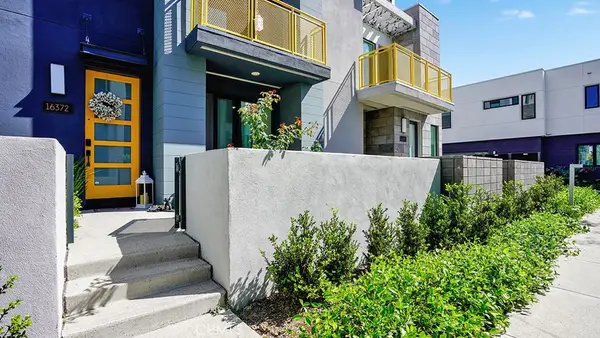 $1,280,000Active3 beds 4 baths1,985 sq. ft.
16372 Moonstone Circle, Tustin, CA 92782
MLS# OC26065105Listed by: SURTERRE PROPERTIES INC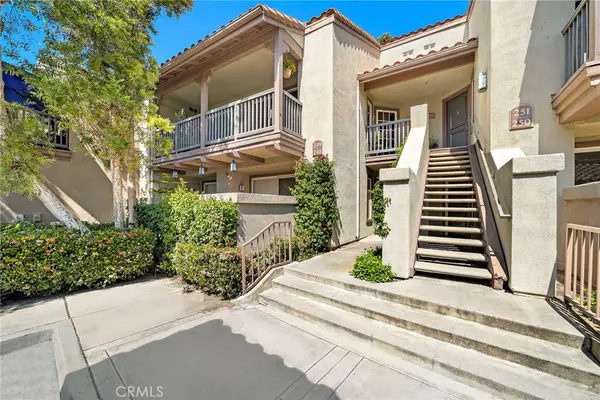 $559,900Active1 beds 1 baths738 sq. ft.
2800 Keller Drive #249, Tustin, CA 92782
MLS# OC26062719Listed by: FIRST TEAM REAL ESTATE $1,095,000Active3 beds 3 baths1,724 sq. ft.
12721 Trent Jones, Tustin, CA 92782
MLS# OC26030850Listed by: PREMIER AGENT NETWORK $1,189,000Active3 beds 4 baths1,958 sq. ft.
155 Zephyr Run, Tustin, CA 92782
MLS# DW26042504Listed by: 24 HOUR REAL ESTATE $2,680,000Active5 beds 5 baths4,203 sq. ft.
220 Barnes Road, Tustin, CA 92782
MLS# TR26050347Listed by: REMAX 2000 REALTY $1,175,000Pending2 beds 2 baths1,501 sq. ft.
16175 Dawn Way #302, Tustin, CA 92782
MLS# NP26047080Listed by: A1 REALTY, INC.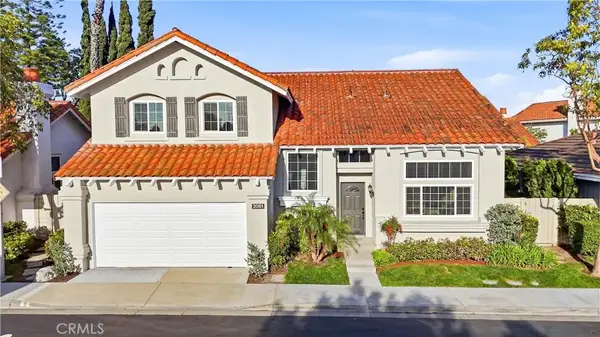 $1,555,000Pending4 beds 3 baths2,177 sq. ft.
2061 Pueblo, Tustin, CA 92782
MLS# OC26042221Listed by: REALTY ONE GROUP WEST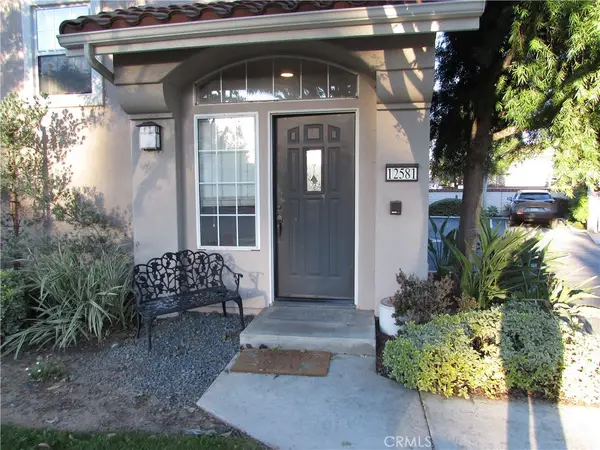 $900,000Pending3 beds 2 baths1,467 sq. ft.
12581 Doral, Tustin, CA 92782
MLS# OC26025994Listed by: RE/MAX COLLEGE PARK REALTY $1,150,000Active3 beds 3 baths1,676 sq. ft.
15220 Cambridge, Tustin, CA 92782
MLS# PW26061397Listed by: TEAM SPIRIT REALTY, INC. $1,700,000Pending4 beds 4 baths2,136 sq. ft.
11729 Sleeper, Tustin, CA 92782
MLS# CRPW26009505Listed by: EXPRESS REAL ESTATE GROUP $1,999,000Active4 beds 3 baths3,111 sq. ft.
2605 Augusta, Tustin, CA 92782
MLS# OC25266070Listed by: LANDMARK REALTORS $4,999,999Pending4 beds 4 baths5,503 sq. ft.
10885 Silverado Ter, Tustin, CA 92782
MLS# NP25257986Listed by: SURTERRE PROPERTIES INC. $3,549,000Active5 beds 6 baths4,038 sq. ft.
2508 Platt Place, Tustin, CA 92782
MLS# PW26101962Listed by: KATNIK BROTHERS R.E. SERVICES $62,500Active0 Acres
0 Palmetto, Adelanto, CA 92301
MLS# SR25029265Listed by: KELLER WILLIAMS REALTY WORLD CLASS $5,500,000Active5 beds 6 baths5,902 sq. ft.
11755 Collar Avenue, Tustin, CA 92782
MLS# OC24179634Listed by: FIRST TEAM REAL ESTATE $750,000Pending2 beds 2 baths882 sq. ft.
2800 Keller Drive #165, Tustin, CA 92782
MLS# 24398037Listed by: OPENDOOR BROKERAGE INC.
Local realty services provided by:CENTURY 21 Century Real Estate, CENTURY 21 Masters, CENTURY 21 Wildwood Properties, Inc.
The information being provided by California Regional MLS (Southern California) is for the consumer's personal, non-commercial use and may not be used for any purpose other than to identify prospective properties consumer may be interested in purchasing. Any information relating to real estate for sale referenced on this web site comes from the Internet Data Exchange (IDX) program of the California Regional MLS (Southern California). CENTURY 21 Century Real Estate is not a Multiple Listing Service (MLS), nor does it offer MLS access. This website is a service of CENTURY 21 Century Real Estate, a broker participant of California Regional MLS (Southern California). This web site may reference real estate listing(s) held by a brokerage firm other than the broker and/or agent who owns this web site.
The accuracy of all information, regardless of source, including but not limited to open house information, square footages and lot sizes, is deemed reliable but not guaranteed and should be personally verified through personal inspection by and/or with the appropriate professionals. The data contained herein is copyrighted by California Regional MLS (Southern California) and is protected by all applicable copyright laws. Any unauthorized dissemination of this information is in violation of copyright laws and is strictly prohibited.
Copyright 2021 California Regional MLS (Southern California). All rights reserved.
This information is deemed reliable but not guaranteed. You should rely on this information only to decide whether or not to further investigate a particular property. BEFORE MAKING ANY OTHER DECISION, YOU SHOULD PERSONALLY INVESTIGATE THE FACTS (e.g. square footage and lot size) with the assistance of an appropriate professional. You may use this information only to identify properties you may be interested in investigating further. All uses except for personal, non-commercial use in accordance with the foregoing purpose are prohibited. Redistribution or copying of this information, any photographs or video tours is strictly prohibited. This information is derived from the Internet Data Exchange (IDX) service provided by San Diego MLS®. Displayed property listings may be held by a brokerage firm other than the broker and/or agent responsible for this display. The information and any photographs and video tours and the compilation from which they are derived is protected by copyright. Compilation © 2020 San Diego MLS®, Inc. SANDICOR Member Broker: Randy Thompson
Popular searches near 92782
Popular neighborhoods near 92782
- Colony Club, Irvine homes for sale
- Columbus Square, Tustin homes for sale
- East Tustin, Santa Ana homes for sale
- Eastwood Village, Irvine homes for sale
- El Modena, Orange homes for sale
- Harvard Square, Irvine homes for sale
- Lower Peters Canyon, Irvine homes for sale
- North Tustin, Santa Ana homes for sale
- Northpark, Irvine homes for sale
- Northwood, Irvine homes for sale
- Northwood Point, Irvine homes for sale
- Orange Park Acres, Orange homes for sale
- Orchard Hills, Irvine homes for sale
- Panorama Heights, Santa Ana homes for sale
- Red Hill, Santa Ana homes for sale
- Stonegate, Irvine homes for sale
- Tustin Field, Tustin homes for sale
- Tustin Ranch, Tustin homes for sale
- Walnut, Irvine homes for sale
- West Irvine, Irvine homes for sale
Protect your home and budget from life's surprises with an Assurant Home Warranty, backed by a partner that supports you through every step of homeownership. Explore Plans.
©2026 Century 21 Real Estate LLC. All rights reserved. CENTURY 21®, the CENTURY 21 Logo and C21® are service marks owned by Century 21 Real Estate LLC. Century 21 Real Estate LLC fully supports the principles of the Fair Housing Act and the Equal Opportunity Act. Each office is independently owned and operated. Listing information is deemed reliable but not guaranteed accurate.