- Anaheim Hills homes for sale
- Anaheim-Santa Ana-Garden Grove homes for sale
- Chino homes for sale
- Chino Hills homes for sale
- Corona homes for sale
- Coronita homes for sale
- El Cerrito homes for sale
- Foothill Ranch homes for sale
- Irvine homes for sale
- Irvine-Lake Forest homes for sale
- Jurupa homes for sale
- Norco homes for sale
- North Tustin homes for sale
- Orange homes for sale
- Placentia homes for sale
- Silverado homes for sale
- Tustin homes for sale
- Villa Park homes for sale
- Williams Canyon homes for sale
- Yorba Linda homes for sale
92808, CA - homes for sale
59 of 59 results displayed
- Coming Soon
 $784,900Coming Soon2 beds 2 baths
7824 E Horizon View, Anaheim Hills, CA 92808
MLS# PW26123499Listed by: SEVEN GABLES REAL ESTATE - New
 $849,990Active3 beds 3 baths1,250 sq. ft.
8313 E Arrowhead Way, Anaheim, CA 92808
MLS# OC26121979Listed by: OPTIMUM FIRST, INC. - New
 $1,985,000Active3 beds 3 baths2,673 sq. ft.
450 S Via Vista Road, Anaheim Hills, CA 92808
MLS# PW26119281Listed by: RE/MAX R. E. SPECIALISTS - New
 $619,000Active2 beds 2 baths987 sq. ft.
1040 S San Marino, Anaheim, CA 92808
MLS# NP26122372Listed by: COMPASS - New
 $1,985,000Active3 beds 3 baths2,673 sq. ft.
450 S Via Vista Road, Anaheim Hills, CA 92808
MLS# PW26119281Listed by: RE/MAX R. E. SPECIALISTS - New
 $715,000Active3 beds 2 baths1,142 sq. ft.
1099 S San Marino, Anaheim, CA 92808
MLS# PW26120426Listed by: PREMIER REALTY - New
 $899,900Active2 beds 3 baths1,449 sq. ft.
7300 E Singingwood, Anaheim Hills, CA 92808
MLS# PW26120179Listed by: PRIDEMARK REAL ESTATE - New
 $744,900Active2 beds 2 baths976 sq. ft.
1027 S Stresa, Anaheim Hills, CA 92808
MLS# OC26118597Listed by: O'DONNELL REAL ESTATE - New
 $1,398,000Active3 beds 3 baths2,345 sq. ft.
510 S Laureltree, Anaheim Hills, CA 92808
MLS# PW26118038Listed by: FIRST TEAM REAL ESTATE - Coming Soon
 $875,000Coming Soon3 beds 3 baths
1176 S Country Glen, Anaheim, CA 92808
MLS# SR26116538Listed by: EQUITY UNION  $1,449,000Active4 beds 3 baths1,974 sq. ft.
491 S Hibiscus Way, Anaheim Hills, CA 92808
MLS# OC26111545Listed by: COMPASS $1,449,000Active4 beds 3 baths1,974 sq. ft.
491 S Hibiscus Way, Anaheim Hills, CA 92808
MLS# OC26111545Listed by: COMPASS $2,589,999Pending5 beds 5 baths3,774 sq. ft.
1049 S Summer Breeze, Anaheim Hills, CA 92808
MLS# PW26108451Listed by: BHHS CA PROPERTIES $3,299,999Active5 beds 5 baths5,111 sq. ft.
185 S Trish Court, Anaheim Hills, CA 92808
MLS# PW26108457Listed by: BHHS CA PROPERTIES $1,799,000Pending5 beds 3 baths2,700 sq. ft.
1075 S Matthew Way, Anaheim Hills, CA 92828
MLS# LG26110446Listed by: FIRST TEAM REAL ESTATE $819,900Active2 beds 2 baths1,299 sq. ft.
7833 E Viewrim, Anaheim Hills, CA 92808
MLS# PW26109445Listed by: SEVEN GABLES REAL ESTATE $1,339,000Pending5 beds 4 baths2,718 sq. ft.
1065 S Hanlon Way, Anaheim Hills, CA 92808
MLS# PTP2603828Listed by: BHGRE CLARITY $1,349,000Active4 beds 3 baths2,322 sq. ft.
8815 E Wiley, Anaheim Hills, CA 92808
MLS# OC26106678Listed by: REALTY ONE GROUP WEST $2,650,000Active6 beds 5 baths6,000 sq. ft.
170 S Mohler, Anaheim Hills, CA 92808
MLS# PW26103012Listed by: EXP REALTY OF SOUTHERN CA, INC $2,149,000Active5 beds 4 baths3,927 sq. ft.
370 S Yorkshire, Anaheim, CA 92808
MLS# OC26101761Listed by: FIRST TEAM REAL ESTATE $649,900Active2 beds 2 baths1,046 sq. ft.
1294 S Country Glen, Anaheim, CA 92808
MLS# PW26105449Listed by: CIRCA PROPERTIES, INC. $1,550,000Active5 beds 3 baths3,050 sq. ft.
7351 E Calle Durango, Anaheim Hills, CA 92808
MLS# PW26104900Listed by: CALIBER REAL ESTATE GROUP $750,000Active2 beds 2 baths1,162 sq. ft.
7839 E Viewrim, Anaheim, CA 92808
MLS# OC26104792Listed by: LPT REALTY, INC $710,000Active2 beds 2 baths1,061 sq. ft.
655 S Glenhurst, Anaheim, CA 92808
MLS# PW26102656Listed by: ERA NORTH ORANGE COUNTY $1,450,000Pending4 beds 3 baths2,311 sq. ft.
1055 S Highridge Court, Anaheim Hills, CA 92808
MLS# PW26100545Listed by: KELLER WILLIAMS REALTY $649,000Pending2 beds 2 baths1,000 sq. ft.
1089 S Daybreak Court, Anaheim Hills, CA 92808
MLS# PW26098525Listed by: COLDWELL BANKER REALTY $720,000Active3 beds 3 baths1,205 sq. ft.
1000 S Volterra, Anaheim, CA 92808
MLS# PW26095664Listed by: BHHS CA PROPERTIES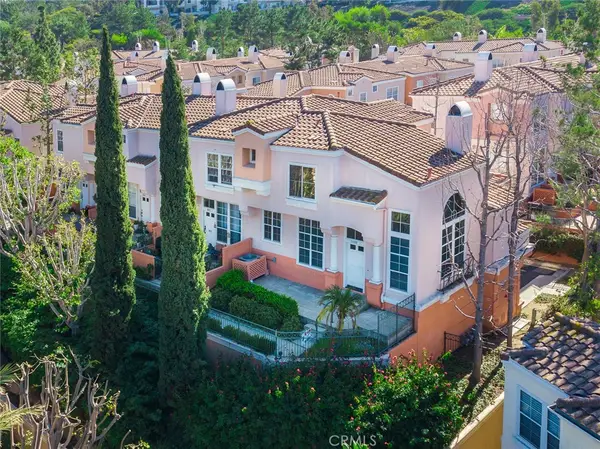 $720,000Active3 beds 3 baths1,205 sq. ft.
1000 S Volterra, Anaheim, CA 92808
MLS# PW26095664Listed by: BHHS CA PROPERTIES $849,000Active3 beds 3 baths1,248 sq. ft.
1209 S Country Glen, Anaheim Hills, CA 92808
MLS# SR26087292Listed by: PINNACLE ESTATE PROPERTIES $769,900Active2 beds 3 baths1,374 sq. ft.
512 S Hollydale, Anaheim, CA 92808
MLS# PW26093088Listed by: THE OPPENHEIM GROUP $1,788,000Active5 beds 4 baths2,944 sq. ft.
8781 E Banner Ridge, Anaheim, CA 92808
MLS# WS26093335Listed by: WETRUST REALTY $1,365,000Pending3 beds 3 baths2,259 sq. ft.
527 S Morningstar Drive, Anaheim, CA 92808
MLS# OC26087984Listed by: REDFIN $744,900Active3 beds 3 baths1,171 sq. ft.
992 S Country Glen Way, Anaheim, CA 92808
MLS# 260009854SDListed by: ONE MISSION REALTY $2,549,999Active5 beds 5 baths4,072 sq. ft.
847 S Canyon Mist Lane, Anaheim Hills, CA 92808
MLS# SW26084766Listed by: DREAMSCAPE REAL ESTATE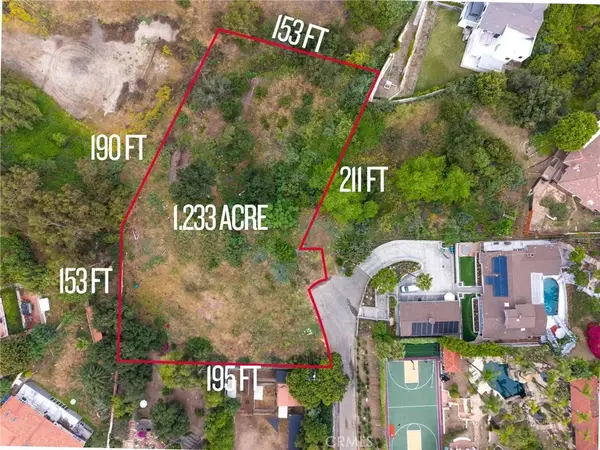 $870,000Active0 Acres
425 S Cooks Corner, Anaheim Hills, CA 92808
MLS# IV26081201Listed by: PRICE REAL ESTATE GROUP, INC $919,900Pending3 beds 2 baths1,330 sq. ft.
8462 E Amberwood Street, Anaheim, CA 92801
MLS# 26002995Listed by: KELLER WILLIAMS REALTY A.V. $719,900Pending2 beds 2 baths1,162 sq. ft.
7877 E Horizon View, Anaheim Hills, CA 92808
MLS# PW26078021Listed by: SEVEN GABLES REAL ESTATE $795,000Active0 Acres
414 S Cooks Corner, Anaheim, CA 92808
MLS# OC26059624Listed by: EXP REALTY OF SOUTHERN CALIFORNIA, INC $699,000Active2 beds 2 baths1,000 sq. ft.
631 S Dewberry, Anaheim Hills, CA 92808
MLS# OC26050301Listed by: AMERICAN PRESTIGE REALTY $2,595,000Pending5 beds 6 baths4,943 sq. ft.
8176 E Bailey Way, Anaheim Hills, CA 92808
MLS# PW25271241Listed by: SEVEN GABLES REAL ESTATE $724,900Active2 beds 2 baths1,061 sq. ft.
8070 E Goldenrod, Anaheim, CA 92808
MLS# PW26018211Listed by: KELLER WILLIAMS REALTY $2,395,000Active6 beds 4 baths4,251 sq. ft.
732 S S Rosecrest Cir, Anaheim Hills, CA 92808
MLS# PW26046883Listed by: A & A REALTY $2,475,000Pending5 beds 5 baths4,247 sq. ft.
8109 E Bailey, Anaheim Hills, CA 92808
MLS# PW26043389Listed by: BHHS CA PROPERTIES $698,888Active2 beds 3 baths994 sq. ft.
8142 E Naples Lane, Anaheim Hills, CA 92808
MLS# PW26040815Listed by: EXP REALTY OF CALIFORNIA INC $719,000Active2 beds 2 baths1,061 sq. ft.
8070 E Oak Ridge Circle, Anaheim Hills, CA 92808
MLS# PW26034827Listed by: FIRST TEAM REAL ESTATE $735,000Active2 beds 2 baths1,162 sq. ft.
7835 E Viewrim, Anaheim, CA 92808
MLS# TR26035643Listed by: UNIVERSAL ELITE INC. $1,899,000Pending4 beds 5 baths3,164 sq. ft.
910 S Barton Court, Anaheim, CA 92808
MLS# CRWS26036910Listed by: PINNACLE REAL ESTATE GROUP $575,000Pending1 beds 2 baths865 sq. ft.
7912 E Monte Carlo, Anaheim, CA 92808
MLS# CRPW26029027Listed by: BHHS CA PROPERTIES $650,000Active2 beds 2 baths1,046 sq. ft.
1358 S Country Glen, Anaheim, CA 92808
MLS# PW26023280Listed by: CASITAS REAL ESTATE $6,200,000Active6 beds 6 baths6,200 sq. ft.
7584 E Vista Del Sol, Anaheim Hills, CA 92808
MLS# PW25281110Listed by: COLDWELL BANKER REALTY $795,000Active0.51 Acres
414 S Cooks Corner, Anaheim, CA 92808
MLS# OC26059624Listed by: EXP REALTY OF SOUTHERN CALIFORNIA, INC $669,000Active0 Acres
309 S Penny Lane, Anaheim, CA 92808
MLS# IG25276070Listed by: KELLER WILLIAMS REALTY $799,000Pending2 beds 3 baths1,374 sq. ft.
8116 E Oak Ridge, Anaheim, CA 92808
MLS# CROC25158399Listed by: EXP REALTY OF GREATER LOS ANGELES, INC. $2,279,000Active5 beds 4 baths3,370 sq. ft.
7680 E Eucalyptus Way, Anaheim, CA 92808
MLS# CL26641151Listed by: SOTHEBY'S INTERNATIONAL REALTY $1,295,000Active0 Acres
2462 Rising Sun Ct, Palm Springs, CA 92264
MLS# IG25003995Listed by: PLATINUM STAR PROPERTIES $799,000Pending3 beds 3 baths1,248 sq. ft.
1232 S Country Glen Way, Anaheim Hills, CA 92808
MLS# OC25245159Listed by: FIDUCIARY REAL ESTATE SERVICES $2,000,000Pending3 beds 2 baths2,128 sq. ft.
7630 East Pleasant Place, Anaheim, CA 92808
MLS# OC22118131Listed by: POINTE REAL ESTATE INC.- $1,339,000Active4 beds 3 baths2,518 sq. ft.
8880 E Foxhollow Drive, Anaheim, CA 92808
MLS# CRSR23155339Listed by: HOANG DUC NGUYEN  $1,515,000Pending4 beds 3 baths2,650 sq. ft.
8730 E Foxhollow Drive, Anaheim Hills, CA 92808
MLS# PW22131008Listed by: SEVEN GABLES REAL ESTATE
Local realty services provided by:CENTURY 21 Valley Properties, CENTURY 21 Affiliated, CENTURY 21 Virginia Wilder Real Estate, CENTURY 21 Sierra Properties
The information being provided by California Regional MLS (Southern California) is for the consumer's personal, non-commercial use and may not be used for any purpose other than to identify prospective properties consumer may be interested in purchasing. Any information relating to real estate for sale referenced on this web site comes from the Internet Data Exchange (IDX) program of the California Regional MLS (Southern California). CENTURY 21 Valley Properties is not a Multiple Listing Service (MLS), nor does it offer MLS access. This website is a service of CENTURY 21 Valley Properties, a broker participant of California Regional MLS (Southern California). This web site may reference real estate listing(s) held by a brokerage firm other than the broker and/or agent who owns this web site.
The accuracy of all information, regardless of source, including but not limited to open house information, square footages and lot sizes, is deemed reliable but not guaranteed and should be personally verified through personal inspection by and/or with the appropriate professionals. The data contained herein is copyrighted by California Regional MLS (Southern California) and is protected by all applicable copyright laws. Any unauthorized dissemination of this information is in violation of copyright laws and is strictly prohibited.
Copyright 2021 California Regional MLS (Southern California). All rights reserved. CRMLS Member Broker: Anthony Guetzoian
This information is deemed reliable but not guaranteed. You should rely on this information only to decide whether or not to further investigate a particular property. BEFORE MAKING ANY OTHER DECISION, YOU SHOULD PERSONALLY INVESTIGATE THE FACTS (e.g. square footage and lot size) with the assistance of an appropriate professional. You may use this information only to identify properties you may be interested in investigating further. All uses except for personal, non-commercial use in accordance with the foregoing purpose are prohibited. Redistribution or copying of this information, any photographs or video tours is strictly prohibited. This information is derived from the Internet Data Exchange (IDX) service provided by San Diego MLS®. Displayed property listings may be held by a brokerage firm other than the broker and/or agent responsible for this display. The information and any photographs and video tours and the compilation from which they are derived is protected by copyright. Compilation © 2020 San Diego MLS®, Inc. SANDICOR Member Broker: Nikki Coppa
Popular searches near 92808
Popular neighborhoods near 92808
- Anaheim Hills, Anaheim homes for sale
- Bryant Ranch, Yorba Linda homes for sale
- Coronita, Corona homes for sale
- East Lake Village, Yorba Linda homes for sale
- El Modena, Orange homes for sale
- Hidden Hills, Yorba Linda homes for sale
- Kerrigan Ranch, Yorba Linda homes for sale
- Mabury Ranch, Orange homes for sale
- Mountain Gate, Corona homes for sale
- Orange Foothills, Orange homes for sale
- Orange Park Acres, Orange homes for sale
- Orchard Hills, Irvine homes for sale
- Panorama Heights, Santa Ana homes for sale
- Serrano Heights, Orange homes for sale
- Sierra del Oro, Corona homes for sale
- Sycamore Canyon, Anaheim homes for sale
- The Highlands, Anaheim homes for sale
- The Summit, Anaheim homes for sale
- Tustin Ranch, Tustin homes for sale
- Villa Park, Villa Park homes for sale
Protect your home and budget from life's surprises with an Assurant Home Warranty, backed by a partner that supports you through every step of homeownership. Explore Plans.
©2026 Century 21 Real Estate LLC. All rights reserved. CENTURY 21®, the CENTURY 21 Logo and C21® are service marks owned by Century 21 Real Estate LLC. Century 21 Real Estate LLC fully supports the principles of the Fair Housing Act and the Equal Opportunity Act. Each office is independently owned and operated. Listing information is deemed reliable but not guaranteed accurate.