- Canyon Lake homes for sale
- Corona homes for sale
- Coto De Caza homes for sale
- El Cerrito homes for sale
- El Sobrante homes for sale
- Elsinore Valley homes for sale
- Foothill Ranch homes for sale
- Good Hope homes for sale
- Home Gardens homes for sale
- Lake Elsinore homes for sale
- Lake Mathews homes for sale
- Lakeland Village homes for sale
- Meadowbrook homes for sale
- Rancho Santa Margarita homes for sale
- Silverado homes for sale
- Temescal Valley homes for sale
- Trabuco Canyon homes for sale
- Warm Springs homes for sale
- Williams Canyon homes for sale
- Woodcrest homes for sale
92883, CA - homes for sale
293 of 293 results displayed
- Open Mon, 1 to 4pmNew
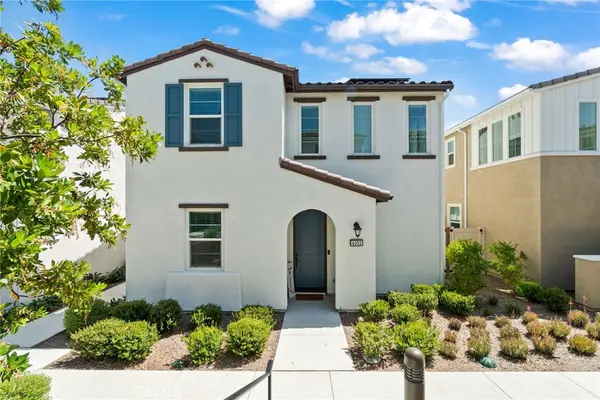
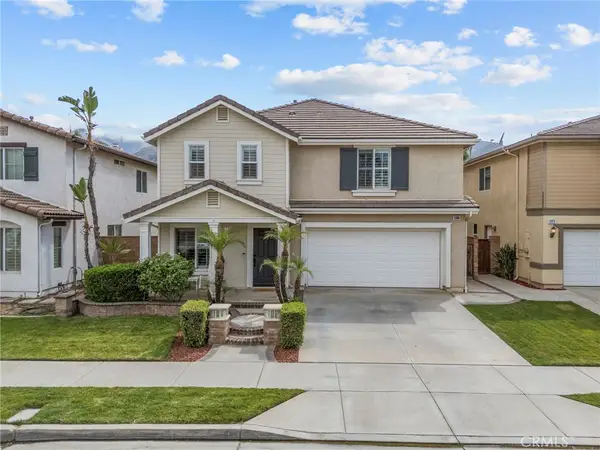
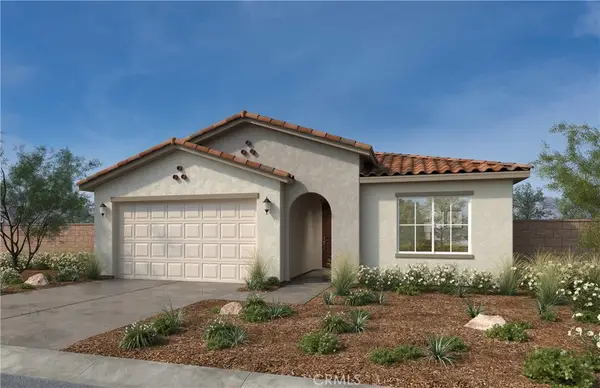 $689,990Active3 beds 2 baths2,026 sq. ft.
27430 Modjeska Court, Corona, CA 92883
MLS# SW26123607Listed by: KB HOME SALES-SOUTHERN CA INC - Open Mon, 11am to 4pmNew
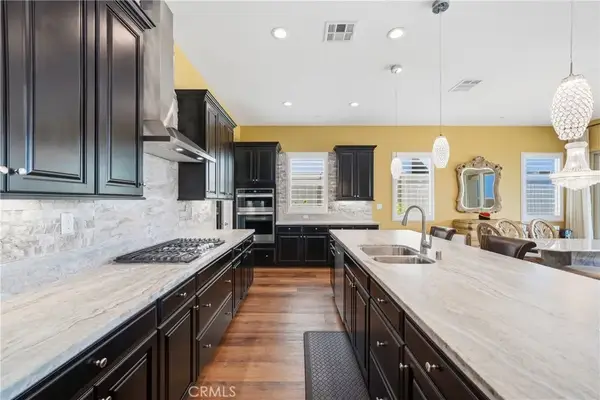
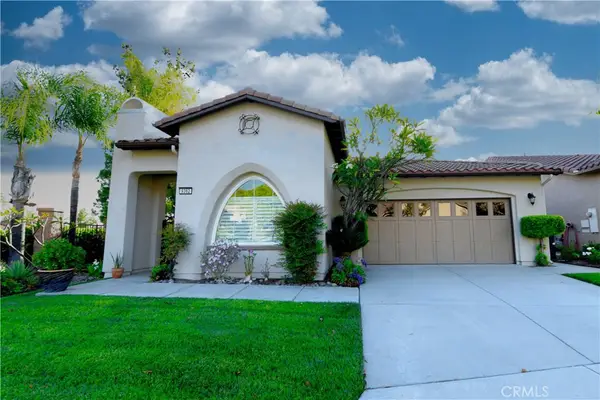
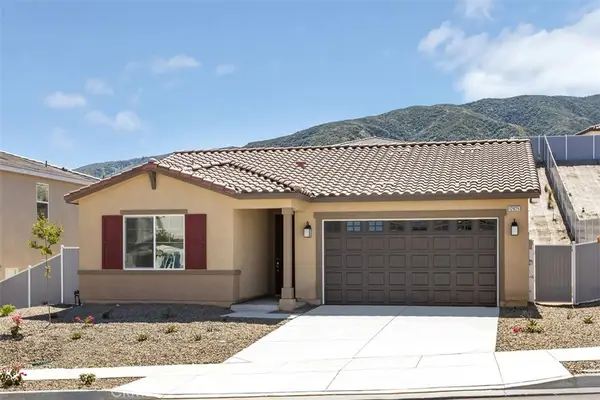 $678,064Active3 beds 2 baths1,618 sq. ft.
12825 Olympus Circle, Corona, CA 92883
MLS# SW26123608Listed by: KB HOME SALES-SOUTHERN CA INC - New
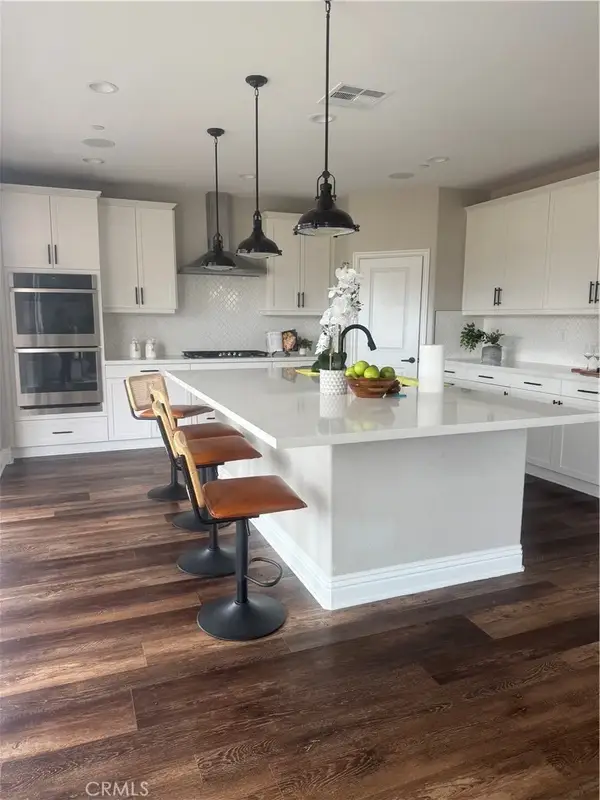
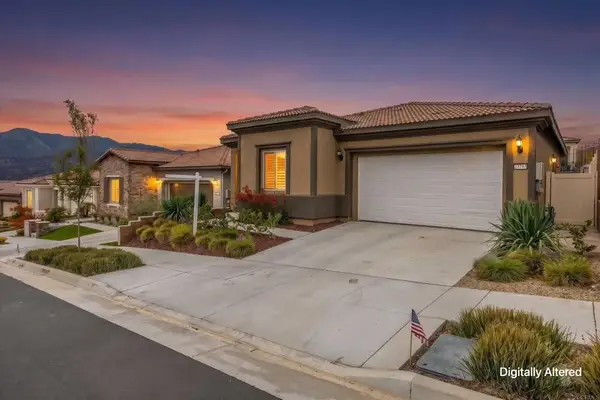
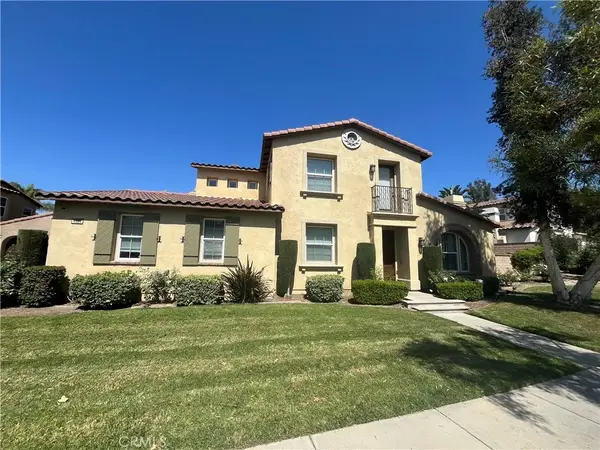 $1,050,000Active5 beds 3 baths2,666 sq. ft.
4326 Altivo, Corona, CA 92883
MLS# IG26123049Listed by: REALTY MASTERS & ASSOCIATES - New
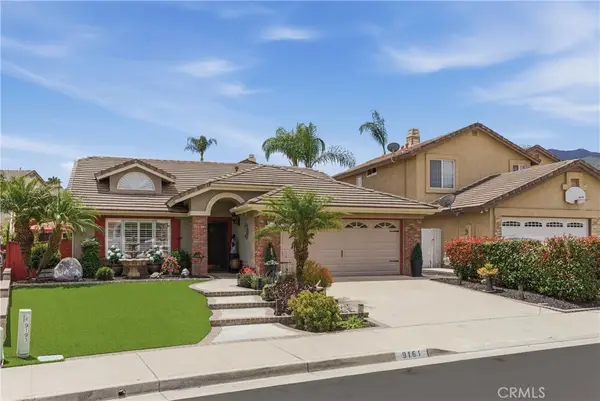
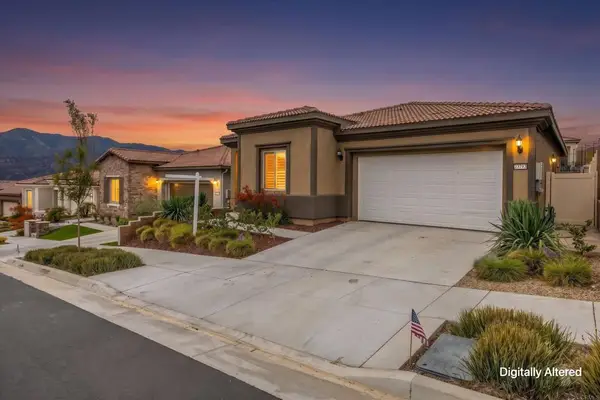
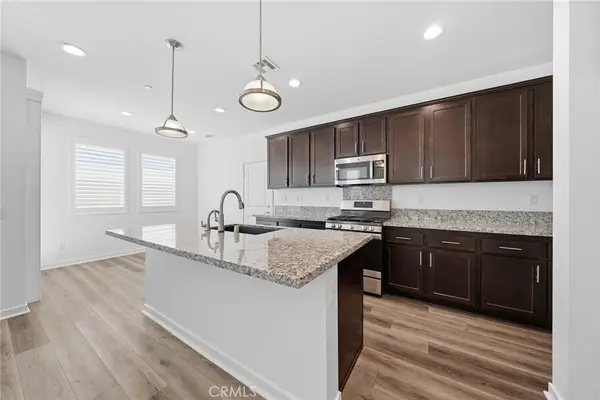 $769,999Active3 beds 4 baths2,111 sq. ft.
4231 Adishian, Corona, CA 92883
MLS# PW26123109Listed by: TPL REALTY - New
 $1,099,000Active6 beds 4 baths3,703 sq. ft.
23422 Camino Terraza, Corona, CA 92883
MLS# IG26120288Listed by: KELLER WILLIAMS REALTY - New
 $740,000Active4 beds 3 baths1,776 sq. ft.
4052 Summer Way, Corona, CA 92883
MLS# PW26122478Listed by: EXP REALTY OF CALIFORNIA INC - New
 $850,000Active3 beds 2 baths1,902 sq. ft.
11829 Wandering Way, Corona, CA 92883
MLS# IV26117170Listed by: RE/MAX TIME REALTY - New
 $890,000Active4 beds 3 baths2,900 sq. ft.
11313 Atlas Court, Corona, CA 92883
MLS# PW26121983Listed by: ANA REAL ESTATE - New
 $735,000Active3 beds 2 baths1,686 sq. ft.
9161 Sydney Blue Circle, Corona, CA 92883
MLS# PW26116691Listed by: FIRST TEAM REAL ESTATE - New
 $859,900Active5 beds 3 baths3,603 sq. ft.
11262 Tesota, Corona, CA 92883
MLS# SR26120869Listed by: ANDREW JOHN YOUNG - Open Sat, 2 to 4pmNew
 $699,999Active4 beds 3 baths1,967 sq. ft.
4044 Shada Lane, Corona, CA 92883
MLS# WS26121173Listed by: PACIFIC STERLING REALTY/IRVINE - New
 $769,900Active5 beds 3 baths2,699 sq. ft.
11389 Magnolia Street, Corona, CA 92883
MLS# IG26108911Listed by: REALTY ONE GROUP WEST - New
 $839,000Active3 beds 4 baths2,198 sq. ft.
8784 Larkspur, Corona, CA 92883
MLS# PW26120250Listed by: CALIFORNIA BRIDGE REALTY - New
 $809,900Active2 beds 2 baths2,160 sq. ft.
24590 Crestley Drive, Corona, CA 92883
MLS# CV26105433Listed by: KW VISION - New
 $739,000Active2 beds 2 baths1,744 sq. ft.
11855 Sagecrest Court, Corona, CA 92883
MLS# IV26115657Listed by: COMPASS - Coming SoonOpen Sat, 1 to 4pm
 $735,000Coming Soon2 beds 2 baths
9362 Reserve, Corona, CA 92883
MLS# IG26112504Listed by: ELEVATE REAL ESTATE AGENCY - New
 $644,000Active2 beds 2 baths1,374 sq. ft.
23793 Highvale Drive, Corona, CA 92883
MLS# NDP2605241Listed by: KELLER WILLIAMS REALTY - New
 $644,000Active2 beds 2 baths1,374 sq. ft.
23793 Highvale Drive, Corona, CA 92883
MLS# NDP2605241Listed by: KELLER WILLIAMS REALTY - New
 $499,000Active2 beds 2 baths1,152 sq. ft.
24640 Bandit Way, Temescal Valley, CA 92883
MLS# CV26116688Listed by: THE IMAGINATION BROKERAGE - New
 $745,000Active2 beds 2 baths1,758 sq. ft.
24145 Fawnskin, Corona, CA 92883
MLS# IG26116794Listed by: REALTY MASTERS & ASSOCIATES - New
 $849,900Active5 beds 3 baths2,363 sq. ft.
27210 Arrow Point, Corona, CA 92883
MLS# IV26117242Listed by: LEGACY HOMES REAL ESTATE - New
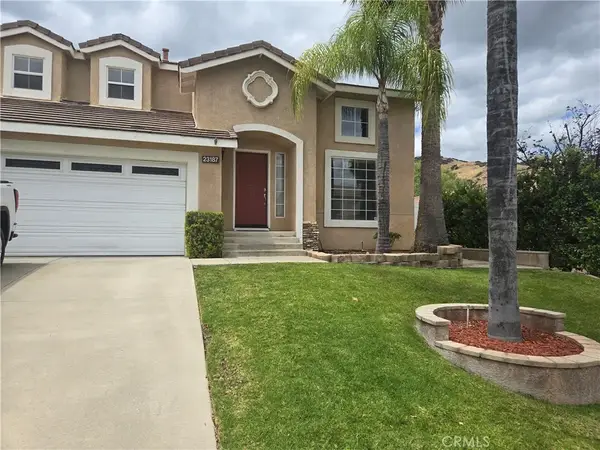 $759,000Active4 beds 3 baths1,873 sq. ft.
23187 Coffee Berry, Corona, CA 92883
MLS# PW26117256Listed by: BROWNSTONE REALTY - New
 $615,800Active3 beds 3 baths1,402 sq. ft.
3959 Lavine Way #107, Corona, CA 92883
MLS# OC26117026Listed by: THE OPPENHEIM GROUP - New
 $800,000Active3 beds 2 baths1,766 sq. ft.
23732 Bella Vista Road, Corona, CA 92883
MLS# 219148521PSListed by: I HEART REAL ESTATE, INC. - New
 $615,800Active3 beds 3 baths1,402 sq. ft.
3959 Lavine Way #107, Corona, CA 92883
MLS# OC26117026Listed by: THE OPPENHEIM GROUP  $639,000Pending4 beds 3 baths2,001 sq. ft.
9074 Lantana, Corona, CA 92883
MLS# IG26116948Listed by: KELLER WILLIAMS REALTY- New
 $869,000Active5 beds 3 baths3,417 sq. ft.
11056 Guffey Ranch Way, Corona, CA 92883
MLS# PW26105958Listed by: JASON MITCHELL REAL ESTATE CALIFORNIA, INC. - New
 $997,500Active3 beds 4 baths2,486 sq. ft.
11748 Ambling Way, Corona, CA 92883
MLS# IV26109105Listed by: COLDWELL BANKER REALTY - New
 $789,900Active5 beds 4 baths3,087 sq. ft.
25227 Coral Canyon Road, Corona, CA 92883
MLS# SW26115565Listed by: LPT REALTY, INC 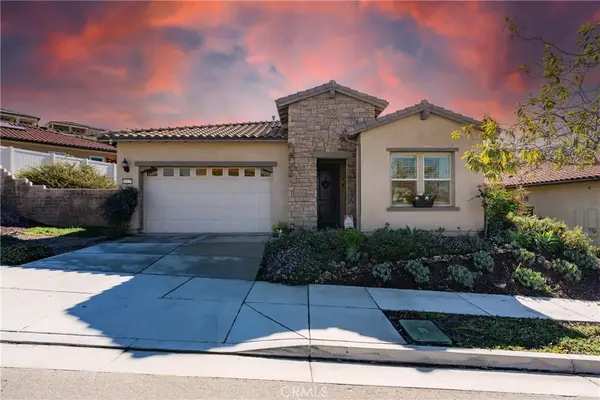 $699,000Active2 beds 2 baths1,747 sq. ft.
11137 Briar Rose Court, Corona, CA 92883
MLS# IV26115455Listed by: ABUNDANT HOME REAL ESTATE $1,400,000Pending5 beds 5 baths4,152 sq. ft.
8421 Sunset Rose, Corona, CA 92883
MLS# OC26115984Listed by: TEAM GAGE R E CENTER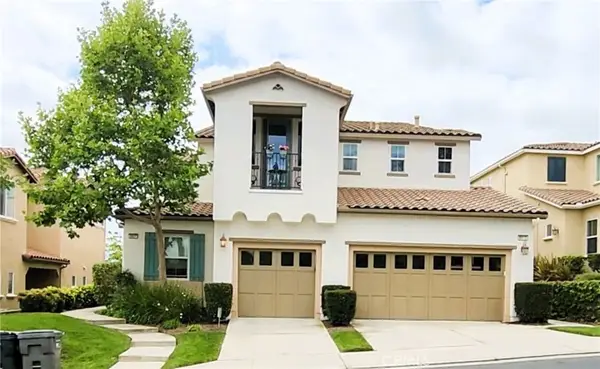 $539,900Active2 beds 2 baths1,404 sq. ft.
8807 Cuyamaca, Corona, CA 92883
MLS# IG26114685Listed by: ELEVATE REAL ESTATE AGENCY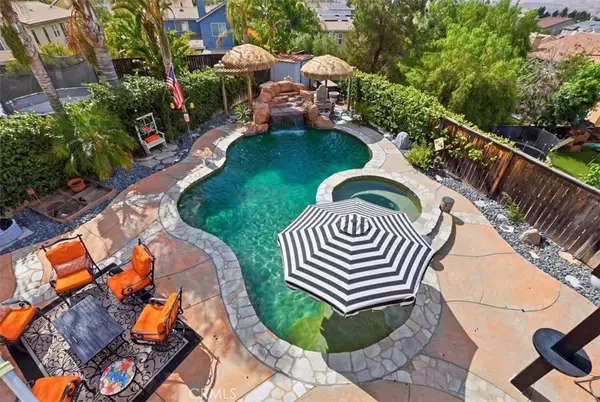 $1,050,000Active5 beds 3 baths3,893 sq. ft.
11050 Buttonbush Court, Corona, CA 92883
MLS# IV26114235Listed by: WESTCOE REALTORS INC $814,000Active4 beds 3 baths2,444 sq. ft.
11415 Valley Oak, Corona, CA 92883
MLS# OC26110922Listed by: FIRST TEAM REAL ESTATE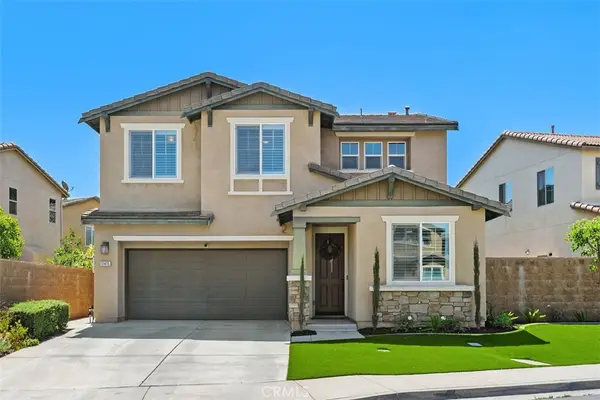 $814,000Active4 beds 3 baths2,444 sq. ft.
11415 Valley Oak, Corona, CA 92883
MLS# OC26110922Listed by: FIRST TEAM REAL ESTATE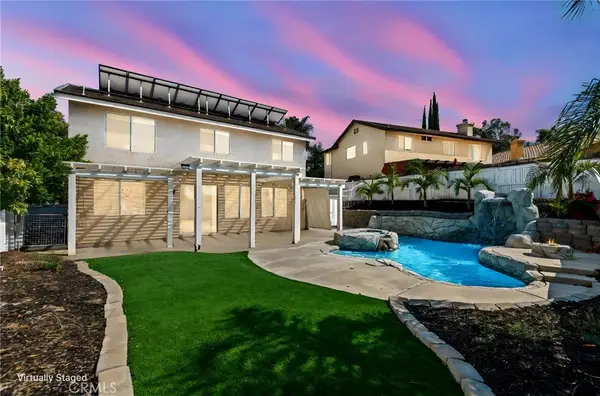 $730,000Active4 beds 3 baths1,798 sq. ft.
27483 Bunkerhill Drive, Corona, CA 92883
MLS# SW26113175Listed by: REDFIN CORPORATION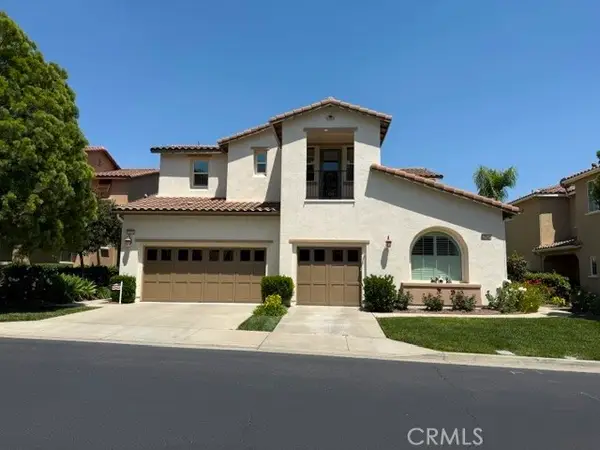 $615,000Active2 beds 3 baths2,051 sq. ft.
23830 La Posta Court, Corona, CA 92883
MLS# PW26111345Listed by: BHHS CA PROPERTIES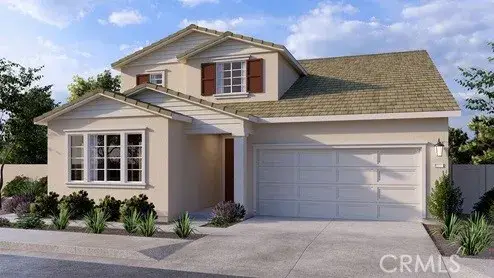 $903,990Active4 beds 4 baths2,617 sq. ft.
11404 Forge Road, Corona, CA 92883
MLS# SW26112905Listed by: D R HORTON AMERICA'S BUILDER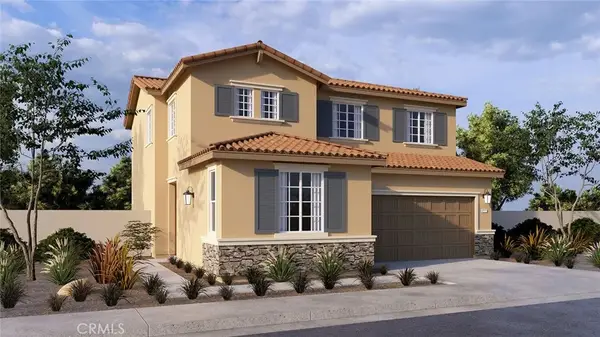 $798,990Active4 beds 3 baths2,079 sq. ft.
26224 Towhee Lane, Corona, CA 92883
MLS# SW26112799Listed by: D R HORTON AMERICA'S BUILDER $728,900Active3 beds 4 baths1,987 sq. ft.
4247 #107 Horvath Street #107, Corona, CA 92883
MLS# IG26111368Listed by: REALTY ONE GROUP WEST $649,900Active3 beds 3 baths1,798 sq. ft.
27520 Coyote Mesa Drive, Corona, CA 92883
MLS# IV26112238Listed by: MAINSTREET, REALTORS $999,000Active5 beds 5 baths4,158 sq. ft.
25340 Coral Canyon Road, Corona, CA 92883
MLS# 26837673Listed by: COMPASS $680,000Active3 beds 3 baths1,682 sq. ft.
4155 Windspring Street, Corona, CA 92883
MLS# CV26110820Listed by: KELLER WILLIAMS EMPIRE ESTATES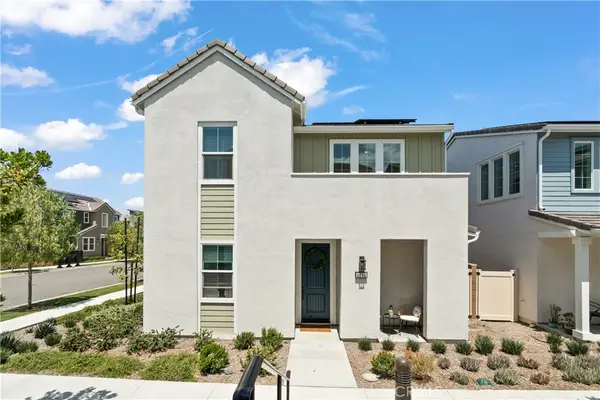 $743,430Active4 beds 3 baths1,776 sq. ft.
4044 Summer Way, Corona, CA 92883
MLS# TR26109774Listed by: HOMECOIN.COM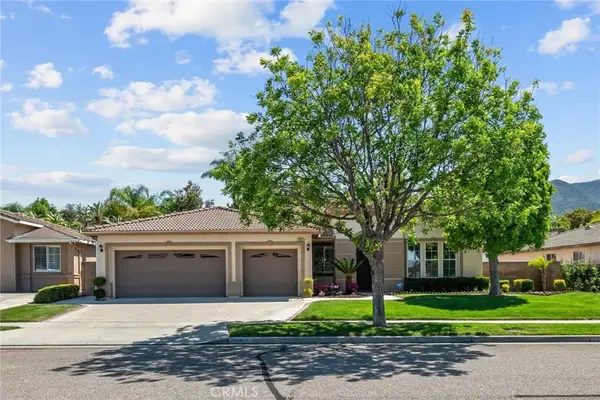 $950,000Active4 beds 3 baths2,617 sq. ft.
1856 Plainfield, Corona, CA 92883
MLS# IG26111612Listed by: KASI HOMES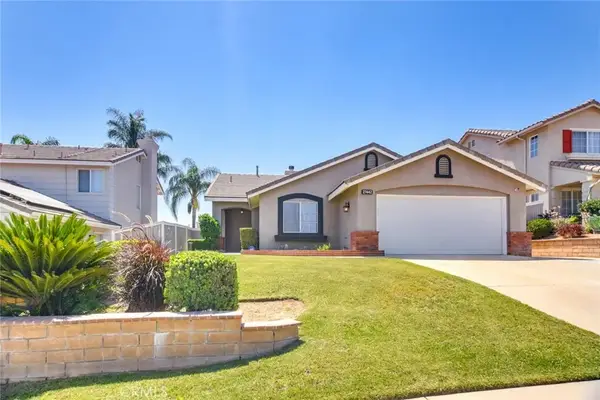 $660,000Active3 beds 2 baths1,442 sq. ft.
27442 Barcelona, Corona, CA 92883
MLS# IG26110882Listed by: REALTY ONE GROUP WEST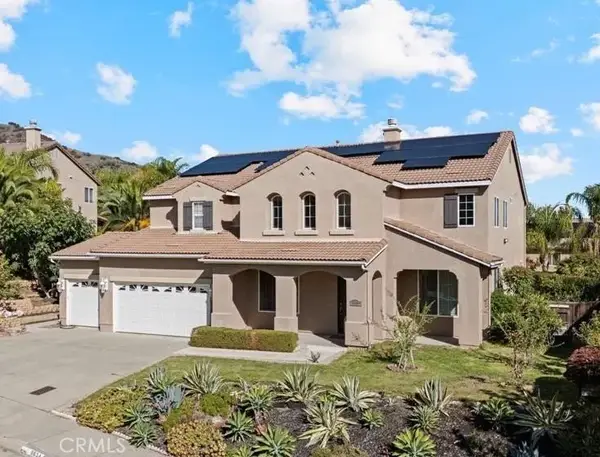 $1,150,000Active5 beds 4 baths3,939 sq. ft.
8634 Hunt Canyon Road, Corona, CA 92883
MLS# PW26110624Listed by: YES PROPERTIES, INC.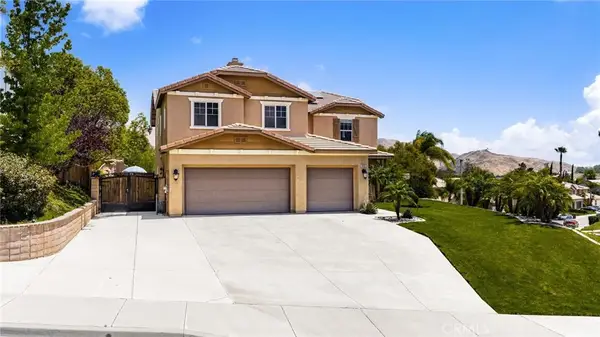 $980,000Active4 beds 3 baths3,512 sq. ft.
24322 Kenosha Court, Corona, CA 92883
MLS# CV26110716Listed by: THE AGENCY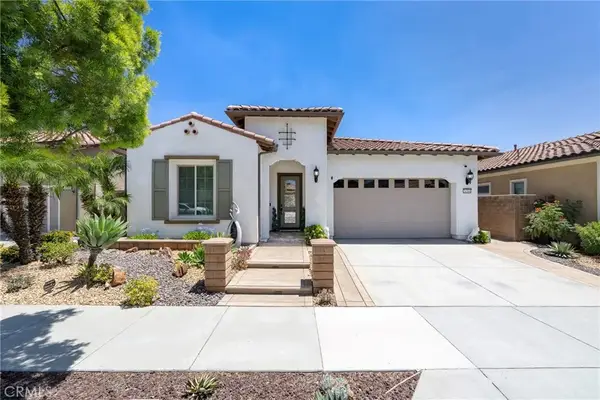 $689,000Active2 beds 2 baths1,740 sq. ft.
24368 Overlook, Corona, CA 92883
MLS# PW26107812Listed by: COLDWELL BANKER REALTY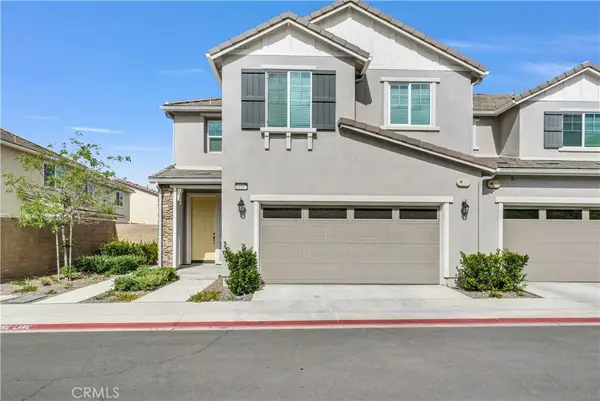 $749,000Active4 beds 3 baths2,010 sq. ft.
24047 Ashton Road #125, Corona, CA 92883
MLS# OC26110459Listed by: FIRST TEAM REAL ESTATE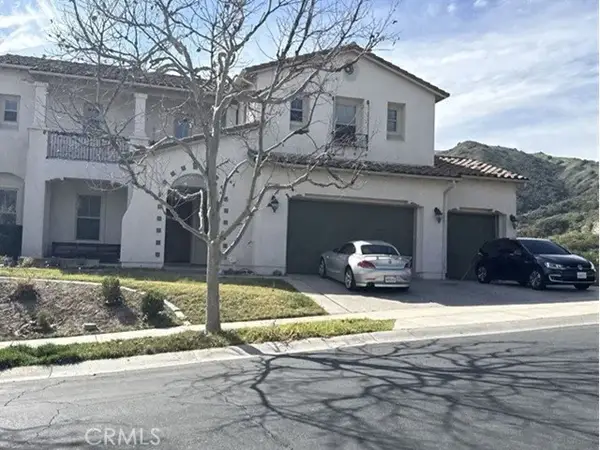 $1,522,500Active4 beds 4 baths4,767 sq. ft.
8029 Sanctuary Drive, Corona, CA 92883
MLS# IV26110646Listed by: REALHOME SERVICES & SOLUTIONS $999,000Active5 beds 3 baths3,076 sq. ft.
4469 Driving Range, Corona, CA 92883
MLS# IG26109431Listed by: KELLER WILLIAMS REALTY $690,000Active4 beds 3 baths1,936 sq. ft.
27406 Echo Canyon Court, Corona, CA 92883
MLS# SW26108577Listed by: COLDWELL BANKER ASSOC.BRKS-CL $1,174,900Pending4 beds 3 baths2,626 sq. ft.
4241 Stonebriar, Corona, CA 92883
MLS# IG26109967Listed by: KELLER WILLIAMS REALTY $828,888Active5 beds 3 baths2,640 sq. ft.
23809 Solaris Court, Corona, CA 92883
MLS# IG26108628Listed by: FIV REALTY CO. $649,000Active4 beds 3 baths1,592 sq. ft.
13066 Broken Bit, Corona, CA 92883
MLS# PW26108976Listed by: KELLER WILLIAMS EMPIRE ESTATES $1,189,000Active8 beds 5 baths4,666 sq. ft.
8550 Rolling Hills Drive, Corona, CA 92883
MLS# IG26109153Listed by: FAIRMONT AGENCY $604,990Active2 beds 2 baths1,366 sq. ft.
23676 Shoal Drive, Corona, CA 92883
MLS# IV26108821Listed by: PULTE HOMES OF CALIFORNIA, INC $623,257Active2 beds 2 baths1,375 sq. ft.
23687 Shoal Drive, Corona, CA 92883
MLS# IV26108845Listed by: PULTE HOMES OF CALIFORNIA, INC $625,000Active3 beds 2 baths1,227 sq. ft.
9195 Stone Canyon Road, Corona, CA 92883
MLS# IV26108106Listed by: TOP LION REALTY $599,990Active2 beds 2 baths1,375 sq. ft.
11973 Hillsong Drive, Corona, CA 92883
MLS# IV26108805Listed by: PULTE HOMES OF CALIFORNIA, INC $875,000Active2 beds 4 baths2,384 sq. ft.
24246 Fawnskin, Corona, CA 92883
MLS# IG26100185Listed by: REALTY MASTERS & ASSOCIATES $599,900Active3 beds 3 baths1,350 sq. ft.
4260 Powell #119, Corona, CA 92883
MLS# IG26106923Listed by: KELLER WILLIAMS REALTY $799,900Active3 beds 3 baths2,266 sq. ft.
24869 Elison Court, Corona, CA 92883
MLS# CV26106152Listed by: JOSEPH MIRAFLOR, BROKER $495,000Active5 Acres
11221 Spanish Hills Drive, Corona, CA 92883
MLS# OC26106952Listed by: NEXUS COMMERCIAL $1,330,000Active5 beds 5 baths3,203 sq. ft.
3955 Belfry Circle, Corona, CA 92883
MLS# IG26103535Listed by: LPT REALTY, INC $539,900Active2 beds 2 baths1,404 sq. ft.
8960 Cuyamca, Corona, CA 92883
MLS# IG26105143Listed by: REALTY ONE GROUP WEST $605,000Active3 beds 2 baths1,312 sq. ft.
13366 Knollwood Drive, Corona, CA 92883
MLS# SW26106740Listed by: COLDWELL BANKER ASSOC BRKR-SC $1,330,000Active5 beds 5 baths3,203 sq. ft.
3955 Belfry Circle, Corona, CA 92883
MLS# IG26103535Listed by: LPT REALTY, INC $799,900Pending5 beds 4 baths3,594 sq. ft.
10877 Cameron Court, Corona, CA 92883
MLS# CV26103659Listed by: COLDWELL BANKER ENVISION $670,000Active3 beds 2 baths1,182 sq. ft.
23044 Canyon Hills Drive, Corona, CA 92883
MLS# DW26105657Listed by: UPTOWN, REALTORS $569,900Active2 beds 2 baths1,290 sq. ft.
9128 Deergrass Street, Corona, CA 92883
MLS# SW26105496Listed by: EXP REALTY OF CALIFORNIA, INC. $569,900Active2 beds 2 baths1,290 sq. ft.
9128 Deergrass Street, Corona, CA 92883
MLS# SW26105496Listed by: EXP REALTY OF CALIFORNIA, INC. $620,000Active3 beds 3 baths1,439 sq. ft.
26673 Kicking Horse Drive, Corona, CA 92883
MLS# IG26104493Listed by: ARIZAGA REAL ESTATE, INC. $1,168,000Active4 beds 3 baths3,413 sq. ft.
2918 Verdino Circle, Corona, CA 92883
MLS# IG26104163Listed by: OSCAR TORTOLA GROUP REAL ESTATE SERVICES $615,000Active3 beds 3 baths1,439 sq. ft.
13330 Green Mountain, Corona, CA 92883
MLS# CV26105000Listed by: REALTY ONE GROUP WEST $749,000Active4 beds 3 baths2,717 sq. ft.
25574 Hyacinth Street, Corona, CA 92883
MLS# OC26104566Listed by: KASE REAL ESTATE $735,000Active3 beds 3 baths2,253 sq. ft.
11268 Pinecone, Corona, CA 92883
MLS# CV26103975Listed by: EXP REALTY OF CALIFORNIA INC $735,000Active3 beds 3 baths2,253 sq. ft.
11268 Pinecone, Corona, CA 92883
MLS# CV26103975Listed by: EXP REALTY OF CALIFORNIA INC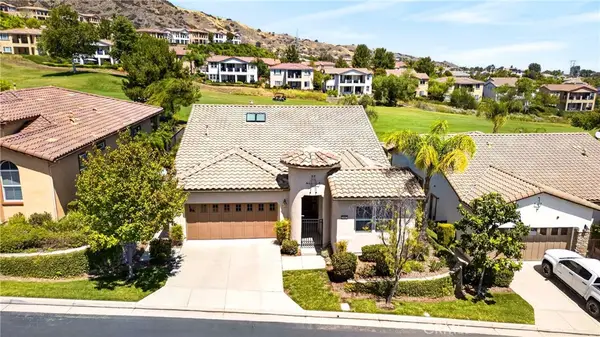 $748,880Pending2 beds 2 baths1,888 sq. ft.
23897 Fawnskin Drive, Corona, CA 92883
MLS# IG26101759Listed by: NEW STAR REALTY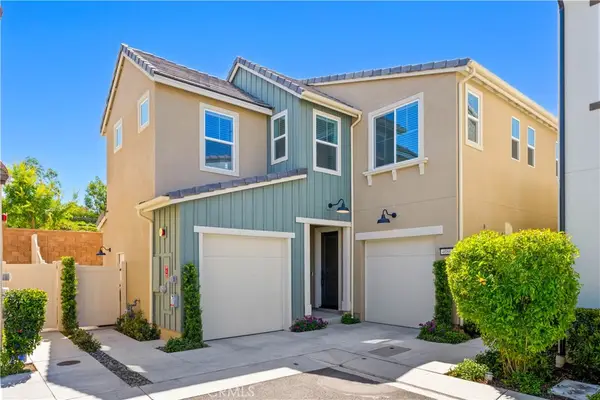 $829,000Active3 beds 3 baths2,013 sq. ft.
4089 Spring Haven Lane, Corona, CA 92883
MLS# OC26101896Listed by: REAL BROKER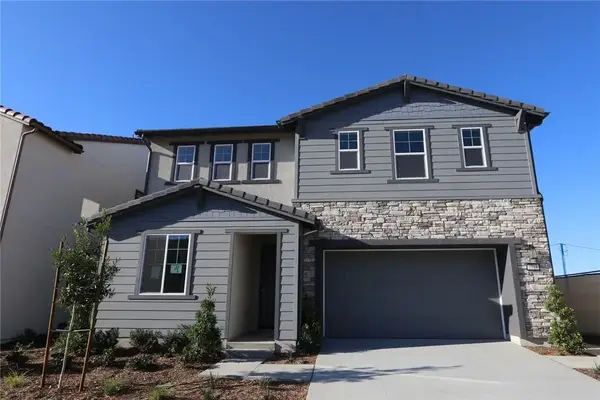 $1,032,472Active4 beds 4 baths3,036 sq. ft.
3718 Crossen Drive, Corona, CA 92883
MLS# OC26100967Listed by: TRI POINTE HOMES, INC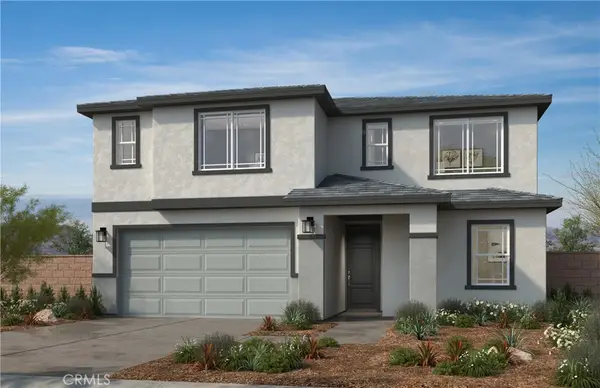 $809,247Active5 beds 4 baths2,874 sq. ft.
12837 Olympus Circle, Corona, CA 92883
MLS# SW26100929Listed by: KB HOME SALES-SOUTHERN CA INC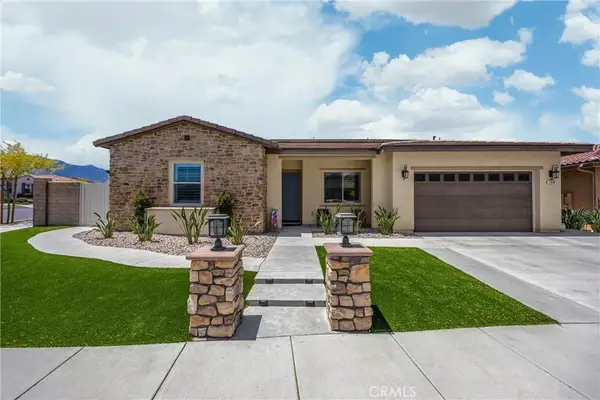 $925,000Active3 beds 4 baths2,486 sq. ft.
11638 Oakton Way, Corona, CA 92883
MLS# CV26100353Listed by: KASE REAL ESTATE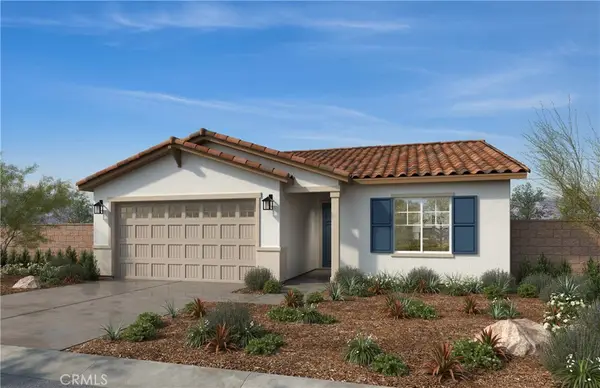 $724,620Pending4 beds 2 baths2,026 sq. ft.
27186 Denali Court, Corona, CA 92883
MLS# SW26099867Listed by: KB HOME SALES-SOUTHERN CA INC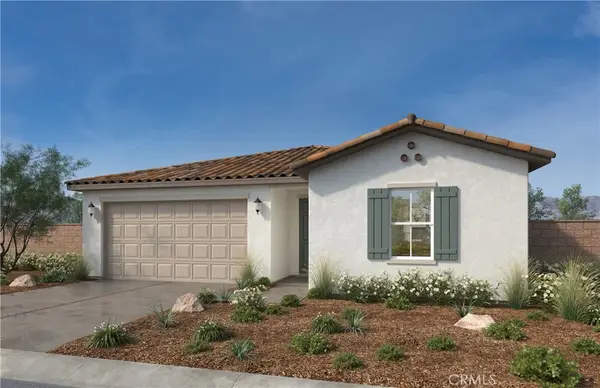 $639,990Pending3 beds 2 baths1,618 sq. ft.
12777 Olympus Circle, Corona, CA 92883
MLS# SW26099830Listed by: KB HOME SALES-SOUTHERN CA INC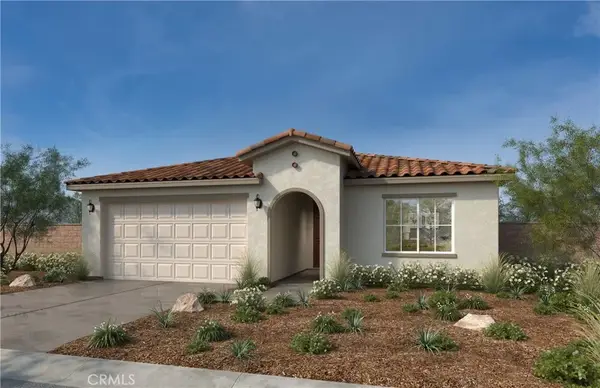 $725,207Active4 beds 2 baths2,026 sq. ft.
12780 Fuji Circle, Corona, CA 92883
MLS# SW26099530Listed by: KB HOME SALES-SOUTHERN CA INC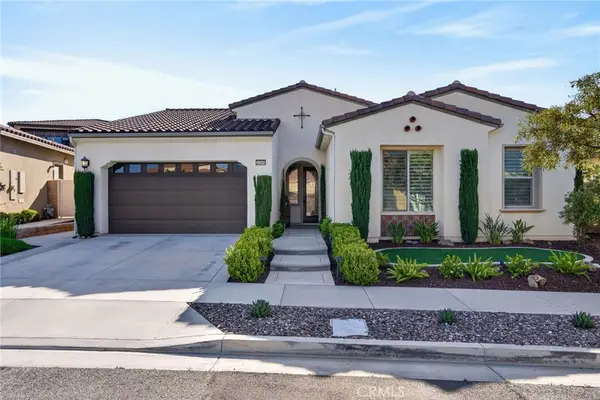 $825,000Active3 beds 2 baths2,208 sq. ft.
24340 Crestley Drive, Corona, CA 92883
MLS# IV26089420Listed by: COLDWELL BANKER REALTY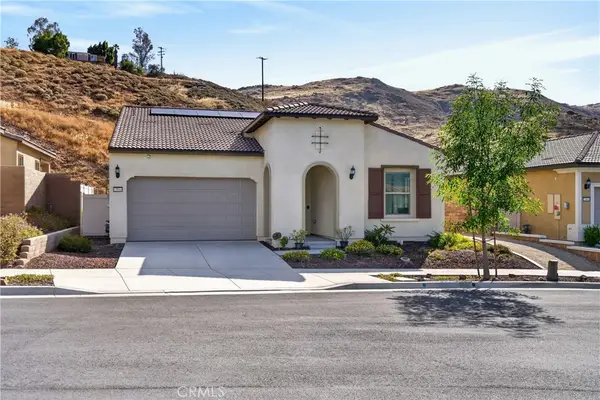 $770,000Active2 beds 2 baths1,902 sq. ft.
23944 Saunter Way, Corona, CA 92883
MLS# IV26089992Listed by: COLDWELL BANKER REALTY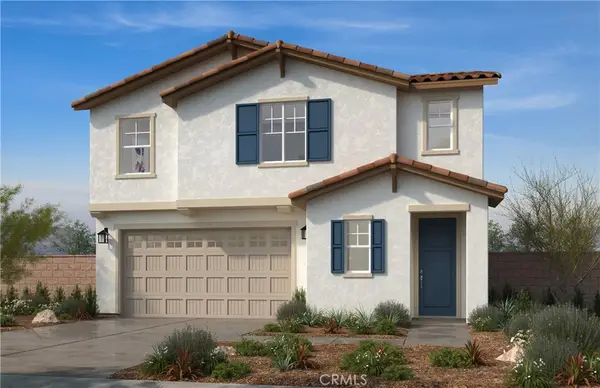 $789,148Active5 beds 4 baths2,613 sq. ft.
12838 Olympus Circle, Corona, CA 92883
MLS# SW26099553Listed by: KB HOME SALES-SOUTHERN CA INC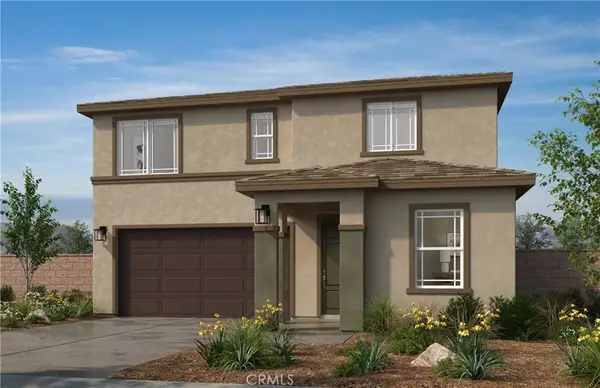 $756,442Active4 beds 3 baths2,283 sq. ft.
12826 Olympus Circle, Corona, CA 92883
MLS# SW26099572Listed by: KB HOME SALES-SOUTHERN CA INC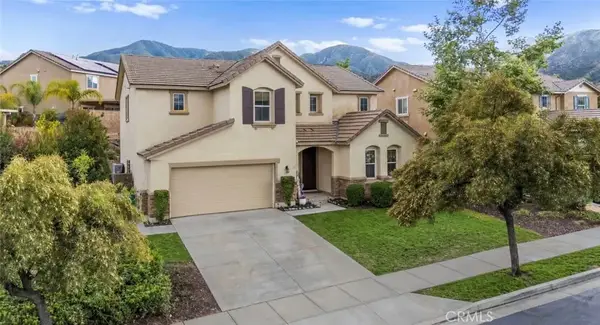 $839,000Active5 beds 3 baths2,738 sq. ft.
25444 Red Hawk Road, Corona, CA 92883
MLS# IG26095361Listed by: REALTY ONE GROUP WEST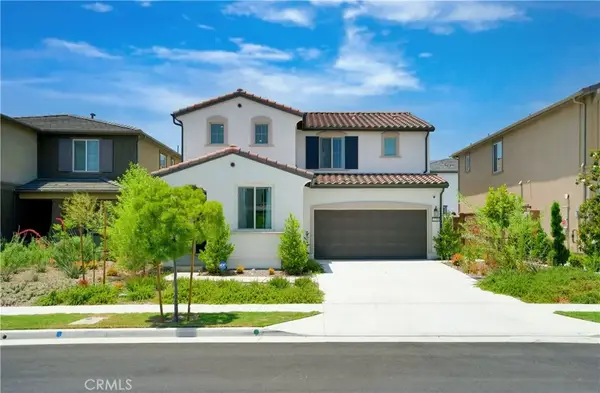 $915,000Active4 beds 3 baths2,464 sq. ft.
2239 Melogold Way, Corona, CA 92883
MLS# OC26098535Listed by: JC PACIFIC CORP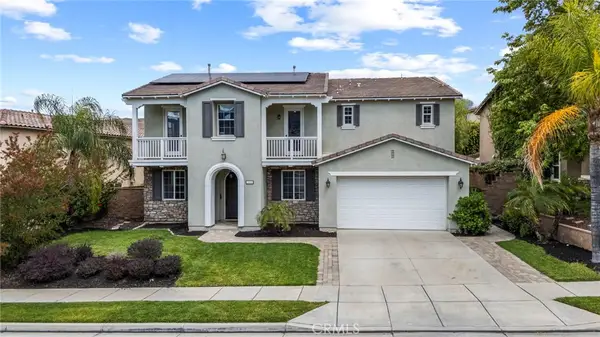 $899,000Active5 beds 4 baths3,683 sq. ft.
25614 Red Hawk Road, Corona, CA 92883
MLS# IG26095411Listed by: REALTY ONE GROUP WEST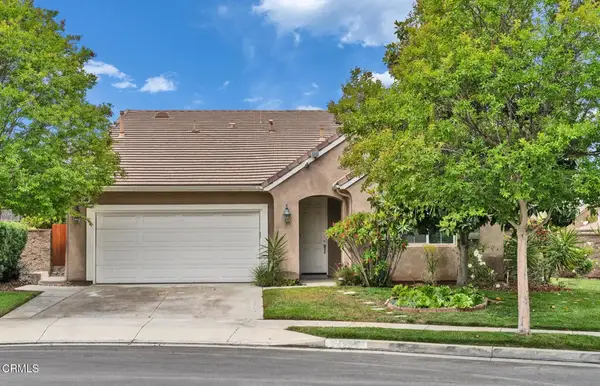 $926,000Active4 beds 4 baths3,087 sq. ft.
24889 Ashtree Court, Corona, CA 92883
MLS# P1-27006Listed by: KOBEISSI PROPERTIES $800,000Active4 beds 3 baths2,899 sq. ft.
23299 Lawson, Corona, CA 92883
MLS# PW26098212Listed by: REALTY PLUS $749,000Active4 beds 2 baths2,176 sq. ft.
27707 Blue Mesa, Corona, CA 92883
MLS# IG26097602Listed by: KELLER WILLIAMS REALTY $749,000Active2 beds 2 baths1,440 sq. ft.
12130 Margis, Corona, CA 92883
MLS# IG26097603Listed by: SOUTHWEST CALIFORNIA INC $730,000Active3 beds 4 baths1,987 sq. ft.
4247 Horvath #108, Corona, CA 92883
MLS# OC26096043Listed by: BULLOCK RUSSELL RE SERVICES $1,250,000Active0 Acres
8305 Gambier, Corona, CA 92883
MLS# PW26091163Listed by: WESTWIND REALTY $830,000Active4 beds 3 baths2,526 sq. ft.
24655 Acadia, Corona, CA 92883
MLS# SW26095701Listed by: TEAM FORSS REALTY GROUP $779,000Active4 beds 3 baths2,014 sq. ft.
9265 Nickellaus Court, Corona, CA 92883
MLS# PW26095606Listed by: LIFETIME REALTY INC $1,030,000Active6 beds 5 baths4,133 sq. ft.
11270 Guava, Corona, CA 92883
MLS# TR26095202Listed by: PINNACLE REAL ESTATE GROUP $574,999Active3 beds 3 baths1,549 sq. ft.
4260 Powell #110, Corona, CA 92883
MLS# OC26094312Listed by: WEST CAPITAL REAL ESTATE $738,000Active3 beds 3 baths2,017 sq. ft.
8847 Flintridge, Corona, CA 92883
MLS# IG26093804Listed by: ELEVATE REAL ESTATE AGENCY $788,000Active5 beds 3 baths2,860 sq. ft.
24777 Rockston Drive, Corona, CA 92883
MLS# P1-26904Listed by: C21 REALTY MASTERS $770,000Active3 beds 3 baths2,359 sq. ft.
22939 Zinnia, Corona, CA 92883
MLS# OC26093648Listed by: GOLD CLOVER REALTY $1,020,000Active6 beds 5 baths4,133 sq. ft.
26420 Plumcot Drive, Corona, CA 92883
MLS# 26827915Listed by: PREMIER PROPERTIES $620,000Active4 beds 2 baths1,245 sq. ft.
23078 Canyon Hills Drive, Corona, CA 92883
MLS# IV26093043Listed by: NEST REAL ESTATE $849,000Pending5 beds 5 baths3,484 sq. ft.
10973 Marygold Way, Corona, CA 92883
MLS# CV26092570Listed by: CURTIS CAPITAL CORPORATION $615,000Active3 beds 3 baths1,825 sq. ft.
4424 Owens Street #106, Corona, CA 92883
MLS# AR26088809Listed by: SUPREME INVESTMENT CORP. $625,000Active2 beds 2 baths1,290 sq. ft.
24445 Lupine Lane, Corona, CA 92883
MLS# IG26085481Listed by: BETTER HOMES OF SOUTHERN CALIFORNIA $899,000Pending2 beds 3 baths2,253 sq. ft.
24151 Whitetail, Corona, CA 92883
MLS# IG26087241Listed by: TRILOGY PROPERTIES $620,000Pending2 beds 2 baths1,758 sq. ft.
24001 Fawnskin Drive, Corona, CA 92883
MLS# IG26077922Listed by: TOP PRODUCERS REALTY, RYJEN GROUP $749,000Active3 beds 2 baths1,902 sq. ft.
11826 Arch Hill, Corona, CA 92883
MLS# NP26088295Listed by: RE/MAX ONE $749,000Active3 beds 2 baths1,902 sq. ft.
11826 Arch Hill, Corona, CA 92883
MLS# NP26088295Listed by: RE/MAX ONE $817,990Active3 beds 3 baths1,983 sq. ft.
11392 Forge Road, Corona, CA 92883
MLS# SW26088018Listed by: D R HORTON AMERICA'S BUILDER $859,000Active5 beds 3 baths3,893 sq. ft.
25072 Peppertree Court, Corona, CA 92883
MLS# IG26088151Listed by: RE/MAX PARTNERS $735,000Active3 beds 4 baths1,987 sq. ft.
4167 Horvath Street #108, Corona, CA 92883
MLS# PW26088827Listed by: J & C INVESTMENT GROUP, INC $1,165,000Active4 beds 5 baths3,793 sq. ft.
4431 Cabot Drive, Corona, CA 92883
MLS# PW26086386Listed by: SEVEN GABLES REAL ESTATE $749,900Active4 beds 2 baths2,283 sq. ft.
26305 Plumcot, Corona, CA 92883
MLS# SW26087076Listed by: LOCALIST REALTY $838,000Active4 beds 3 baths3,512 sq. ft.
24456 Wasatch Court, Corona, CA 92883
MLS# WS26086088Listed by: REAL BROKERAGE TECHNOLOGIES
 $709,888Active4 beds 3 baths1,948 sq. ft.
27283 Lasso Way, Corona, CA 92883
MLS# CV26086053Listed by: CENTURY 21 PRIMETIME REALTORS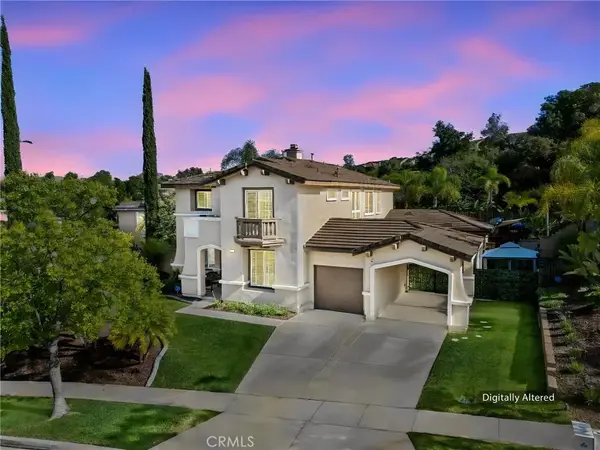 $1,225,000Active5 beds 4 baths3,197 sq. ft.
1744 Tamarron Dr, Corona, CA 92883
MLS# IG26083075Listed by: KELLER WILLIAMS REALTY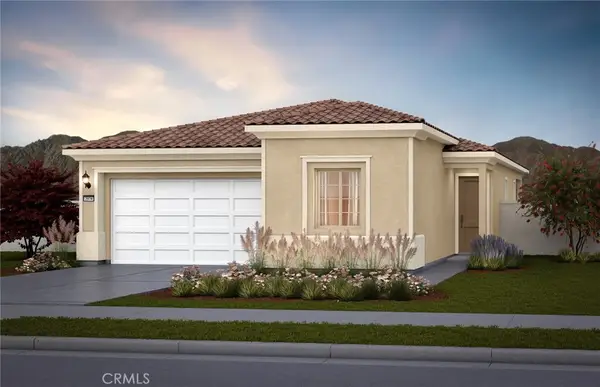 $588,285Pending2 beds 2 baths1,324 sq. ft.
11949 Hillsong Drive, Corona, CA 92883
MLS# IV26086154Listed by: PULTE HOMES OF CALIFORNIA, INC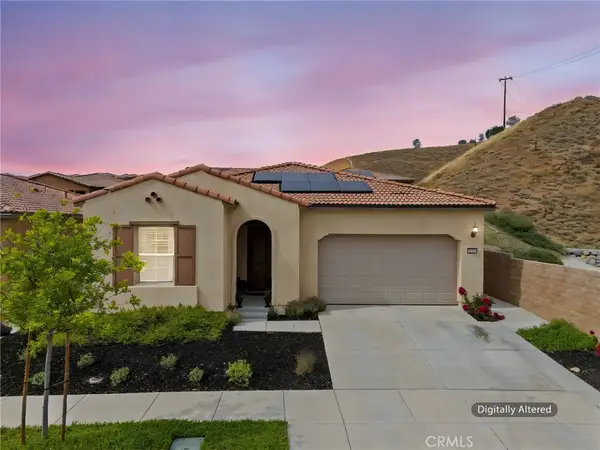 $699,000Active2 beds 2 baths1,758 sq. ft.
11976 Discovery Ct, Corona, CA 92883
MLS# IG26081078Listed by: KELLER WILLIAMS REALTY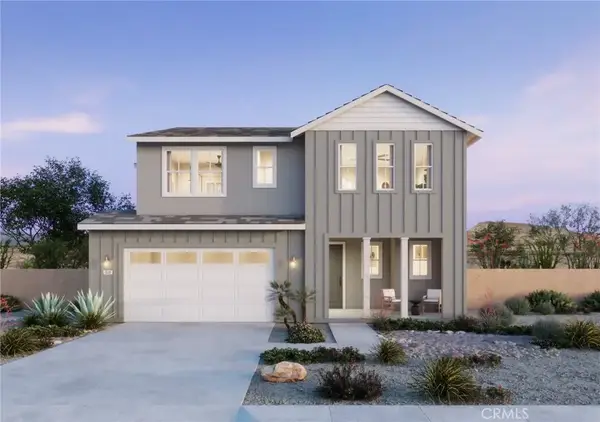 $845,905Active3 beds 3 baths2,679 sq. ft.
26117 Pepper Tree Ridge Road, Corona, CA 92883
MLS# OC26085461Listed by: TRUMARK CONSTRUCTION SERVICES INC $1,740,000Pending5 beds 6 baths5,307 sq. ft.
22260 Rosemary Canyon Court, Corona, CA 92883
MLS# IG26085449Listed by: CENTURY 21 MASTERS $710,000Active3 beds 3 baths1,560 sq. ft.
3956 Lavine Way #114 Street, Corona, CA 92883
MLS# IN26081861Listed by: REAL ESTATE SOURCE INC $1,695,000Active5 beds 5 baths4,743 sq. ft.
22470 Amber Eve, Corona, CA 92883
MLS# OC26081978Listed by: TEAM GAGE R E CENTER $549,000Active2 beds 2 baths1,909 sq. ft.
8756 Cuyamaca, Corona, CA 92883
MLS# PW26084217Listed by: REMAX TIFFANY REAL ESTATE $750,000Active4 beds 3 baths2,680 sq. ft.
11662 Starlily Court, Corona, CA 92883
MLS# IG26082804Listed by: KELLER WILLIAMS REALTY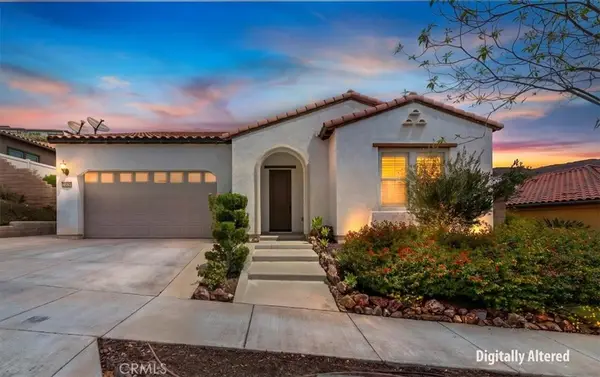 $700,000Active3 beds 2 baths1,993 sq. ft.
24636 Overlook Drive, Corona, CA 92883
MLS# IG26082799Listed by: KELLER WILLIAMS REALTY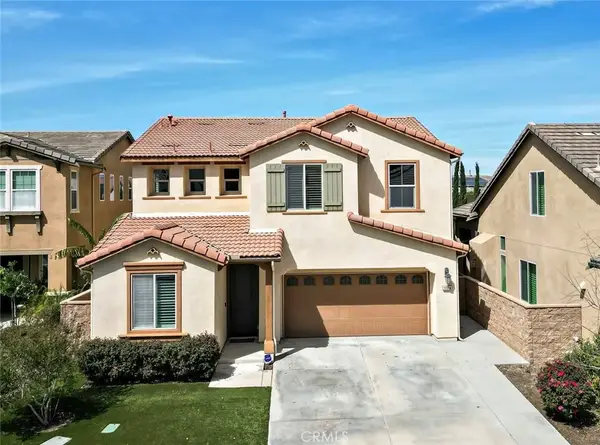 $759,900Active4 beds 3 baths2,444 sq. ft.
11514 Elderberry, Corona, CA 92883
MLS# OC26083349Listed by: SERHANT CALIFORNIA, INC $749,800Active4 beds 3 baths2,206 sq. ft.
4330 Altivo Lane, Corona, CA 92883
MLS# CV26082578Listed by: KW THE FOOTHILLS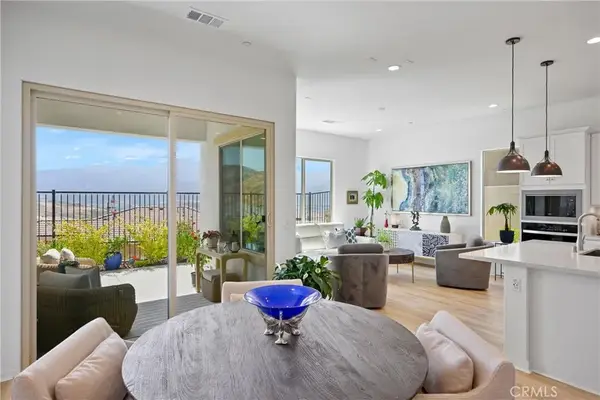 $699,000Active3 beds 2 baths1,364 sq. ft.
11967 Greenpeak Street, Corona, CA 92883
MLS# IG26073816Listed by: KELLER WILLIAMS REALTY $1,899,990Active0 Acres
0 Temescal Canyon Rd And Love Lane, Corona, CA 92883
MLS# PW26082759Listed by: TRUSS REALTY GROUP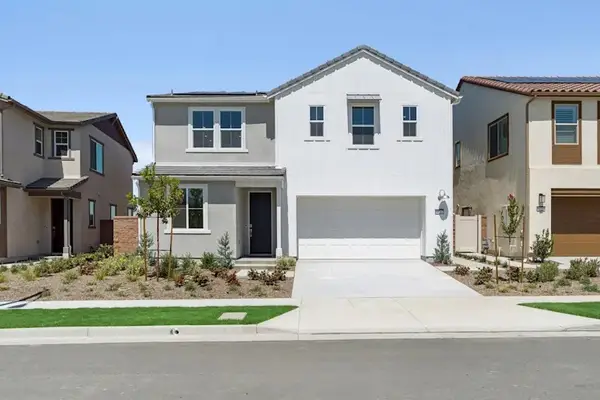 $1,029,555Pending4 beds 4 baths3,036 sq. ft.
3726 Crossen Drive, Corona, CA 92883
MLS# OC26082579Listed by: TRI POINTE HOMES, INC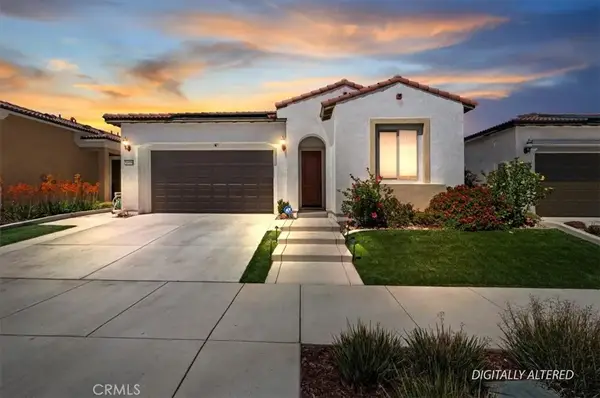 $599,000Active2 beds 2 baths1,364 sq. ft.
11930 Greenpeak Street, Corona, CA 92883
MLS# IG26080630Listed by: KELLER WILLIAMS REALTY $1,041,544Active5 beds 5 baths2,977 sq. ft.
3706 Leafgreen Road, Corona, CA 92883
MLS# IG26080953Listed by: RICHMOND AMERICAN HOMES $955,990Active3 beds 3 baths2,394 sq. ft.
3710 Leafgreen Road, Corona, CA 92883
MLS# IG26081134Listed by: RICHMOND AMERICAN HOMES $999,999Active4 beds 3 baths2,608 sq. ft.
4370 Leonard Way, Corona, CA 92883
MLS# IG26080161Listed by: FELIX PROPERTIES INC. $859,000Active5 beds 4 baths4,187 sq. ft.
25122 Cliffrose, Corona, CA 92883
MLS# WS26080713Listed by: PINNACLE REAL ESTATE GROUP $684,000Active4 beds 3 baths2,059 sq. ft.
24235 Juni Ct, Corona, CA 92883
MLS# OC26079747Listed by: KELLER WILLIAMS REALTY $585,000Pending3 beds 3 baths1,825 sq. ft.
4445 Owens Street #101, Corona, CA 92883
MLS# TR26079757Listed by: COLDWELL BANKER TRI-COUNTIES R $918,000Active4 beds 3 baths2,805 sq. ft.
4141 Adishian, Corona, CA 92883
MLS# PW26078775Listed by: WEICHERT, REALTORS-GLOBALPOINT $500,000Pending3 beds 2 baths1,392 sq. ft.
10412 Comstock, Corona, CA 92883
MLS# IG26079420Listed by: KELLER WILLIAMS REALTY $875,000Active4 beds 3 baths2,407 sq. ft.
26130 Plumcot Drive, Corona, CA 92883
MLS# IG26074322Listed by: OSCAR TORTOLA GROUP REAL ESTATE SERVICES $599,000Active3 beds 3 baths1,350 sq. ft.
4105 Cameron Way #103, Corona, CA 92883
MLS# 26697951Listed by: EXP REALTY OF GREATER LOS ANGELES $1,298,888Active3 beds 4 baths2,716 sq. ft.
11607 Explorer Court, Corona, CA 92883
MLS# IG26075245Listed by: FIV REALTY CO. $919,125Pending4 beds 4 baths2,617 sq. ft.
26170 Gentry Avenue, Corona, CA 92883
MLS# SW26076316Listed by: D R HORTON AMERICA'S BUILDER $699,999Active2 beds 2 baths1,758 sq. ft.
24590 Lowe, Corona, CA 92883
MLS# CV26074002Listed by: FIRST TEAM REAL ESTATE $874,999Active4 beds 3 baths2,210 sq. ft.
2303 Nova Way, Corona, CA 92883
MLS# PW26076123Listed by: BHHS CA PROPERTIES $675,000Active4 beds 3 baths1,948 sq. ft.
27295 Buffalo Trail, Corona, CA 92883
MLS# PW26076048Listed by: ARCHULETA REALTY $695,000Pending3 beds 3 baths1,798 sq. ft.
13578 Dalton Drive, Corona, CA 92883
MLS# IG26072194Listed by: KELLER WILLIAMS REALTY $695,000Pending3 beds 3 baths1,798 sq. ft.
13578 Dalton Drive, Corona, CA 92883
MLS# IG26072194Listed by: KELLER WILLIAMS REALTY $848,000Active3 beds 2 baths1,946 sq. ft.
2336 Bearrs, Corona, CA 92883
MLS# IV26074357Listed by: LETSO REALTY $1,998,000Active5 beds 6 baths5,307 sq. ft.
8128 Tender Way, Corona, CA 92883
MLS# IG26073185Listed by: OSCAR TORTOLA GROUP REAL ESTATE SERVICES $856,990Active5 beds 3 baths2,537 sq. ft.
11416 Forge Road, Corona, CA 92883
MLS# SW26073848Listed by: D R HORTON AMERICA'S BUILDER $1,250,000Active4 beds -- baths
11111 Spanish Hills, Corona, CA 92883
MLS# OC26094027Listed by: REGENCY REAL ESTATE BROKERS $1,250,000Active4 beds 4 baths3,415 sq. ft.
11111 Spanish Hills, Corona, CA 92883
MLS# OC26072997Listed by: REGENCY REAL ESTATE BROKERS $715,000Pending3 beds 3 baths1,763 sq. ft.
4057 Spring Haven Ln, Corona, CA 92883
MLS# MB26072810Listed by: APEX REALTY & INVESTMENTS $769,999Active4 beds 3 baths2,800 sq. ft.
24258 Flora, Corona, CA 92883
MLS# OC26056929Listed by: REALTY ONE GROUP WEST $799,990Active3 beds 2 baths1,526 sq. ft.
3714 Leafgreen Road, Corona, CA 92883
MLS# IG26073174Listed by: RICHMOND AMERICAN HOMES $1,998,000Active5 beds 6 baths5,307 sq. ft.
8128 Tender Way, Corona, CA 92883
MLS# IG26073185Listed by: OSCAR TORTOLA GROUP REAL ESTATE SERVICES $738,900Active2 beds 2 baths1,746 sq. ft.
11882 Wandering Way, Corona, CA 92883
MLS# PW26072947Listed by: T.N.G. REAL ESTATE CONSULTANTS $635,000Active3 beds 2 baths1,281 sq. ft.
13268 Prairestone, Corona, CA 92883
MLS# TR26072549Listed by: KELLER WILLIAMS EMPIRE ESTATES $608,990Pending3 beds 3 baths1,409 sq. ft.
3925 Lavine Way #103, Corona, CA 92883
MLS# IG26063219Listed by: COMPASS $709,000Active4 beds 3 baths1,748 sq. ft.
27199 Echo Canyon Court, Corona, CA 92883
MLS# CV26071701Listed by: JOSEPH MIRAFLOR, BROKER $749,000Active3 beds 2 baths1,926 sq. ft.
22810 Mountain Ash Circle, Corona, CA 92883
MLS# TR26071458Listed by: UNIVERSAL ELITE INC. $749,000Active3 beds 2 baths1,926 sq. ft.
22810 Mountain Ash Circle, Corona, CA 92883
MLS# TR26071458Listed by: UNIVERSAL ELITE INC. $779,000Active3 beds 3 baths2,305 sq. ft.
11612 Alton Drive, Corona, CA 92883
MLS# PW26070360Listed by: BHHS CA PROPERTIES $1,600,000Active4.8 Acres
11085 Canyon Circle, Corona, CA 92883
MLS# NP26070257Listed by: LORA VANCE, REALTOR $1,299,900Active4 beds 3 baths3,333 sq. ft.
8851 Soothing Court, Corona, CA 92883
MLS# IG26069666Listed by: KELLER WILLIAMS REALTY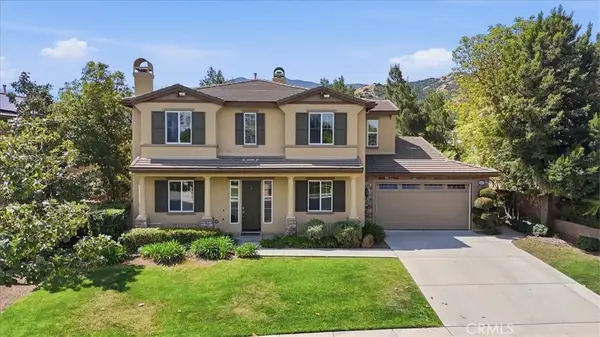 $1,399,000Active4 beds 5 baths4,152 sq. ft.
8651 Edelweiss, Corona, CA 92883
MLS# IG26057162Listed by: SIGNATURE SALES & MANAGEMENT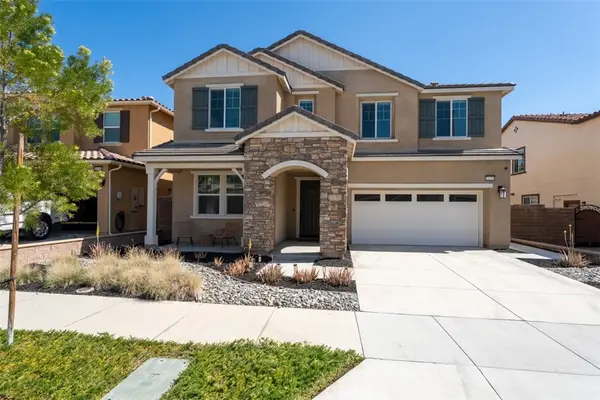 $769,999Active4 beds 3 baths2,800 sq. ft.
24258 Flora, Corona, CA 92883
MLS# OC26056929Listed by: REALTY ONE GROUP WEST $849,000Active4 beds 3 baths2,800 sq. ft.
11298 Finders Court, Corona, CA 92883
MLS# OC26069515Listed by: RE/MAX ONE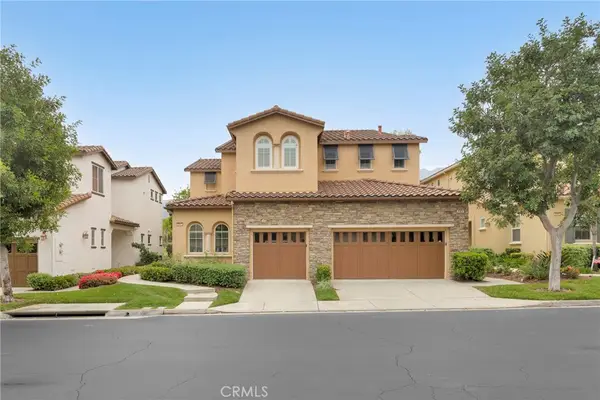 $549,000Active2 beds 2 baths1,404 sq. ft.
8963 Cuyamaca, Corona, CA 92883
MLS# IG26064043Listed by: VISTA PACIFIC REALTY $589,000Active3 beds 3 baths1,775 sq. ft.
4468 Owens #103, Corona, CA 92883
MLS# IG26066171Listed by: KELLER WILLIAMS REALTY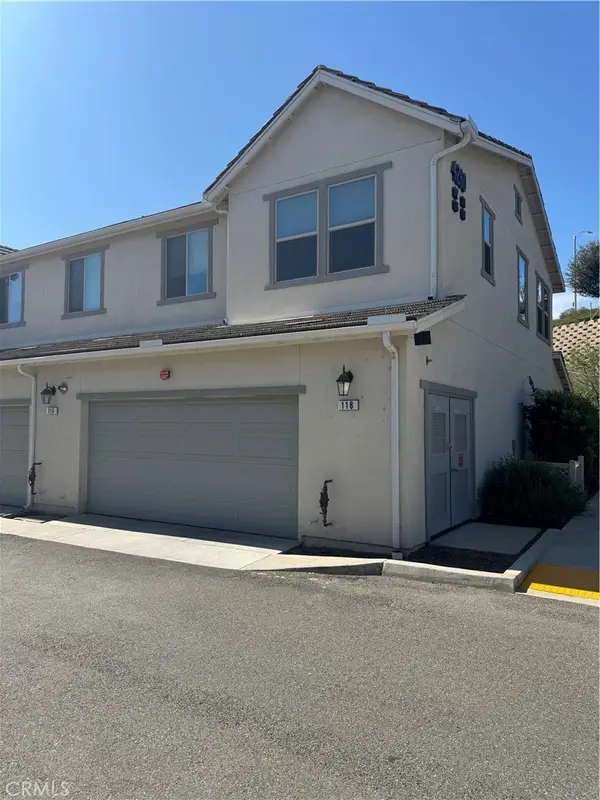 $625,000Active3 beds 3 baths1,549 sq. ft.
4260 Powell Way #118, Corona, CA 92883
MLS# WS26069497Listed by: SUNSHINE INTERNATIONAL INV., INC.- Open Mon, 4 to 5pm
 $1,149,000Active5 beds 3 baths2,949 sq. ft.
1916 Olympia Fields, Corona, CA 92883
MLS# OC26068888Listed by: REAL BROKER  $649,999Active4 beds 3 baths2,014 sq. ft.
24085 Midvale Court, Corona, CA 92883
MLS# IG26042829Listed by: FIV REALTY CO. $889,990Pending5 beds 3 baths2,537 sq. ft.
11440 Forge Road, Corona, CA 92883
MLS# SW26068449Listed by: D R HORTON AMERICA'S BUILDER $1,475,000Active5 beds 5 baths4,743 sq. ft.
8622 Edelweiss, Corona, CA 92883
MLS# DW26067270Listed by: EHOMES $925,000Active4 beds 3 baths3,114 sq. ft.
4101 Adishian Way, Corona, CA 92883
MLS# 26671077Listed by: SEEDERS REAL ESTATE $1,495,000Pending3 beds 3 baths3,000 sq. ft.
9330 Gum Tree, Corona, CA 92883
MLS# SW26067485Listed by: KING REALTY $804,990Pending3 beds 3 baths1,983 sq. ft.
11452 Forge Road, Corona, CA 92883
MLS# SW26067284Listed by: D R HORTON AMERICA'S BUILDER $599,900Active2 beds 2 baths1,501 sq. ft.
24479 Chamois, Corona, CA 92883
MLS# IG26067140Listed by: GOLD REAL ESTATE $899,000Active4 beds 3 baths2,344 sq. ft.
1832 Couples, Corona, CA 92883
MLS# PW26046394Listed by: PARTNERS REAL ESTATE GROUP $525,000Active3 beds 2 baths1,670 sq. ft.
10220 Wrangler Way, Corona, CA 92883
MLS# OC26059936Listed by: COMPASS $560,000Active2 beds 2 baths1,404 sq. ft.
23799 Cahuilla Court, Corona, CA 92883
MLS# IG26064103Listed by: REALTY ONE GROUP WEST $712,000Active4 beds 3 baths1,948 sq. ft.
27364 Pacos Ridge, Corona, CA 92883
MLS# IG26058699Listed by: KELLER WILLIAMS REALTY $949,900Active5 beds 5 baths3,681 sq. ft.
26261 Santiago Canyon, Corona, CA 92883
MLS# PW26062437Listed by: GOETTSCHE REAL ESTATE $729,500Pending3 beds 2 baths1,888 sq. ft.
9192 Reserve Drive, Corona, CA 92883
MLS# PW26058115Listed by: C & M REAL ESTATE SERVICES $799,999Active3 beds 2 baths2,320 sq. ft.
11101 Spanish Hills Dr, Corona, CA 92883
MLS# OC26060909Listed by: FATHOM REALTY GROUP INC. $1,425,000Active5 beds 5 baths4,136 sq. ft.
4351 Edenwild, Corona, CA 92883
MLS# IG26058609Listed by: KELLER WILLIAMS REALTY $1,150,000Pending4 beds 3 baths3,351 sq. ft.
1728 Tamarron, Corona, CA 92883
MLS# IG26058794Listed by: CENTURY 21 MASTERS $1,399,000Active4 beds 5 baths4,152 sq. ft.
8651 Edelweiss, Corona, CA 92883
MLS# IG26057162Listed by: SIGNATURE SALES & MANAGEMENT $630,000Pending3 beds 2 baths1,320 sq. ft.
13390 Cloudburst Drive, Corona, CA 92883
MLS# IG26057721Listed by: TOWN & COUNTRY REAL ESTATE $1,249,000Active4 beds 3 baths3,578 sq. ft.
1749 Tamarron Drive, Corona, CA 92883
MLS# IG26056160Listed by: NEW STAR REALTY $899,999Active4 beds 3 baths2,676 sq. ft.
3950 Satsuma, Corona, CA 92883
MLS# IG26054468Listed by: RE/MAX PARTNERS $749,000Active5 beds 3 baths2,496 sq. ft.
13333 Goldenhorn Drive, Corona, CA 92570
MLS# CV26055057Listed by: CH INVESTMENT GROUP, INC. $977,000Active4 beds 4 baths2,836 sq. ft.
2227 Melogold Way, Corona, CA 92883
MLS# SW26054140Listed by: EXP REALTY OF SOUTHERN CALIFORNIA, INC. $629,888Active3 beds 2 baths1,141 sq. ft.
27551 Eastwind Drive, Corona, CA 92883
MLS# IV26053056Listed by: EINSTEIN REALTY $639,880Active3 beds 2 baths1,227 sq. ft.
9290 Hot Springs, Corona, CA 92883
MLS# IG26111338Listed by: RE/MAX TOP PRODUCERS $2,500,000Active5 beds 5 baths3,028 sq. ft.
9050 Hunt Road, Corona, CA 92883
MLS# OC26054034Listed by: BLUE PACIFIC PROPERTY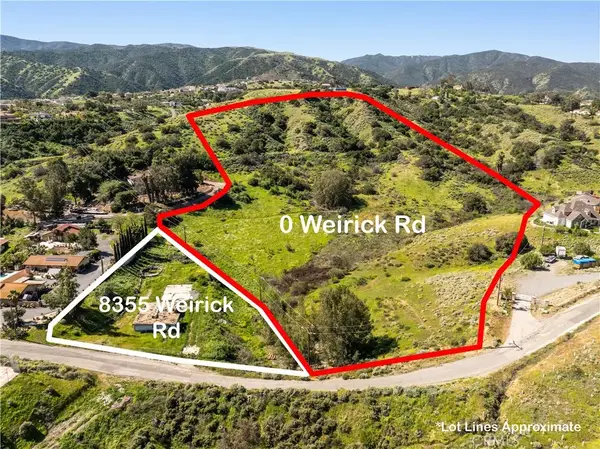 $399,900Active0 Acres
8355 Weirick, Corona, CA 92883
MLS# OC26053290Listed by: REALTY ONE GROUP WEST $599,900Active0 Acres
0 Weirick Rd, Corona, CA 92883
MLS# OC26053303Listed by: REALTY ONE GROUP WEST $839,900Active2 beds 3 baths2,253 sq. ft.
9328 Holly Lane, Corona, CA 92883
MLS# IG26052658Listed by: REALTY ONE GROUP WEST $1,000,000Active4 beds 5 baths3,517 sq. ft.
7543 Summer Day Drive, Corona, CA 92883
MLS# IV26052765Listed by: REDFIN $1,249,999Active5 beds 4 baths3,446 sq. ft.
4219 Floyd, Corona, CA 92883
MLS# PW26051047Listed by: FIRST TEAM REAL ESTATE $1,175,000Active4 beds 5 baths3,538 sq. ft.
7921 Summer Day, Corona, CA 92883
MLS# IG26050723Listed by: KELLER WILLIAMS REALTY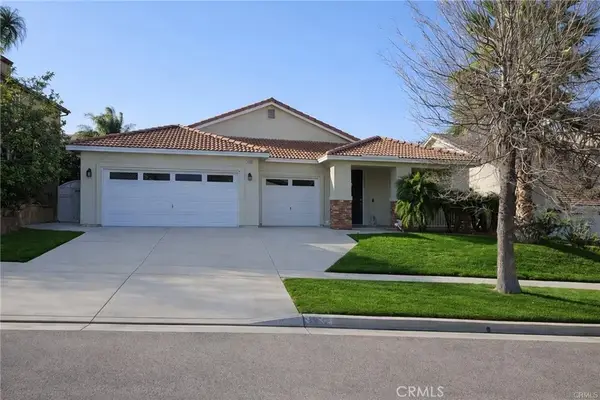 $890,000Active4 beds 2 baths2,138 sq. ft.
4132 Crooked Stick, Corona, CA 92883
MLS# IG26049183Listed by: KELLER WILLIAMS REALTY $539,990Active4 beds 3 baths2,145 sq. ft.
28378 Deer Brush, Nuevo, CA 92567
MLS# NP26048271Listed by: EHOMES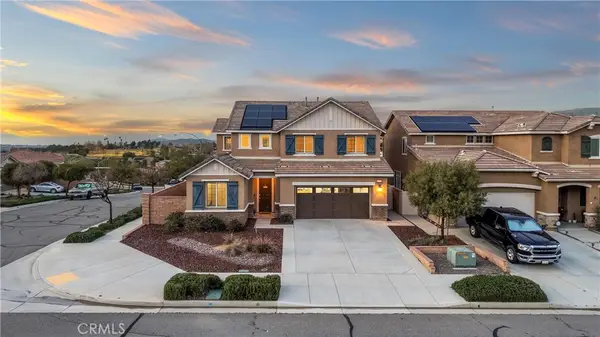 $874,900Active4 beds 3 baths2,411 sq. ft.
11276 Guffey Ranch, Corona, CA 92883
MLS# OC26043717Listed by: CENTURY 21 AFFILIATED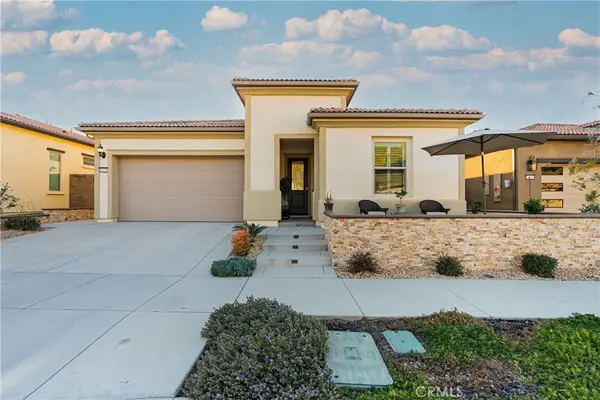 $799,889Pending3 beds 2 baths1,902 sq. ft.
24159 Evesong, Corona, CA 92883
MLS# SW26046675Listed by: RELIABLE REALTY INC. $649,988Active3 beds 3 baths2,001 sq. ft.
11774 Glenridge Rd, Corona, CA 92883
MLS# OC26047296Listed by: WEST CAPITAL REAL ESTATE $729,900Active4 beds 3 baths2,233 sq. ft.
9124 Camphor Tree Court, Corona, CA 92883
MLS# OC26046434Listed by: COMMUNITY PARTNERS REALTY, INC. $914,990Pending4 beds 4 baths2,617 sq. ft.
26194 Gentry Avenue, Corona, CA 92883
MLS# SW26043140Listed by: D R HORTON AMERICA'S BUILDER $1,665,888Active5 beds 6 baths5,307 sq. ft.
8120 Sunset Rose Drive, Corona, CA 92883
MLS# OC26043360Listed by: THE OPPENHEIM GROUP $1,139,000Active5 beds 3 baths3,188 sq. ft.
1806 Riverstone, Corona, CA 92883
MLS# OC26042462Listed by: REDFIN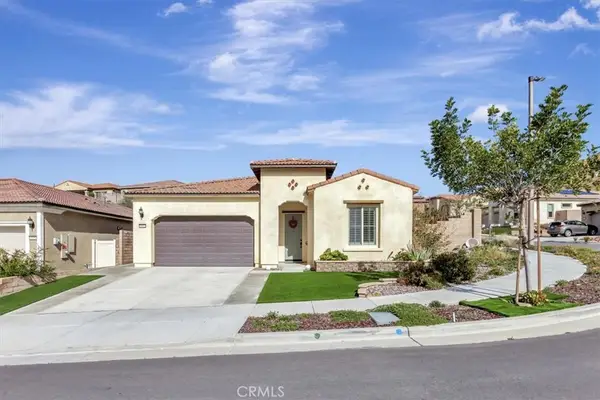 $700,000Active2 beds 2 baths1,740 sq. ft.
11972 Wandering, Corona, CA 92883
MLS# OC26042266Listed by: REGENCY REAL ESTATE BROKERS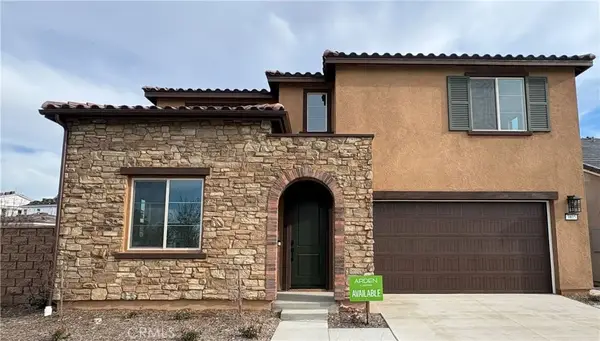 $1,045,005Pending5 beds 5 baths2,977 sq. ft.
3805 Leafgreen Road, Corona, CA 92883
MLS# IG26041484Listed by: RICHMOND AMERICAN HOMES $1,075,000Active5 beds 4 baths3,629 sq. ft.
8550 Hunt Canyon Road, Corona, CA 92883
MLS# CV26033780Listed by: RE/MAX MASTERS REALTY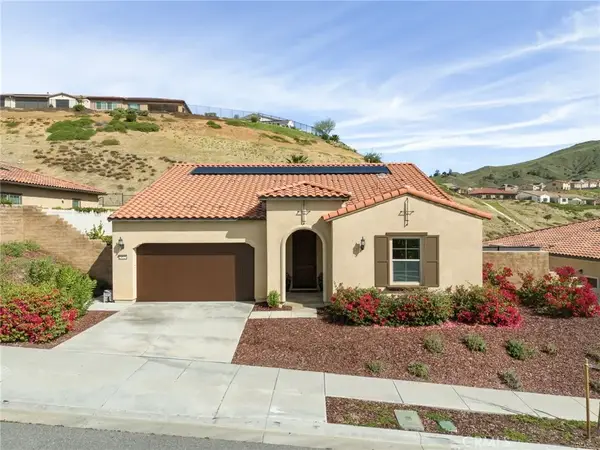 $819,000Active3 beds 2 baths2,061 sq. ft.
24528 Crestley Drive, Corona, CA 92883
MLS# IG26039770Listed by: FIV REALTY CO. $674,900Active4 beds 3 baths2,068 sq. ft.
24569 Sonieta Court, Corona, CA 92883
MLS# 219143698DAListed by: DESERT SANDS REALTY $560,000Active3 beds 3 baths1,775 sq. ft.
4445 Owens, Corona, CA 92883
MLS# IG26039865Listed by: OMAR AYOUB, BROKER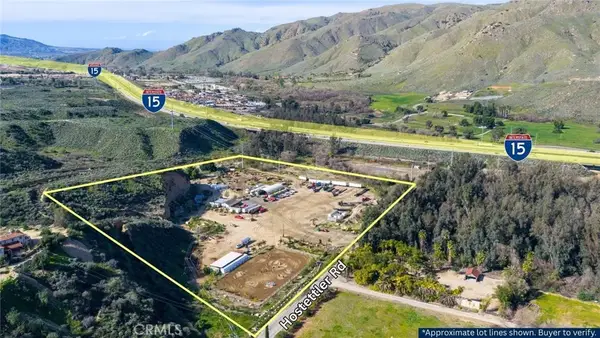 $3,500,000Active0 Acres
26741 Hostettler, Corona, CA 92883
MLS# IG26037619Listed by: RE/MAX TIME REALTY $749,000Active2 beds 2 baths2,017 sq. ft.
24067 Brison Drive, Corona, CA 92883
MLS# PTP2601287Listed by: KELLER WILLIAMS LA JOLLA $935,000Active5 beds 3 baths3,417 sq. ft.
26407 Towhee Lane, Corona, CA 92883
MLS# OC26035896Listed by: HOMESMART, EVERGREEN REALTY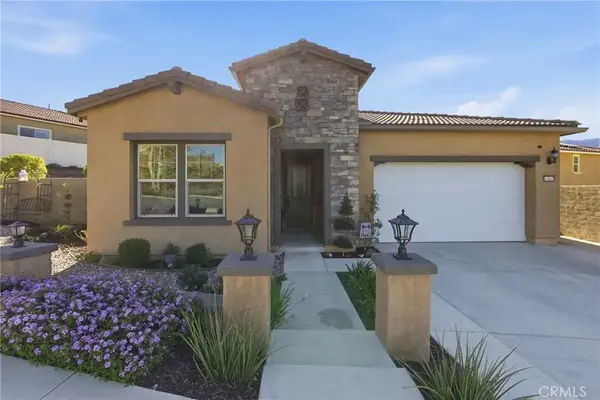 $729,000Active2 beds 2 baths1,746 sq. ft.
11863 Trailwood Ct, Corona, CA 92883
MLS# CV26032190Listed by: J. A. MILLER & ASSOCIATES $754,900Active4 beds 3 baths2,305 sq. ft.
24848 Rockston, Corona, CA 92883
MLS# CV26034507Listed by: JOSEPH MIRAFLOR, BROKER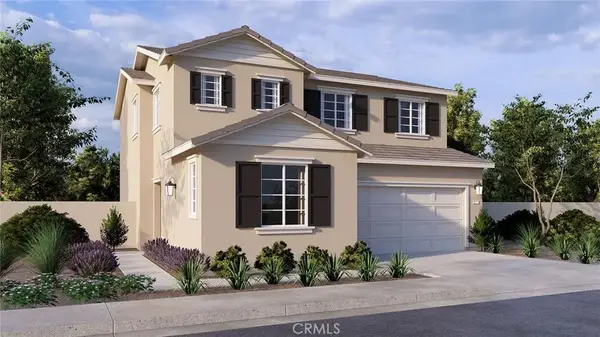 $804,990Pending4 beds 3 baths2,079 sq. ft.
11428 Forge Road, Corona, CA 92883
MLS# SW26034269Listed by: D R HORTON AMERICA'S BUILDER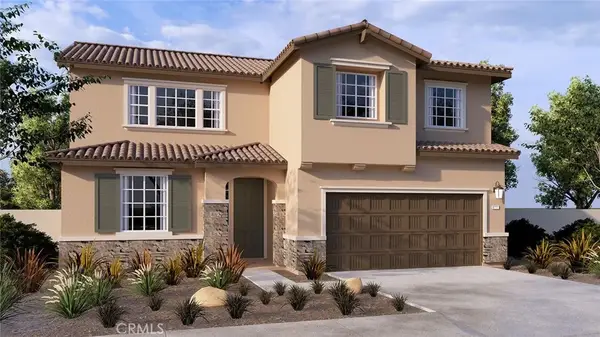 $919,990Pending5 beds 3 baths2,537 sq. ft.
26158 Gentry Avenue, Corona, CA 92883
MLS# SW26034284Listed by: D R HORTON AMERICA'S BUILDER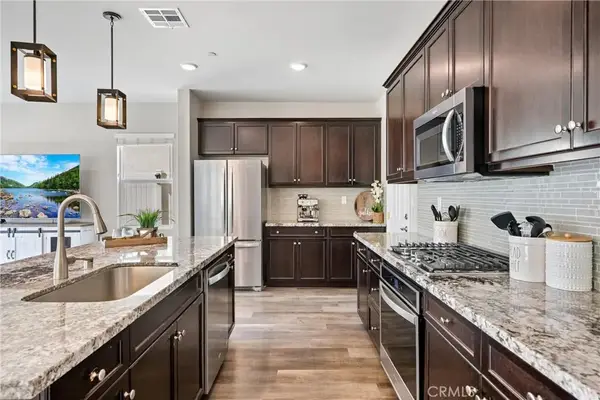 $774,900Active3 beds 3 baths2,427 sq. ft.
24572 Acadia Drive, Corona, CA 92883
MLS# IG26025800Listed by: KELLER WILLIAMS REALTY $888,000Pending4 beds 3 baths2,608 sq. ft.
4375 Leonard Way, Corona, CA 92883
MLS# CV26029337Listed by: EXP REALTY OF GREATER LOS ANGELES $489,000Pending2 beds 3 baths1,638 sq. ft.
4460 Owens Street #105, Corona, CA 92883
MLS# PW26029593Listed by: 1VISION REAL ESTATE $829,000Pending4 beds 3 baths1,931 sq. ft.
23798 Solaris Court, Corona, CA 92883
MLS# CV26025575Listed by: DAVID BOGLE, BROKER $595,000Active3 beds 2 baths1,539 sq. ft.
4078 Summer Way, Corona, CA 92883
MLS# IG26023245Listed by: KELLER WILLIAMS REALTY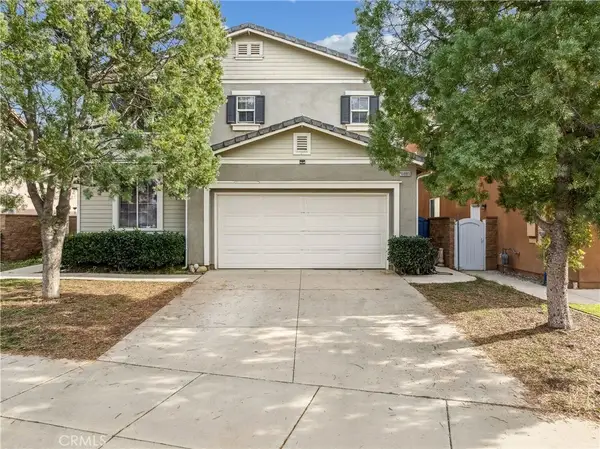 $825,000Active6 beds 5 baths3,495 sq. ft.
10889 Cameron Court, Corona, CA 92883
MLS# CV26016718Listed by: KELLER WILLIAMS EMPIRE ESTATES $899,000Active4 beds 4 baths2,860 sq. ft.
11727 Coriander Way, Corona, CA 92883
MLS# 260002407Listed by: HOMESMART REALTY WEST $1,350,000Active4 beds 3 baths3,731 sq. ft.
1758 Par Four, Corona, CA 92883
MLS# PW26018708Listed by: ML MANAGEMENT GROUP, INC. $854,990Pending4 beds 4 baths2,617 sq. ft.
26187 Gentry Avenue, Corona, CA 92883
MLS# SW26017649Listed by: D R HORTON AMERICA'S BUILDER $619,000Active3 beds 3 baths1,825 sq. ft.
4457 Owens Street #101, Corona, CA 92883
MLS# PW25279285Listed by: CENTURY 21 ALLSTARS $565,000Active3 beds 3 baths1,402 sq. ft.
3934 Lavine #108, Corona, CA 92883
MLS# PW26015774Listed by: EXP REALTY OF CALIFORNIA INC $629,900Active3 beds 2 baths1,539 sq. ft.
4067 Summer, Corona, CA 92883
MLS# PW26013705Listed by: WIN WIN REALTY $677,000Active4 beds 3 baths1,748 sq. ft.
13190 Lone Stallion Lane, Corona, CA 92883
MLS# PW26012928Listed by: RE/MAX NEW DIMENSION $839,000Active2 beds 3 baths2,253 sq. ft.
23984 Four Corners Court, Corona, CA 92883
MLS# IG26007342Listed by: ELEVATE REAL ESTATE AGENCY $625,000Active4 beds 2 baths1,245 sq. ft.
23191 Canyon Estates, Corona, CA 92883
MLS# IG25282311Listed by: CENTURY 21 MASTERS $1,299,999Active5 beds 4 baths3,676 sq. ft.
8824 Soothing Court, Corona, CA 92883
MLS# IG26005482Listed by: NAVIGATE REAL ESTATE, INC. $907,990Active3 beds 3 baths2,394 sq. ft.
3718 Leafgreen Road, Corona, CA 92883
MLS# IG26003708Listed by: RICHMOND AMERICAN HOMES $1,630,000Active5 beds 6 baths5,409 sq. ft.
21892 Thimbleberry Court, Corona, CA 92883
MLS# TR25267611Listed by: IRN REALTY $799,000Active5 beds 5 baths3,086 sq. ft.
25465 Hyacinth, Corona, CA 92883
MLS# TR26002541Listed by: PINNACLE REAL ESTATE GROUP $724,900Active3 beds 2 baths2,283 sq. ft.
11065 Quince Court, Corona, CA 92883
MLS# SW25281898Listed by: KELLER WILLIAMS EMPIRE ESTATES $749,000Active2 beds 2 baths1,902 sq. ft.
11885 Discovery Ct, Corona, CA 92883
MLS# 250046102Listed by: REAL BROKER $749,000Active4 beds 3 baths1,782 sq. ft.
4037 Summer Way, Corona, CA 92883
MLS# IV25279299Listed by: COMPASS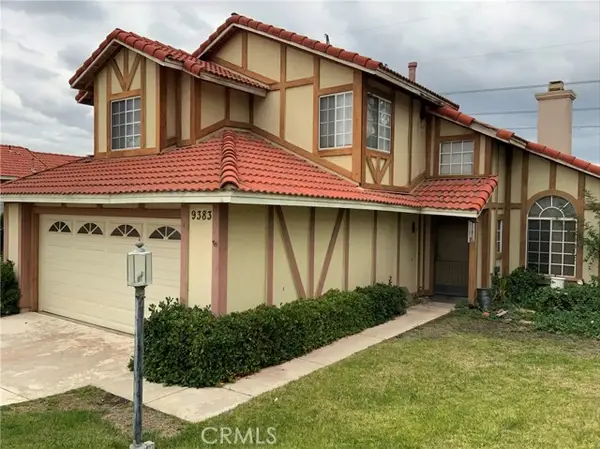 $565,000Pending3 beds 3 baths1,450 sq. ft.
9383 Stone Canyon Road, Corona, CA 92883
MLS# CRCV25279187Listed by: EXP REALTY OF GREATER LOS ANGELES $1,050,000Pending4 beds 3 baths3,878 sq. ft.
22385 Hayworth Court, Corona, CA 92883
MLS# PW25277838Listed by: REAL BROKER $950,000Active4 beds 3 baths3,386 sq. ft.
8863 Soothing Court, Corona, CA 92883
MLS# IG25274859Listed by: TOP PRODUCERS REALTY, RYJEN GROUP $9,999Active0 Acres
0 Cajalco, Corona, CA 92570
MLS# PW25273681Listed by: PRIMARY PARTNERS $1,268,950Active4 beds 5 baths4,142 sq. ft.
7725 Lady Banks, Corona, CA 92883
MLS# OC25264833Listed by: TEAM GAGE R E CENTER $749,000Active4 beds 4 baths2,587 sq. ft.
24892 Pine Mountain Terrace, Corona, CA 92883
MLS# PW25258537Listed by: JASON MITCHELL REAL ESTATE CALIFORNIA, INC. $899,999Active2 beds 2 baths1,902 sq. ft.
11986 Sagecrest Court, Corona, CA 92883
MLS# OC26099437Listed by: RE/MAX TERRASOL $1,574,950Active5 beds 6 baths5,307 sq. ft.
22407 Leisure, Corona, CA 92883
MLS# OC25257545Listed by: TEAM GAGE R E CENTER $649,000Pending2 beds 2 baths1,552 sq. ft.
23931 Augusta, Corona, CA 92883
MLS# SW25253798Listed by: CENTURY 21 MASTERS $649,900Active3 beds 3 baths2,010 sq. ft.
24218 Hillcrest, Corona, CA 92883
MLS# PW26049275Listed by: NEW STAR REALTY & INVESTMENT $665,000Active2 beds 2 baths1,671 sq. ft.
24005 Boulder Oaks, Corona, CA 92883
MLS# IG25251801Listed by: REALTY ONE GROUP WEST $575,000Pending4 beds 4 baths1,600 sq. ft.
12011 Dawson Canyon, Corona, CA 92883
MLS# IG25249514Listed by: REALTY WORLD MAIN STREET $1,549,000Active4 beds 5 baths5,342 sq. ft.
8287 Soft Winds, Corona, CA 92883
MLS# OC25245828Listed by: PINNACLE REAL ESTATE GROUP $709,000Pending4 beds 3 baths3,089 sq. ft.
13556 Silver Stirrup, Corona, CA 92883
MLS# IV26014723Listed by: CALIFORNIA REALTY GROUP INC. $583,990Pending2 beds 3 baths1,375 sq. ft.
23662 Highvale Drive, Corona, CA 92883
MLS# IV25240118Listed by: PULTE HOMES OF CALIFORNIA, INC $549,990Active2 beds 2 baths1,324 sq. ft.
23686 Highvale Drive, Corona, CA 92883
MLS# IV25240140Listed by: PULTE HOMES OF CALIFORNIA, INC $583,990Pending2 beds 3 baths1,375 sq. ft.
23662 Highvale Drive, Corona, CA 92883
MLS# IV25240118Listed by: PULTE HOMES OF CALIFORNIA, INC $624,990Active3 beds 3 baths1,303 sq. ft.
3942 Lavine, Corona, CA 92883
MLS# IG25239063Listed by: DRA FINANCIAL $12,000,000Active0 Acres
0 Temescal Canyon R., Temescal Valley, CA 92883
MLS# IV25234647Listed by: DAUM COMMERCIAL RE SERVICES $791,320Pending5 beds 3 baths2,874 sq. ft.
27234 Denali Court, Corona, CA 92883
MLS# IV25234185Listed by: KB HOME $12,000,000Active14.5 Acres
0 Temescal Canyon R., Temescal Valley, CA 92883
MLS# IV25234647Listed by: DAUM COMMERCIAL RE SERVICES $799,000Active0 Acres
0 Knob Hill/weirick, Corona, CA 92883
MLS# IG25194462Listed by: KELLER WILLIAMS REALTY $660,000Active4 beds 3 baths1,748 sq. ft.
27381 Echo Canyon Court, Corona, CA 92883
MLS# PW25208351Listed by: RE/MAX NEW DIMENSION $600,000Pending3 beds 3 baths1,439 sq. ft.
13374 Crystal Springs Drive, Corona, CA 92883
MLS# CRPW25195431Listed by: FIRST TEAM REAL ESTATE $479,900Pending2 beds 3 baths1,638 sq. ft.
4456 Owens Street #102, Corona, CA 92883
MLS# IG25198681Listed by: REAL BROKERAGE TECHNOLOGIES $691,990Pending4 beds 2 baths2,026 sq. ft.
12767 Olympus Circle, Corona, CA 92883
MLS# IV25180081Listed by: KB HOME- Open Sat, 1 to 4pm
 $750,000Active3 beds 3 baths2,012 sq. ft.
4032 Spring Haven, Corona, CA 92883
MLS# OC26035845Listed by: COLDWELL BANKER REALTY  $585,000Pending5 beds 4 baths3,300 sq. ft.
25694 Red Hawk Road, Corona, CA 92883
MLS# IG19283037Listed by: REALTY ONE GROUP WEST $474,900Pending4 beds 2 baths2,176 sq. ft.
13946 Moqui Way, Corona, CA 92883
MLS# IG20012349Listed by: HOME STAR REAL ESTATE $550,880Pending2 beds 3 baths1,640 sq. ft.
4436 Owens #105, Corona, CA 92883
MLS# PW25097659Listed by: RE/MAX TERRASOL $1,050,000Active4 beds 3 baths2,300 sq. ft.
21655 Temescal Canyon, Corona, CA 92883
MLS# DW26065525Listed by: FIRST CLASS PLATINUM BROKERS $959,990Active5 beds 4 baths2,977 sq. ft.
2933 Bridgetide Road, Corona, CA 92883
MLS# IG25034772Listed by: RICHMOND AMERICAN HOMES $12,500Active0 Acres
0 Court, Thermal, CA 92274
MLS# IV25001658Listed by: EXP REALTY OF CALIFORNIA INC $730,000Active0 Acres
0 N Weirick Rd, Corona, CA 92883
MLS# IG24255370Listed by: KELLER WILLIAMS REALTY $799,000Pending5 beds 3 baths2,611 sq. ft.
8956 Sunshine Valley Way, Corona, CA 92883
MLS# CRPW23204178Listed by: NEW STAR REALTY & INVESTMENT $559,958Pending3 beds 3 baths2,359 sq. ft.
22911 Elk Grass Street, Corona, CA 92883
MLS# IG21000700Listed by: PREMIER REALTY & CONSULTING $899,000Pending4 beds 3 baths2,750 sq. ft.
12435 Beardsley, Corona, CA 92883
MLS# 81024900Listed by: HOME OPTIONS REAL ESTATE, INC.
Local realty services provided by:CENTURY 21 Century Real Estate, CENTURY 21 Affiliated, CENTURY 21 Sierra Properties
The information being provided by California Regional MLS (Southern California) is for the consumer's personal, non-commercial use and may not be used for any purpose other than to identify prospective properties consumer may be interested in purchasing. Any information relating to real estate for sale referenced on this web site comes from the Internet Data Exchange (IDX) program of the California Regional MLS (Southern California). CENTURY 21 Century Real Estate is not a Multiple Listing Service (MLS), nor does it offer MLS access. This website is a service of CENTURY 21 Century Real Estate, a broker participant of California Regional MLS (Southern California). This web site may reference real estate listing(s) held by a brokerage firm other than the broker and/or agent who owns this web site.
The accuracy of all information, regardless of source, including but not limited to open house information, square footages and lot sizes, is deemed reliable but not guaranteed and should be personally verified through personal inspection by and/or with the appropriate professionals. The data contained herein is copyrighted by California Regional MLS (Southern California) and is protected by all applicable copyright laws. Any unauthorized dissemination of this information is in violation of copyright laws and is strictly prohibited.
Copyright 2021 California Regional MLS (Southern California). All rights reserved.
This information is deemed reliable but not guaranteed. You should rely on this information only to decide whether or not to further investigate a particular property. BEFORE MAKING ANY OTHER DECISION, YOU SHOULD PERSONALLY INVESTIGATE THE FACTS (e.g. square footage and lot size) with the assistance of an appropriate professional. You may use this information only to identify properties you may be interested in investigating further. All uses except for personal, non-commercial use in accordance with the foregoing purpose are prohibited. Redistribution or copying of this information, any photographs or video tours is strictly prohibited. This information is derived from the Internet Data Exchange (IDX) service provided by San Diego MLS®. Displayed property listings may be held by a brokerage firm other than the broker and/or agent responsible for this display. The information and any photographs and video tours and the compilation from which they are derived is protected by copyright. Compilation © 2020 San Diego MLS®, Inc. SANDICOR Member Broker: Nikki Coppa
Popular searches near 92883
Popular neighborhoods near 92883
- Alberhill, Lake Elsinore homes for sale
- Chase Ranch, Corona homes for sale
- Country Club Heights, Lake Elsinore homes for sale
- Dos Lagos, Corona homes for sale
- Eagle Glen, Corona homes for sale
- El Cerrito, Corona homes for sale
- Glen Ivy, Corona homes for sale
- Lake Edge, Lake Elsinore homes for sale
- Lake Elsinore Business District, Lake Elsinore homes for sale
- Lake View District, Lake Elsinore homes for sale
- Lake View Sphere, Lake Elsinore homes for sale
- Robinson Ranch, Trabuco Canyon homes for sale
- Sycamore Creek, Corona homes for sale
- Temescal Valley, Corona homes for sale
- The Retreat, Corona homes for sale
- Trabuco Canyon, Trabuco Canyon homes for sale
- Trabuco Highlands, Trabuco Canyon homes for sale
- Walden, Rancho Santa Margarita homes for sale
- Warm Springs, Lake Elsinore homes for sale
- Wildrose Ranch, Corona homes for sale
Protect your home and budget from life's surprises with an Assurant Home Warranty, backed by a partner that supports you through every step of homeownership. Explore Plans.
©2026 Century 21 Real Estate LLC. All rights reserved. CENTURY 21®, the CENTURY 21 Logo and C21® are service marks owned by Century 21 Real Estate LLC. Century 21 Real Estate LLC fully supports the principles of the Fair Housing Act and the Equal Opportunity Act. Each office is independently owned and operated. Listing information is deemed reliable but not guaranteed accurate.