- Acton homes for sale
- Agua Dulce homes for sale
- Altadena homes for sale
- Canyon Country homes for sale
- Desert View Highlands homes for sale
- Juniper Hills homes for sale
- La Cañada Flintridge homes for sale
- La Crescenta homes for sale
- La Crescenta-Montrose homes for sale
- Lancaster homes for sale
- Leona Valley homes for sale
- Littlerock homes for sale
- North Antelope Valley homes for sale
- Palmdale homes for sale
- Pearblossom homes for sale
- Quartz Hill homes for sale
- South Antelope Valley homes for sale
- Sun Village homes for sale
- Sunland homes for sale
- Tujunga homes for sale
93550, CA - homes for sale
300 of 499 results displayed
- New
 $375,000Active3 beds 2 baths1,157 sq. ft.
40166 La Cota Drive, Palmdale, CA 93550
MLS# 26004475Listed by: KELLER WILLIAMS REALTY A.V. - New
 $414,500Active3 beds 2 baths1,190 sq. ft.
37137 26th Street East, Palmdale, CA 93550
MLS# SR26121812Listed by: BERKSHIRE HATHAWAY HOMESERVICES TROTH, REALTORS - New
 $229,000Active0 Acres
0 East Avenue Q & 25th St. East, Palmdale, CA 93550
MLS# PT26122235Listed by: 1ST CAL REALTY - New
 $699,000Active6 beds 3 baths2,839 sq. ft.
3531 Conestoga Canyon, Palmdale, CA 93550
MLS# SR26121901Listed by: PREMIERE PACIFIC REALTY  $438,000Pending2 beds 2 baths1,962 sq. ft.
38906 10th St E E, Palmdale, CA 93550
MLS# SR26122560Listed by: KELLER WILLIAMS ANTELOPE VALLEY- New
 $415,000Active3 beds 2 baths1,386 sq. ft.
37621 Harvey Street, Palmdale, CA 93550
MLS# 26004422Listed by: KELLER WILLIAMS REALTY A.V. - New
 $430,000Active3 beds 2 baths1,190 sq. ft.
37023 E 29th Place, Palmdale, CA 93550
MLS# 26004418Listed by: D & S REALTY - New
 $399,999Active3 beds 2 baths1,300 sq. ft.
3558 Avocado Lane, Palmdale, CA 93550
MLS# 26004411Listed by: KELLER WILLIAMS REALTY A.V. - New
 $189,950Active3 beds 2 baths1,656 sq. ft.
1030 E Avenue South #Spc 77, Palmdale, CA 93550
MLS# SR26120560Listed by: KELLER WILLIAMS REALTY ANTELOPE VALLEY - New
 $554,990Active3 beds 3 baths1,751 sq. ft.
37442 Greenwich Court, Palmdale, CA 93550
MLS# 26004392Listed by: SYNC BROKERAGE, INC. - New
 $575,000Active4 beds 3 baths1,120 sq. ft.
38909 Carolside, Palmdale, CA 93550
MLS# SR26121154Listed by: PARK REGENCY REALTY - New$320,000Active0 Acres
40650 Vac/11th Stw/vic Avenue N12, Palmdale, CA 93550
MLS# RS26121289Listed by: HOME PARADISE REALTY GROUP INC - New
 $550,000Active3 beds 2 baths1,419 sq. ft.
1724 High Vista Avenue, Palmdale, CA 93550
MLS# 26004382Listed by: QUARTZ HILL REAL ESTATE - New
 $390,000Active2 beds 2 baths1,300 sq. ft.
37513 Rosewood, Palmdale, CA 93550
MLS# SR26120574Listed by: GLOBE AND ANCHOR REALTY, INC. - New
 $719,999Active8 beds 4 baths
38721 5th East, Palmdale, CA 93550
MLS# OC26115351Listed by: FIRST TEAM REAL ESTATE - New
 $533,000Active3 beds 2 baths1,446 sq. ft.
3152 Fern Avenue, Palmdale, CA 93550
MLS# 26004332Listed by: CENTURY 21 MASTERS - New
 $525,000Active4 beds 2 baths1,556 sq. ft.
1304 Springline Drive, Palmdale, CA 93550
MLS# SR26118134Listed by: CITIWIDE REALTY GROUP  $425,000Pending2 beds -- baths1,962 sq. ft.
38906 10th Street, Palmdale, CA 93550
MLS# 26004328Listed by: KELLER WILLIAMS REALTY A.V.- New
 $450,000Active4 beds 3 baths1,698 sq. ft.
37730 Scomar Street, Palmdale, CA 93550
MLS# 26004327Listed by: JOSE CONTRERAS, BROKER - New
 $639,000Active4 beds 3 baths1,878 sq. ft.
37856 Ashlee Court, Palmdale, CA 93550
MLS# 26004313Listed by: ANTELOPE REALTY - New
 $75,000Active0 Acres
0 Cor Drt 125 Ste. D West, Pearblossom, CA 93550
MLS# SR26118816Listed by: LUXURY COLLECTIVE - New
 $585,000Active4 beds 3 baths2,215 sq. ft.
1948 Spanish Broom, Palmdale, CA 93550
MLS# SR26118123Listed by: HELLEN HUBERT, BROKER - New
 $32,800Active0 Acres
0 E Avenue V, Palmdale, CA 93550
MLS# GD26118373Listed by: LA POCKET LISTINGS - New
 $409,900Active4 beds 3 baths1,914 sq. ft.
37826 Cardiff Street, Palmdale, CA 93550
MLS# DW26118065Listed by: CENTURY 21 REALTY MASTERS - New
 $398,500Active2 beds 3 baths1,519 sq. ft.
2664 Greenwood Court, Palmdale, CA 93550
MLS# OC26117694Listed by: AYDEN TYLER REALTY - New
 $398,000Active2 beds 3 baths1,519 sq. ft.
2264 Greenwood Court #2264, Palmdale, CA 93550
MLS# 26004272Listed by: AYDEN TYLER REALTY - New
 $429,999Active3 beds 1 baths930 sq. ft.
38512 30th East, Palmdale, CA 93550
MLS# SR26117552Listed by: EXP REALTY OF GREATER LOS ANGELES, INC. - New
 $429,999Active3 beds 1 baths930 sq. ft.
38512 30th E, Palmdale, CA 93550
MLS# SR26117552Listed by: EXP REALTY OF GREATER LOS ANGELES, INC. - New
 $425,000Active4 beds 2 baths1,788 sq. ft.
37747 Rudall, Palmdale, CA 93550
MLS# SR26115250Listed by: EXP REALTY OF CALIFORNIA - New
 $387,000Active4 beds 2 baths1,265 sq. ft.
38463 Lemsford Avenue, Palmdale, CA 93550
MLS# 26004241Listed by: KELLER WILLIAMS REALTY A.V. - New
 $450,000Active3 beds 2 baths1,264 sq. ft.
37603 Melton Avenue, Palmdale, CA 93550
MLS# 26004264Listed by: KELLER WILLIAMS REALTY A.V. - New
 $479,990Active3 beds 3 baths1,449 sq. ft.
2810 Juniper Drive, Palmdale, CA 93550
MLS# 26004234Listed by: BROADNAX PROPERTIES, INC. - New
 $399,900Active3 beds 2 baths1,044 sq. ft.
37627 3rd Street, Palmdale, CA 93550
MLS# 26004222Listed by: SYNC BROKERAGE, INC. - New
 $439,999Active3 beds 2 baths1,509 sq. ft.
567 Conifer Drive, Palmdale, CA 93550
MLS# 26840085Listed by: FOSTER DOUGLAS - New
 $46,500Active0.21 Acres
25th Pl East Vic # R12, Palmdale, CA 93550
MLS# 26004210Listed by: JOHNHART REAL ESTATE - New
 $539,500Active3 beds 2 baths1,461 sq. ft.
38229 Mentor Court, Palmdale, CA 93550
MLS# 26004204Listed by: PINNACLE ESTATE PROP. INC.  $309,000Active14.42 Acres
2200 E Carson Mesa Road, Palmdale, CA 93550
MLS# 26004160Listed by: KELLER WILLIAMS-VIP PROPERTIES $425,000Active4 beds 2 baths1,308 sq. ft.
1626 E Avenue Q11, Palmdale, CA 93550
MLS# SR26114171Listed by: KELLER WILLIAMS REALTY ANTELOPE VALLEY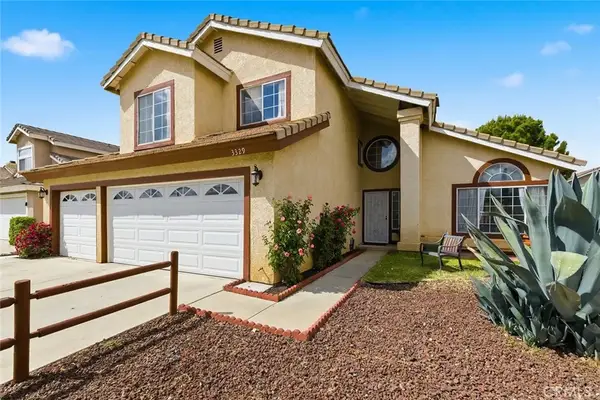 $520,000Active4 beds 3 baths1,929 sq. ft.
3329 Rollingridge Avenue, Palmdale, CA 93550
MLS# SR26110012Listed by: KELLER WILLIAMS LUXURY $274,900Pending2 beds 2 baths853 sq. ft.
2554 Olive Drive #188, Palmdale, CA 93550
MLS# SR26108953Listed by: ENRG REALTY, INC $539,900Active4 beds 4 baths1,690 sq. ft.
36937 Firethorn Street, Palmdale, CA 93550
MLS# 26004132Listed by: REAL ESTATE PROFESSIONALS OF A.V. $419,999Pending4 beds 2 baths1,519 sq. ft.
37642 Cluny, Palmdale, CA 93550
MLS# SR26113129Listed by: LUGO REALTY $429,900Active3 beds 2 baths1,299 sq. ft.
38457 Glenbush Avenue, Palmdale, CA 93550
MLS# 26004125Listed by: RE/MAX ALL-PRO $499,000Active3 beds 2 baths1,434 sq. ft.
2614 Joshua Hills Drive, Palmdale, CA 93550
MLS# SR26111972Listed by: REAL BROKERAGE TECHNOLOGIES, INC. $630,000Active4 beds 3 baths3,210 sq. ft.
38519 37th Street, Palmdale, CA 93550
MLS# 26004088Listed by: EQUITY SMART HOME LOANS, INC.- $55,000Active0.74 Acres
Cor 9th Ste & Ave Q # Q, Palmdale, CA 93550
MLS# 26004075Listed by: COLDWELL BANKER-A HARTWIG CO.  $449,900Active4 beds 3 baths1,974 sq. ft.
149 Asusena, Palmdale, CA 93550
MLS# SR26106256Listed by: KELLER WILLIAMS LUXURY $310,000Pending3 beds 2 baths1,509 sq. ft.
37437 Conifer, Palmdale, CA 93550
MLS# 26004056Listed by: HOMEBASED REALTY $459,999Pending3 beds 2 baths1,079 sq. ft.
37521 Larkin, Palmdale, CA 93550
MLS# SR26110827Listed by: LPT REALTY, INC $499,999Active3 beds 2 baths983 sq. ft.
1814 E Avenue Q11, Palmdale, CA 93550
MLS# SR26109745Listed by: REAL BROKER $220,000Pending2.61 Acres
Cor 17th Stw # N4, Palmdale, CA 93550
MLS# 26004012Listed by: LUXURY COLLECTIVE $190,000Active3 beds 2 baths1,596 sq. ft.
1030 E Avenue S, Palmdale, CA 93550
MLS# SR26109014Listed by: KELLER WILLIAMS REALTY ANTELOPE VALLEY $455,000Pending4 beds 3 baths1,452 sq. ft.
1712 Woodbridge, Palmdale, CA 93550
MLS# IV26108324Listed by: ELEVATE REAL ESTATE AGENCY $424,999Pending3 beds 3 baths1,854 sq. ft.
38239 Lone Tree Court, Palmdale, CA 93550
MLS# SR26108344Listed by: ETHOS INTERNATIONAL REAL ESTATE $449,900Active3 beds 2 baths1,453 sq. ft.
37406 3rd East, Palmdale, CA 93550
MLS# SR26107811Listed by: EXP REALTY OF SOUTHERN CALIFORNIA, INC $519,900Active5 beds 3 baths1,897 sq. ft.
37251 Wild Tree, Palmdale, CA 93550
MLS# SR26108175Listed by: JAMES BAKER REALTY, INC. $169,999Active2 beds 2 baths
3255 East Avenue R #98, Palmdale, CA 92550
MLS# SR26106786Listed by: CENTURY 21 MASTERS $449,990Pending3 beds 2 baths1,228 sq. ft.
37031 Firethorn Street, Palmdale, CA 93550
MLS# SR26107893Listed by: MARRO REAL ESTATE, INC. $318,000Active0 Acres
0 Avenue R, Palmdale, CA 93550
MLS# SR26107402Listed by: REAL ESTATE PROFESSIONALS OF AV $159,000Active3 beds 2 baths1,150 sq. ft.
3524 E Avenue R #295, Palmdale, CA 93550
MLS# SR26107122Listed by: BLVD ESTATE PROPERTIES $485,000Pending3 beds 2 baths1,451 sq. ft.
37063 Waterman Avenue, Palmdale, CA 93550
MLS# 26003929Listed by: ANTELOPE REALTY $319,999Active4 beds 2 baths1,443 sq. ft.
2260 E Ave Q4, Palmdale, CA 93550
MLS# CV26106621Listed by: EXP REALTY OF GREATER LOS ANGELES $625,000Active6 beds 4 baths2,420 sq. ft.
38726 4th Street East, Palmdale, CA 93550
MLS# SR26104734Listed by: JOHNHART REAL ESTATE- Open Sat, 10 to 1am
 $210,000Active3 beds 2 baths1,936 sq. ft.
1030 East Ave S #170, Palmdale, CA 93550
MLS# SR26104787Listed by: CENTURY 21 MASTERS - Open Sat, 10am to 1pm
 $210,000Active3 beds 2 baths1,936 sq. ft.
1030 East Ave S #170, Palmdale, CA 93550
MLS# SR26104787Listed by: CENTURY 21 MASTERS  $625,000Active6 beds 4 baths2,420 sq. ft.
38726 4th Street E, Palmdale, CA 93550
MLS# SR26104734Listed by: JOHNHART REAL ESTATE $199,000Active10.19 Acres
Richter Lane, Palmdale, CA 93550
MLS# 26003855Listed by: KELLER WILLIAMS REALTY A.V. $485,000Pending4 beds 3 baths1,974 sq. ft.
40335 Reata Road, Palmdale, CA 93550
MLS# 26829385Listed by: EXP REALTY OF CALIFORNIA INC $450,000Active3 beds 3 baths1,687 sq. ft.
40315 Maravilla Drive, Palmdale, CA 93550
MLS# 26003840Listed by: RE/MAX ALL-PRO $495,000Active4 beds 2 baths1,583 sq. ft.
37115 Zinnia Street, Palmdale, CA 93550
MLS# 26003841Listed by: EXP REALTY OF CALIFORNIA, INC. $455,000Pending3 beds 2 baths1,079 sq. ft.
350 E Avenue R11, Palmdale, CA 93550
MLS# 26832505Listed by: ROA CALIFORNIA INC.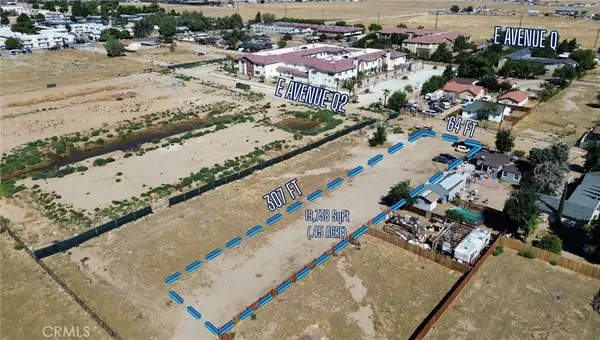 $108,800Active0.45 Acres
0 Avenue Q2, Palmdale, CA 93550
MLS# SR26103574Listed by: COLDWELL BANKER QUALITY PROPERTIES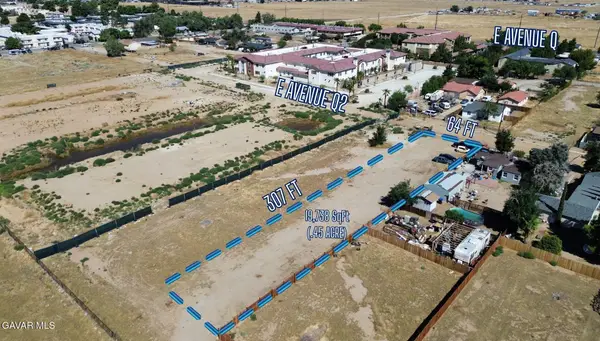 $108,800Active0.45 Acres
0 Ave Q2 Vic 15th Ste, Palmdale, CA 93550
MLS# 26003814Listed by: JOSE CONTRERAS, BROKER $420,000Active3 beds 2 baths999 sq. ft.
38714 2nd East, Palmdale, CA 93550
MLS# PF26103118Listed by: MAJESTIC REAL ESTATE $489,000Active4 beds 3 baths1,406 sq. ft.
38638 Carolside Avenue, Palmdale, CA 93550
MLS# TR26088825Listed by: PINNACLE REAL ESTATE GROUP $489,000Active4 beds 3 baths1,406 sq. ft.
38638 Carolside Avenue, Palmdale, CA 93550
MLS# TR26088825Listed by: PINNACLE REAL ESTATE GROUP $29,900Active2.73 Acres
185 Ave P, Palmdale, CA 93550
MLS# 219147744DAListed by: KELLER WILLIAMS REALTY $400,000Active7.11 Acres
Cor Avenue N12 Sierra Highway, Palmdale, CA 93550
MLS# 26003773Listed by: RE/MAX ALL-PRO $394,990Pending3 beds 2 baths1,115 sq. ft.
3111 E Avenue Q13, Palmdale, CA 93550
MLS# 26003758Listed by: KASA HOMES REALTY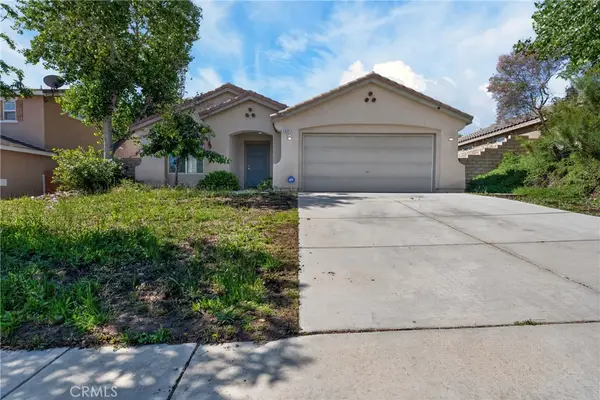 $509,950Pending3 beds 2 baths1,888 sq. ft.
2804 Apolena, Palmdale, CA 93550
MLS# OC26100565Listed by: EXP REALTY OF CALIFORNIA INC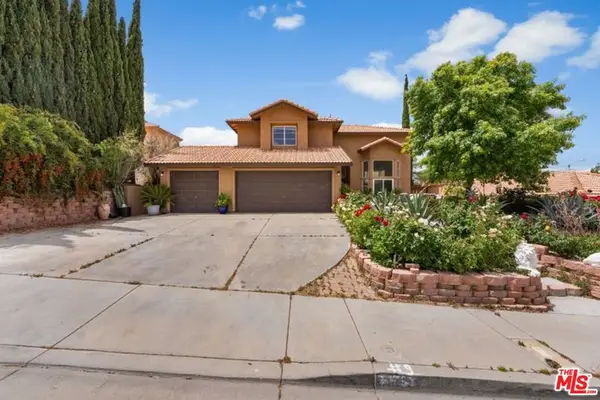 $549,999Pending4 beds 3 baths2,196 sq. ft.
36557 Buckboard Court, Palmdale, CA 93550
MLS# 26831695Listed by: ROA CALIFORNIA INC. $449,999Active3 beds 2 baths1,500 sq. ft.
38539 36th East, Palmdale, CA 93550
MLS# SR26100963Listed by: EXP REALTY OF GREATER LOS ANGELES, INC. $469,900Active4 beds 3 baths2,128 sq. ft.
40422 Maravilla, Palmdale, CA 93550
MLS# PW26100031Listed by: KSREINV INC.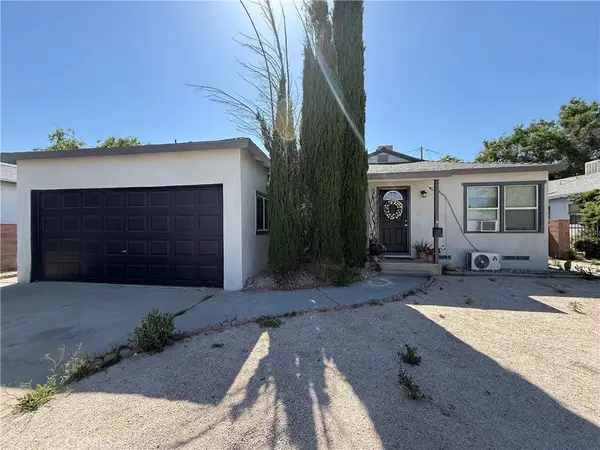 $399,999Active3 beds 1 baths1,053 sq. ft.
38321 Rosemarie Street, Palmdale, CA 93550
MLS# SR26100255Listed by: EQUITY UNION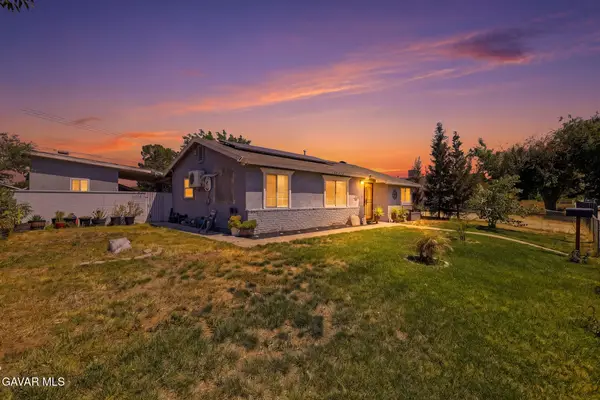 $399,990Active3 beds 2 baths930 sq. ft.
38512 E 30th Street, Palmdale, CA 93550
MLS# 26003704Listed by: EXP REALTY OF GREATER LOS ANGELES, INC. $399,999Active3 beds 1 baths1,053 sq. ft.
38321 Rosemarie Street, Palmdale, CA 93550
MLS# SR26100255Listed by: EQUITY UNION $539,900Pending4 beds 3 baths2,052 sq. ft.
37450 Yorkshire, Palmdale, CA 93550
MLS# SR26098817Listed by: THE REAL ESTATE PLACE $289,000Active4 beds 2 baths1,528 sq. ft.
1750 E Avenue Q14 #17, Palmdale, CA 93550
MLS# SR26098957Listed by: JOHNHART REAL ESTATE $45,400Pending1.18 Acres
55 E Avenue R Avenue, Palmdale, CA 93550
MLS# CL26830811Listed by: EXP REALTY OF GREATER LOS ANGELES $45,400Active1.18 Acres
55 VAC E Avenue R Avenue #R, Palmdale, CA 93550
MLS# 26830811Listed by: EXP REALTY OF GREATER LOS ANGELES $45,400Pending1.18 Acres
55th Ste Vic Avenue R Ste, Palmdale, CA 93550
MLS# 26003667Listed by: EXP REALTY OF GREATER LOS ANGELES, INC.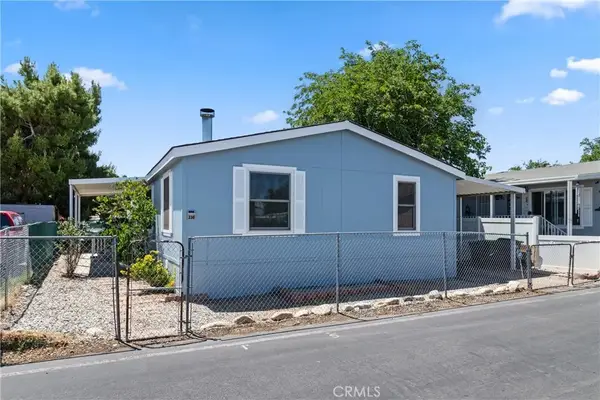 $175,000Active3 beds 2 baths1,188 sq. ft.
3255 E Avenue R #230, Palmdale, CA 93550
MLS# SR26098979Listed by: EXP REALTY OF GREATER LOS ANGELES, INC. $449,999Active3 beds 2 baths1,287 sq. ft.
3811 Triton Drive, Palmdale, CA 93550
MLS# P1-27022Listed by: GOTHAM REALTY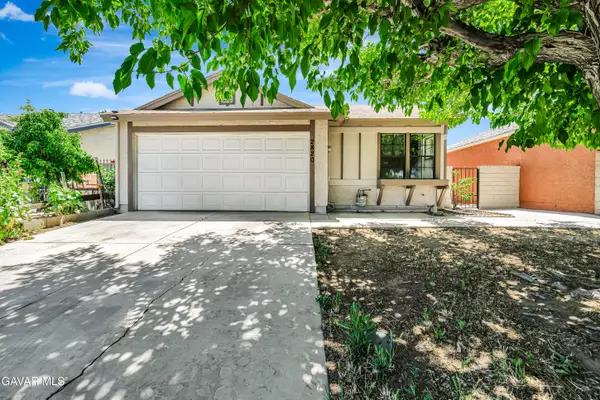 $429,900Pending3 beds 2 baths1,190 sq. ft.
2820 E Avenue S, Palmdale, CA 93550
MLS# 26003651Listed by: BERKSHIRE HATHAWAY HOMESERVICES TROTH, REALTORS $185,000Active3 beds 2 baths1,440 sq. ft.
3524 E Avenue R #185, Palmdale, CA 93550
MLS# DW26098312Listed by: GOLDEN FEATHER INVESTMENTS, INC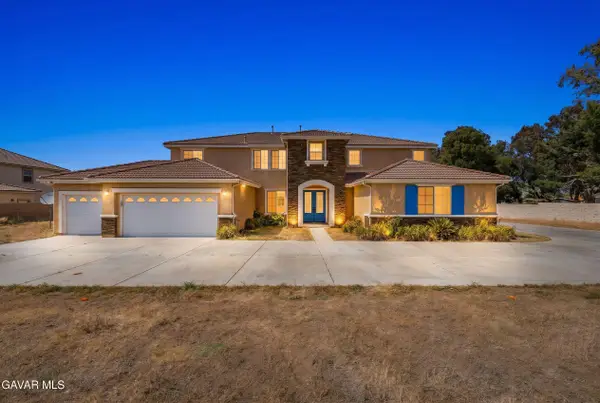 $1,150,000Active5 beds 5 baths5,416 sq. ft.
658 E Lago Lindo Road, Palmdale, CA 93550
MLS# 26003638Listed by: SYNC BROKERAGE, INC.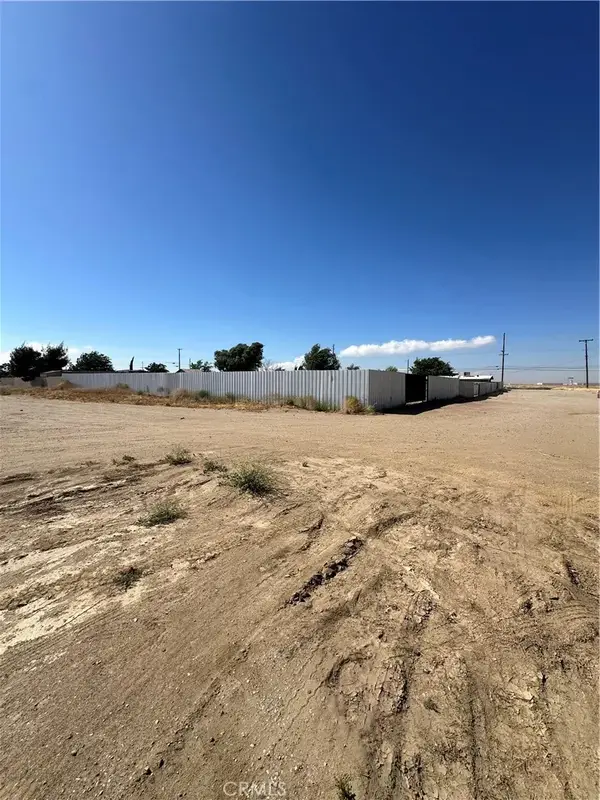 $80,000Active0 Acres
0 16th Ste Avenue Q, Palmdale, CA 93550
MLS# SR26097186Listed by: SAN FERNANDO REALTY, INC. $1,988,000Active0 Acres
0 Avenue N, Palmdale, CA 93550
MLS# AR26096846Listed by: 1000 REALTY CORPORATION $410,000Active3 beds 2 baths804 sq. ft.
232 E Avenue P5, Palmdale, CA 93550
MLS# SR26092989Listed by: JOHNHART REAL ESTATE $410,000Active3 beds 2 baths804 sq. ft.
232 E Avenue P5, Palmdale, CA 93550
MLS# SR26092989Listed by: JOHNHART REAL ESTATE $439,900Active3 beds 2 baths1,452 sq. ft.
1855 E Avenue R2, Palmdale, CA 93550
MLS# IV26095335Listed by: RE/MAX ONE $439,900Active3 beds 2 baths1,452 sq. ft.
1855 E Avenue R2, Palmdale, CA 93550
MLS# IV26095335Listed by: RE/MAX ONE $149,990Active0.45 Acres
0 Ave P Vic Sierra, Palmdale, CA 93550
MLS# 26003571Listed by: REAL BROKERAGE TECHNOLOGIES $450,000Active4 beds 3 baths1,710 sq. ft.
2148 Scott Avenue, Palmdale, CA 93550
MLS# SR26094921Listed by: COLDWELL BANKER REALTY $19,000Active4.97 Acres
155 E Avenue S15, Palmdale, CA 93550
MLS# 226055504Listed by: COLDWELL BANKER ASSOCIATED BROKERS $439,900Active3 beds 2 baths1,079 sq. ft.
37509 Larkin, Palmdale, CA 93550
MLS# RS26095171Listed by: VIP RE FIRM $19,000Active4.97 Acres
155 E Avenue S 12, Palmdale, CA 93550
MLS# 226055469Listed by: COLDWELL BANKER ASSOCIATED BROKERS $60,000Active1.13 Acres
3300 Pearblossom Highway, Palmdale, CA 93550
MLS# 26003540Listed by: LA BEST HOMES $19,000Active4.97 Acres
155 E Avenue S-14, Palmdale, CA 93551
MLS# 226054714Listed by: COLDWELL BANKER ASSOCIATED BROKERS $99,000Active1.28 Acres
East Ave M & 30th Ste, Palmdale, CA 93550
MLS# 26003526Listed by: LUXURY COLLECTIVE $465,500Active4 beds 3 baths1,690 sq. ft.
37001 Zinnia Street, Palmdale, CA 93550
MLS# SR26092514Listed by: RODEO REALTY $1,395,000Active4 beds 4 baths5,404 sq. ft.
36300 Sierra Highway, Palmdale, CA 93550
MLS# 26828213Listed by: KELLER WILLIAMS ENCINO/SHERMAN OAKS $3,500,000Active17 Acres
Division St Vic # P12, Palmdale, CA 93550
MLS# 26003489Listed by: BERKSHIRE HATHAWAY HOMESERVICES TROTH, REALTORS $569,900Pending5 beds 3 baths2,818 sq. ft.
36528 Palomino Court, Palmdale, CA 93550
MLS# V1-36118Listed by: EXP REALTY OF CALIFORNIA INC $430,000Pending3 beds 2 baths1,296 sq. ft.
36815 Spanish Broom Drive, Palmdale, CA 93550
MLS# SR26093979Listed by: GENERAL REALTY GROUP,INC. $149,990Active0.45 Acres
0 Vac/ave P/ Vic Sierra, Palmdale, CA 93550
MLS# SR26093780Listed by: REAL BROKERAGE TECHNOLOGIES, INC. $50,000Active20.16 Acres
82 nd Street East & Avenue W-9, Palmdale, CA 93550
MLS# 219141182DAListed by: TOCCHINI REAL ESTATE $1,089,000Active7 beds 5 baths3,125 sq. ft.
37918 Palm Vista, Palmdale, CA 93550
MLS# GD26092420Listed by: UNITED GROUP REALTY $269,900Active3 beds 2 baths1,156 sq. ft.
38710 10th E, Palmdale, CA 93550
MLS# SR26092451Listed by: KELLER WILLIAMS REALTY ANTELOPE VALLEY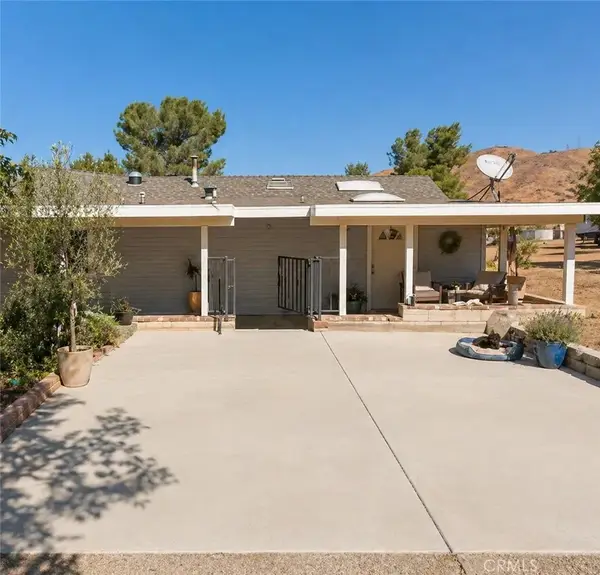 $500,000Active3 beds 1 baths1,708 sq. ft.
33438 Angeles Forest, Acton, CA 93550
MLS# SR26091365Listed by: LUXURY COLLECTIVE $720,000Active3 beds 2 baths1,891 sq. ft.
38740 25th Street East, Palmdale, CA 93550
MLS# SR26091462Listed by: TWIN HOMES & LOANS $7,200,000Active48 beds 24 baths23,230 sq. ft.
1218 E Avenue Q, Palmdale, CA 93550
MLS# 26003423Listed by: BERKSHIRE HATHAWAY HOMESERVICES TROTH, REALTORS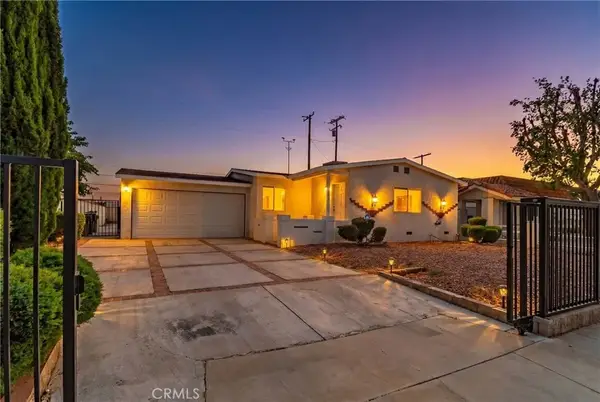 $399,999Active3 beds 2 baths988 sq. ft.
802 E Avenue Q4, Palmdale, CA 93550
MLS# SR26091619Listed by: EXP REALTY OF CALIFORNIA $490,000Active3 beds 2 baths1,260 sq. ft.
1739 E Avenue R6, Palmdale, CA 93550
MLS# DW26092115Listed by: FIRST FAMILY HOMES $40,000Active0 Acres
0 Vac/47th Ste Pav /vic Avenue V, Palmdale, CA 93550
MLS# SR26092106Listed by: HOMESMART EVERGREEN REALTY $499,000Active3 beds 3 baths1,663 sq. ft.
37411 Sheffield Drive, Palmdale, CA 93550
MLS# 26821885Listed by: COLDWELL BANKER REALTY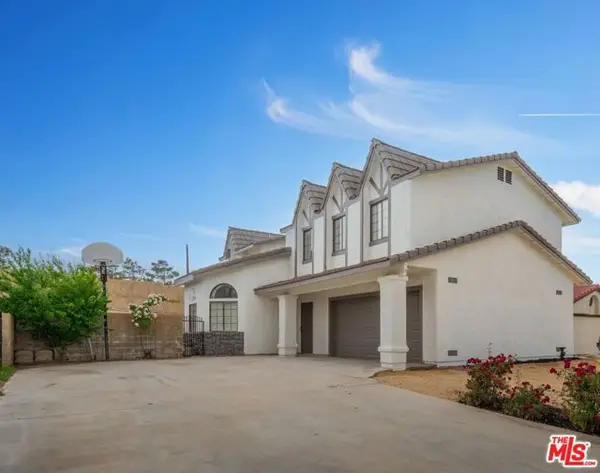 $585,000Pending4 beds 3 baths2,036 sq. ft.
2232 Thomas Avenue, Palmdale, CA 93550
MLS# CL26799910Listed by: REALTY PRO INC.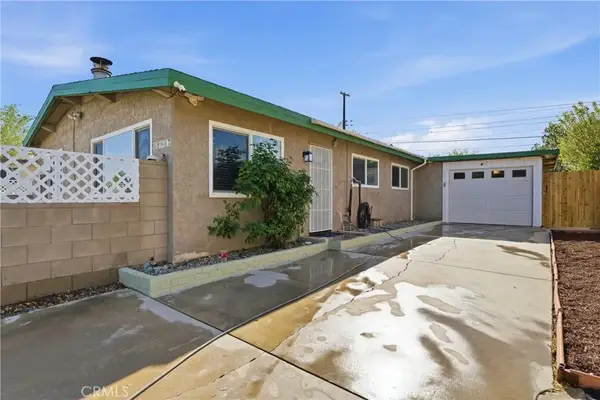 $479,900Active4 beds 2 baths1,324 sq. ft.
38637 Sumac, Palmdale, CA 93550
MLS# SR26090571Listed by: THE MARKET $479,900Active4 beds 2 baths1,324 sq. ft.
38637 Sumac, Palmdale, CA 93550
MLS# SR26090571Listed by: THE MARKET $479,999Pending3 beds 2 baths1,287 sq. ft.
37900 Janus, Palmdale, CA 93550
MLS# SR26089631Listed by: REALTY EXECUTIVES $120,000Active0 Acres
17 Carrollton, Palmdale, CA 93550
MLS# FR26089613Listed by: DOMBROSKI REALTY $485,000Active3 beds 2 baths1,371 sq. ft.
36434 Windtree, Palmdale, CA 93550
MLS# IV26089306Listed by: PLATINUM EMPIRE REAL ESTATE $35,000Active0 Acres
48 3170-017-048- 30th St E & Columbia Wy., Lancaster, CA 93550
MLS# IG26088374Listed by: PONCE & PONCE REALTY, INC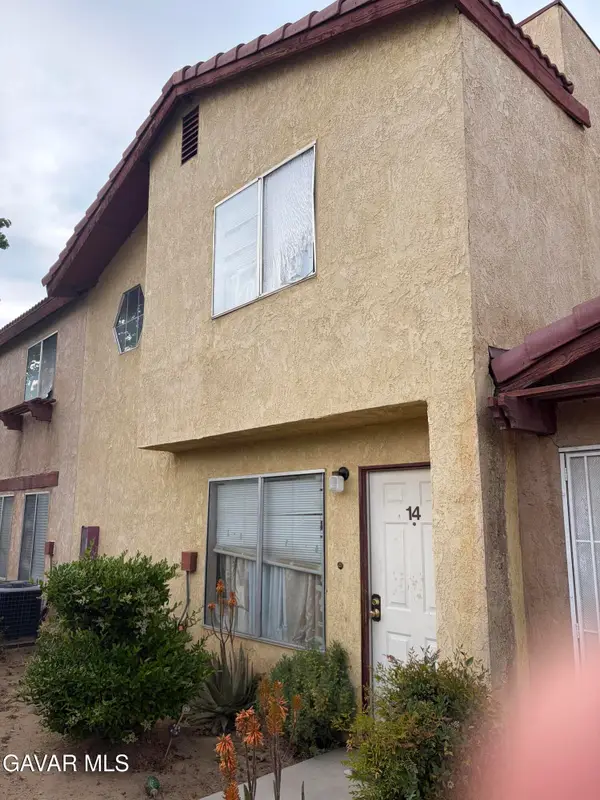 $265,000Active3 beds 2 baths1,316 sq. ft.
1700 E Ave Q-14 #14, Palmdale, CA 93550
MLS# 26003300Listed by: REAL BROKERAGE TECHNOLOGIES $450,000Pending3 beds 2 baths1,386 sq. ft.
3254 Quarry Road, Palmdale, CA 93550
MLS# 26003302Listed by: KELLER WILLIAMS REALTY A.V. $455,000Pending3 beds 2 baths1,100 sq. ft.
350 E Avenue R11, Palmdale, CA 93550
MLS# 26003276Listed by: REALTY OF AMERICA $35,000Pending8356 Acres
Evette Ct, E Ave Q13, Palmdale, CA 93550
MLS# 26003259Listed by: LUXURY COLLECTIVE $539,000Pending5 beds 3 baths2,070 sq. ft.
36436 Nickel, Palmdale, CA 93550
MLS# SR26087520Listed by: EXP REALTY OF GREATER LOS ANGELES, INC. $75,000Active2.05 Acres
0 Vac Vic Old Nadeau Rd. Small Rd., Palmdale, CA 93550
MLS# SR26083743Listed by: COLDWELL BANKER REALTY $85,888Active0.22 Acres
R10 27th Street E Vic Avenue R10 S, Palmdale, CA 93550
MLS# 26003196Listed by: MINTED REAL ESTATE GROUP, INC $39,000Active0.21 Acres
E 26th Ste Vic Avenue R10 Ste Street # R8, Palmdale, CA 93550
MLS# 26003199Listed by: MINTED REAL ESTATE GROUP, INC $39,888Active0.21 Acres
25th Pl East Vic Avenue # R8, Palmdale, CA 93550
MLS# 26003202Listed by: MINTED REAL ESTATE GROUP, INC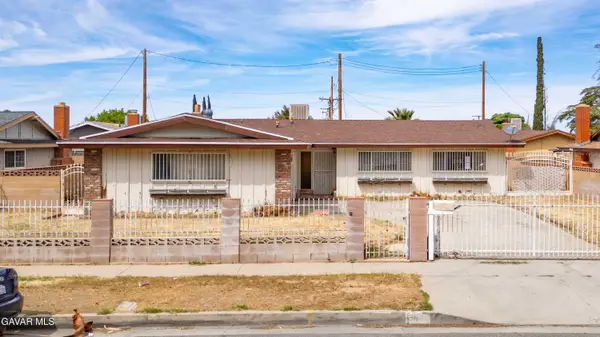 $300,000Pending3 beds 2 baths1,350 sq. ft.
139 E Avenue Q7, Palmdale, CA 93550
MLS# 26003214Listed by: JOHNHART REAL ESTATE $550,000Active4 beds 3 baths1,929 sq. ft.
3301 Honeysuckle, Palmdale, CA 93550
MLS# PW26085470Listed by: HOME SAVER REALTY $550,000Active4 beds 3 baths1,929 sq. ft.
3301 Honeysuckle, Palmdale, CA 93550
MLS# PW26085470Listed by: HOME SAVER REALTY $350,000Active3 beds 1 baths1,125 sq. ft.
1620 E Avenue Q10, Palmdale, CA 93550
MLS# SR26062387Listed by: REAL BROKERAGE TECHNOLOGIES, INC. $309,000Active0 Acres
2200 E Carson Mesa, Palmdale, CA 93550
MLS# SR26080035Listed by: KELLER WILLIAMS VIP PROPERTIES $399,900Active2 beds 2 baths940 sq. ft.
3107 E Avenue R5, Palmdale, CA 93550
MLS# SR26085675Listed by: KELLER WILLIAMS REALTY ANTELOPE VALLEY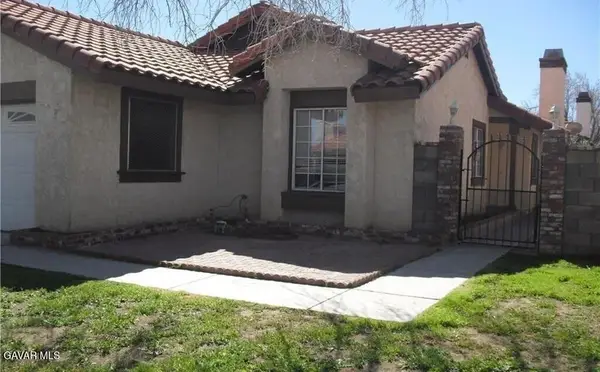 $425,000Pending3 beds 2 baths1,229 sq. ft.
3212 E Avenue S1, Palmdale, CA 93550
MLS# 26003158Listed by: KELLAR - DAVIS, INC.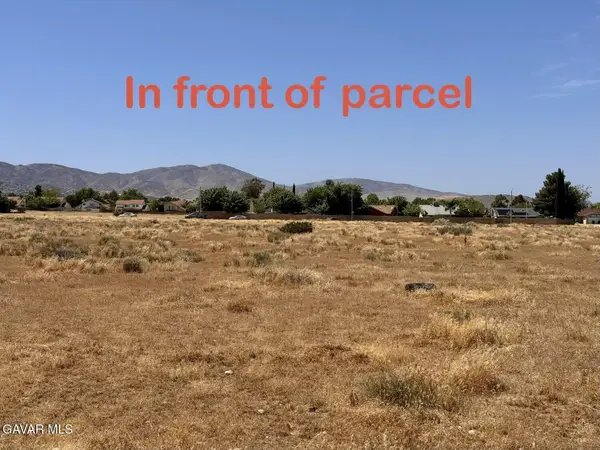 $43,600Active0.21 Acres
E 26th Ste Vic Ave R10, Palmdale, CA 93550
MLS# 26003154Listed by: JOHNHART REAL ESTATE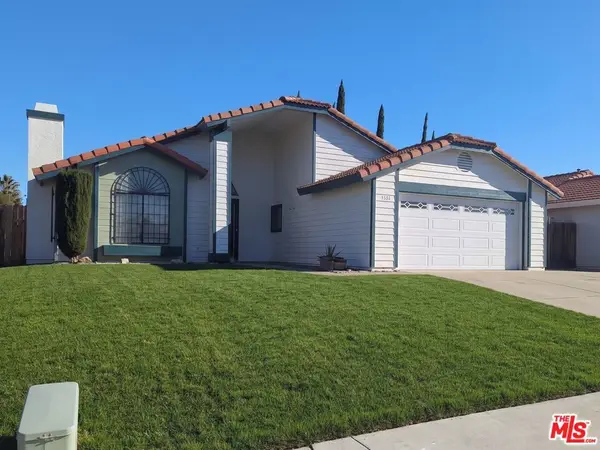 $429,000Active3 beds 2 baths1,451 sq. ft.
37058 Waterman Avenue, Palmdale, CA 93550
MLS# 26759019Listed by: INGENIOUS ASSET GROUP, INC. $59,000Active0 Acres
8900 Bainard Canyon, Littlerock, CA 93550
MLS# DW26084505Listed by: LA BEST HOMES $195,000Active0 Acres
0 Avenue T4, Palmdale, CA 93550
MLS# SR26084087Listed by: BEVERLY AND COMPANY, INC. $195,000Active2.14 Acres
Cor 40th St E # T4, Palmdale, CA 93550
MLS# 26003099Listed by: BEVERLY & COMPANY, INC. $275,999Pending2 beds 3 baths1,013 sq. ft.
2320 E Avenue Q4 #56 #56, Palmdale, CA 93550
MLS# SR26081393Listed by: EXP REALTY OF GREATER LOS ANGELES, INC. $345,000Pending3 beds 2 baths1,102 sq. ft.
38343 17th Street, Palmdale, CA 93550
MLS# 26003048Listed by: PRECEPT REAL ESTATE SERVICES $450,000Active4 beds 3 baths1,660 sq. ft.
37130 Casa Verde Dr, Palmdale, CA 93550
MLS# 260009021Listed by: TXR HOMES, INC. $439,000Active3 beds 2 baths924 sq. ft.
38639 Lilacview Avenue, Palmdale, CA 93550
MLS# GD26081213Listed by: PINNACLE ESTATE PROPERTIES, IN $19,500Active0 Acres
0 Juniper Ridge, Acton, CA 93550
MLS# OC26080883Listed by: WILLIAM JOHNSON, BROKER $389,900Active2 beds 2 baths1,101 sq. ft.
3441 San Felipe Court, Palmdale, CA 93550
MLS# SR26081165Listed by: MISSION REAL ESTATE $549,999Active3 beds 2 baths1,506 sq. ft.
36772 Petra Drive, Palmdale, CA 93550
MLS# SR26081899Listed by: REPRESENTED BY $520,000Active3 beds 2 baths1,770 sq. ft.
37551 E 29th Street, Palmdale, CA 93550
MLS# 26002982Listed by: REAL BROKERAGE TECHNOLOGIES $140,000Active2.85 Acres
3400 E Ave T 6, Palmdale, CA 93550
MLS# 26002977Listed by: CENTURY 21 DOUG ANDERSON $1,200,000Active0 Acres
30 E Palmdale Boulevard, Palmdale, CA 93550
MLS# SR26080078Listed by: EXP REALTY OF GREATER LOS ANGELES, INC. $417,000Pending3 beds 2 baths1,125 sq. ft.
38502 Sumac Avenue, Palmdale, CA 93550
MLS# PW26080045Listed by: HOME BASE REALTY INC $350,000Active3 beds 1 baths983 sq. ft.
38609 Ladelle Avenue, Palmdale, CA 93550
MLS# SR26076144Listed by: EQUITY UNION $249,900Active0 Acres
0 Mccoy Ranch Rd & Tierra Subida, Palmdale, CA 93551
MLS# SR26078478Listed by: ALL PEOPLE'S REALTY $119,900Active0 Acres
165 E Avenue S, Palmdale, CA 93591
MLS# SR26078486Listed by: KELLER WILLIAMS REALTY ANTELOPE VALLEY $769,000Active2 beds 2 baths1,200 sq. ft.
1834 E Carson Mesa Road, Palmdale, CA 93550
MLS# V1-35733Listed by: REALTY ONE GROUP SUMMIT $399,999Active3 beds 2 baths1,122 sq. ft.
38621 Puerta, Palmdale, CA 93550
MLS# DW26076530Listed by: EXCELLENCE PREMIER REAL ESTATE $289,000Active2 beds 2 baths853 sq. ft.
2554 Olive #82, Palmdale, CA 93550
MLS# SR26076122Listed by: COLDWELL BANKER HARTWIG $387,900Active2 beds 2 baths924 sq. ft.
37630 E 12th Street, Palmdale, CA 93550
MLS# 26002861Listed by: KASA HOMES REALTY $289,000Active2 beds 2 baths853 sq. ft.
2554 Olive Drive #Apt 82, Palmdale, CA 93550
MLS# 26002855Listed by: COLDWELL BANKER-A HARTWIG CO. $529,999Active5 beds 3 baths1,866 sq. ft.
3041 Caminito Lane, Palmdale, CA 93550
MLS# DW26076073Listed by: CALIFORNIA REALTY $471,500Active3 beds 2 baths1,422 sq. ft.
36790 Spanish Broom Drive, Palmdale, CA 93550
MLS# 26002814Listed by: CENTURY 21 MASTERS $399,000Pending2 beds 2 baths937 sq. ft.
2718 E Avenue S, Palmdale, CA 93550
MLS# 26002807Listed by: HOMEBASED REALTY $528,900Pending4 beds 2 baths1,502 sq. ft.
37863 17th Street E, Palmdale, CA 93550
MLS# SR26068000Listed by: Z REAL ESTATE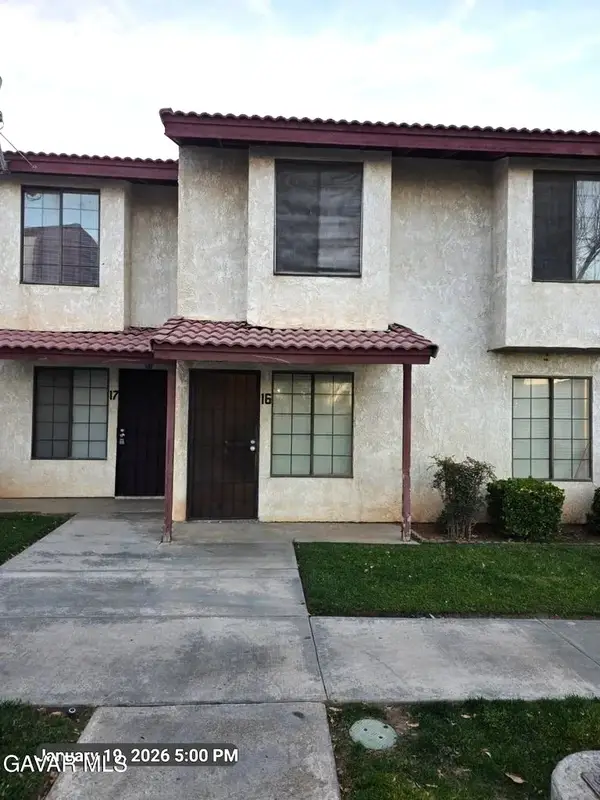 $289,900Pending4 beds 2 baths1,342 sq. ft.
38550 22nd East #16, Palmdale, CA 93550
MLS# SR26073479Listed by: ENRG REALTY, INC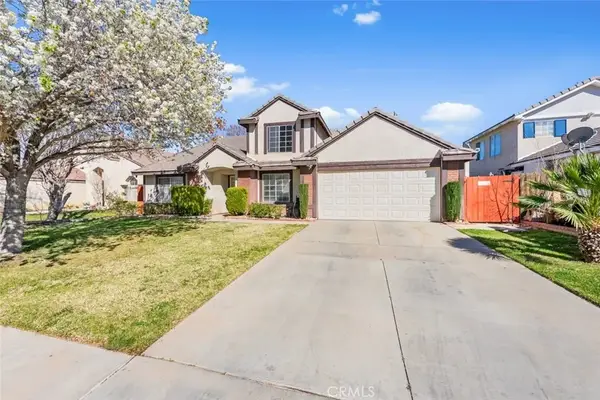 $499,900Active3 beds 2 baths1,752 sq. ft.
37526 Daybreak Street, Palmdale, CA 93550
MLS# SR26058167Listed by: JOHNHART REAL ESTATE $428,000Pending3 beds 2 baths1,290 sq. ft.
37255 E 28th East, Palmdale, CA 93550
MLS# SR26073746Listed by: PARK REGENCY REALTY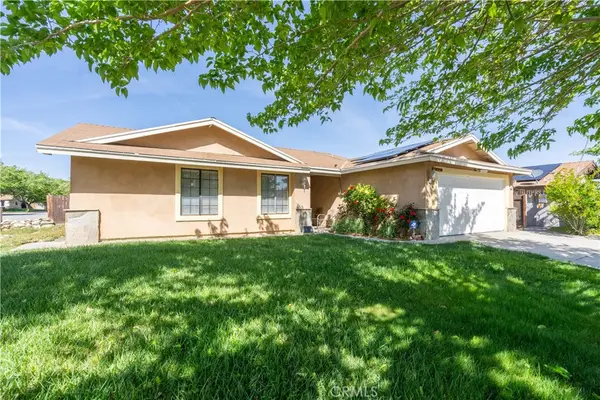 $428,000Pending3 beds 2 baths1,290 sq. ft.
37255 E 28th E, Palmdale, CA 93550
MLS# SR26073746Listed by: PARK REGENCY REALTY $499,900Active3 beds 2 baths1,752 sq. ft.
37526 Daybreak Street, Palmdale, CA 93550
MLS# SR26058167Listed by: JOHNHART REAL ESTATE $525,000Pending4 beds 3 baths1,929 sq. ft.
3329 Rollingridge Avenue, Palmdale, CA 93550
MLS# SR26072974Listed by: KELLER WILLIAMS LUXURY $59,000Active0.34 Acres
0 Vic Harold Cedar Ash, Palmdale, CA 93550
MLS# CL26673469Listed by: VIP PREMIER REALTY CORP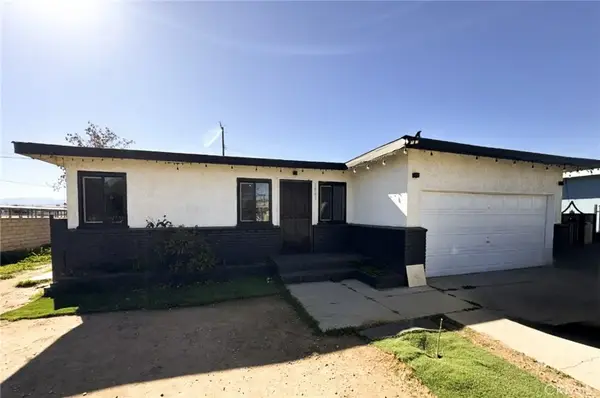 $412,900Active3 beds 2 baths1,151 sq. ft.
1866 E Avenue Q11, Palmdale, CA 93550
MLS# SR26072394Listed by: VALLEY ASSET & INVESTMENT CORP. $170,000Active0 Acres
0 Tierra Subida, Palmdale, CA 93550
MLS# SR26070610Listed by: CENTURY 21 MASTERS $450,022.22Active3 beds 2 baths1,054 sq. ft.
38251 Lisman Avenue, Palmdale, CA 93550
MLS# 226001493Listed by: KELLER WILLIAMS EXCLUSIVE PROPERTIES $485,750Active4 beds 2 baths1,707 sq. ft.
2528 Poker Plant Court, Palmdale, CA 93550
MLS# 26002649Listed by: CENTURY 21 MASTERS $409,000Active3 beds 2 baths2,106 sq. ft.
37755 Lasker, Palmdale, CA 93550
MLS# SR26069447Listed by: KELLER WILLIAMS REALTY ANTELOPE VALLEY $405,000Pending2 beds 2 baths937 sq. ft.
2634 Nandina Drive, Palmdale, CA 93550
MLS# SR26069615Listed by: EXP REALTY OF CALIFORNIA INC $685,000Active5 beds 3 baths2,652 sq. ft.
38018 Periwinkle Place, Palmdale, CA 93550
MLS# 26002597Listed by: EXP REALTY OF GREATER LOS ANGELES, INC. $409,000Active3 beds 2 baths2,106 sq. ft.
37755 Lasker, Palmdale, CA 93550
MLS# SR26069447Listed by: KELLER WILLIAMS REALTY ANTELOPE VALLEY $430,000Pending3 beds 3 baths2,076 sq. ft.
37109 Zinnia, Palmdale, CA 93550
MLS# CRSR26068571Listed by: NEXT REAL ESTATE GROUP $2,500,000Active8.95 Acres
E Vac/30th Ste Pav Vic Ave #r Street, Palmdale, CA 93550
MLS# 26002583Listed by: BERKSHIRE HATHAWAY HOMESERVICES TROTH, REALTORS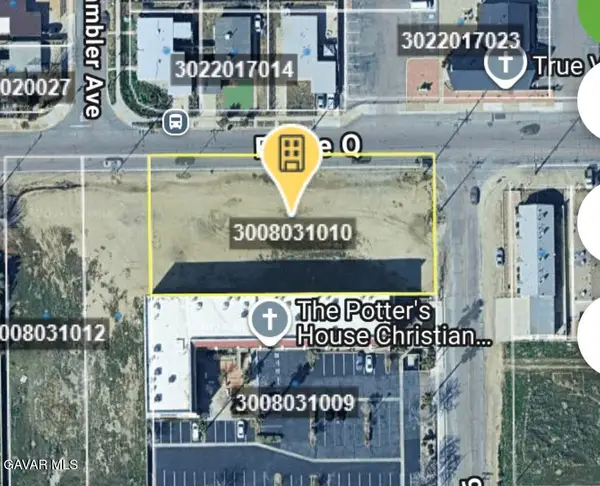 $70,000Pending0.74 Acres
38773 E 9th Street, Palmdale, CA 93550
MLS# 26002580Listed by: PACIFIC BLUE, INC. $465,000Active4 beds 2 baths1,806 sq. ft.
38453 3rd Street, Palmdale, CA 93550
MLS# 26671019Listed by: EQUITY UNION $299,999Active4 beds 2 baths1,528 sq. ft.
1750 E Avenue Q14, Palmdale, CA 93550
MLS# SR26067302Listed by: REAL BROKER $347,000Active2 beds 2 baths978 sq. ft.
3140 E Avenue Q15, Palmdale, CA 93550
MLS# SR26066177Listed by: RE/MAX ALL-PRO $299,999Active3 beds 2 baths1,528 sq. ft.
1750 E Avenue Q14 #Apt 10, Palmdale, CA 93550
MLS# 26002531Listed by: REAL BROKERAGE TECHNOLOGIES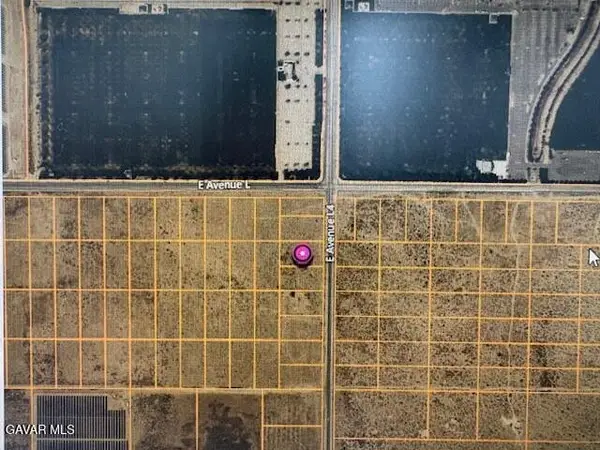 $79,900Active1.13 Acres
30th St E Vic Ave L, Palmdale, CA 93552
MLS# 26002522Listed by: COLDWELL BANKER-A HARTWIG CO. $819,400Pending3 beds 3 baths2,224 sq. ft.
1721 Carson Mesa, Palmdale, CA 93550
MLS# SR26064337Listed by: KELLER WILLIAMS HOLLYWOOD HILLS $550,000Pending3 beds 3 baths2,520 sq. ft.
33456 Angeles Forest Highway, Palmdale, CA 93550
MLS# 26002440Listed by: AMIGO REAL ESTATE $599,950Pending5 beds 4 baths1,943 sq. ft.
38465 12th Street, Palmdale, CA 93550
MLS# CRSR26062625Listed by: PINNACLE ESTATE PROPERTIES $50,000Active0.21 Acres
28th Ste Vic Avenue R8, Palmdale, CA 93550
MLS# 26002409Listed by: KELLER WILLIAMS REALTY A.V. $424,999Pending4 beds 2 baths1,631 sq. ft.
1720 Sweetbrier, Palmdale, CA 93550
MLS# SR26062902Listed by: HOPE REALTY SERVICES INC.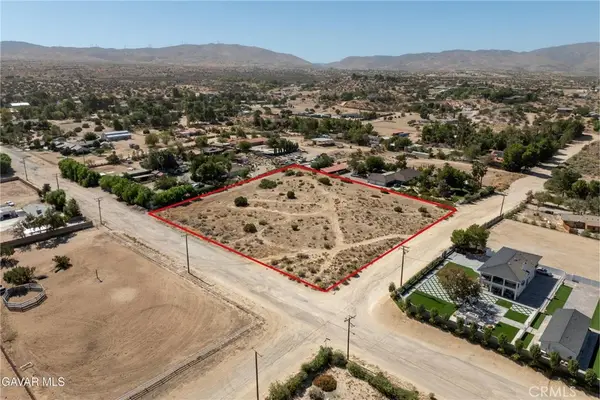 $175,000Active2.52 Acres
0 T2 & 37th St E, Palmdale, CA 93550
MLS# SR26062627Listed by: COLDWELL BANKER HARTWIG $175,000Active2.52 Acres
Cor Ave T2 37th Ste, Palmdale, CA 93550
MLS# 26002379Listed by: COLDWELL BANKER-A HARTWIG CO.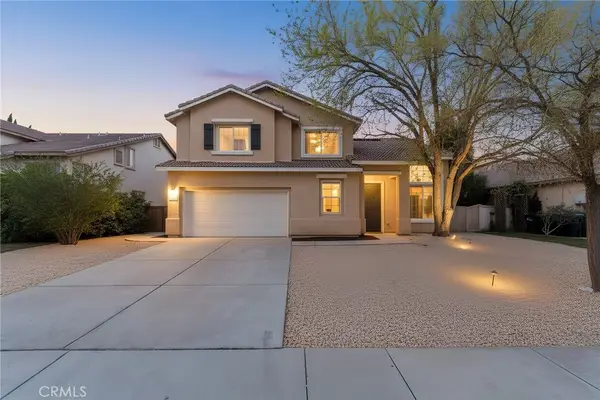 $599,990Active5 beds 4 baths3,210 sq. ft.
38718 Sienna Court, Palmdale, CA 93550
MLS# SR26061489Listed by: PANTHEON REALTY CORPORATION $514,900Active3 beds 3 baths1,995 sq. ft.
37441 Mayfield Court, Palmdale, CA 93550
MLS# SR26061307Listed by: BERKSHIRE HATHAWAY HOMESERVICE $250,000Active10.01 Acres
0 Richte Ln Vic Angeles Fo, Acton, CA 93510
MLS# DW26061130Listed by: CENTURY 21 LOTUS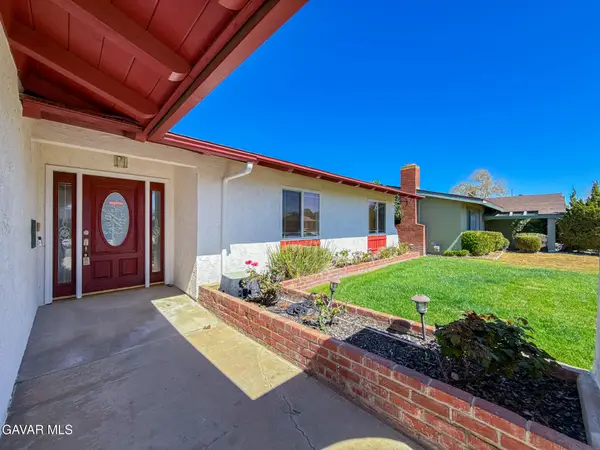 $534,900Active4 beds 2 baths2,082 sq. ft.
2535 E Avenue R-3, Palmdale, CA 93550
MLS# 26002300Listed by: CENTURY 21 MASTERS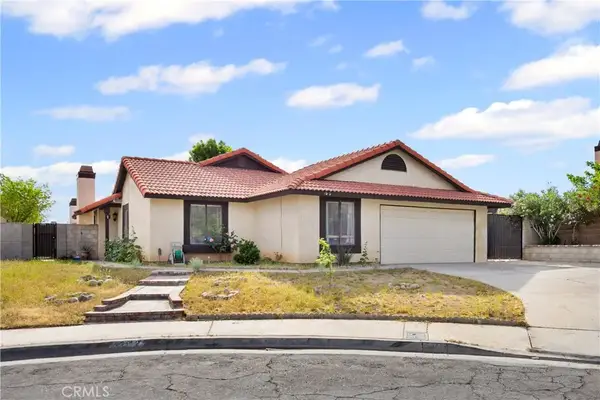 $469,900Active4 beds 2 baths1,274 sq. ft.
37112 Calle Amigo, Palmdale, CA 93550
MLS# IV26060326Listed by: ONE WEST REALTY $450,000Active4 beds 3 baths1,698 sq. ft.
37730 Scomar, Palmdale, CA 93550
MLS# SR26060077Listed by: BRUCE ALLEN LEVY $509,900Pending4 beds 3 baths1,622 sq. ft.
1631 Roseglen Place, Palmdale, CA 93550
MLS# 26002283Listed by: EXP REALTY OF GREATER LOS ANGELES, INC. $415,000Active3 beds 3 baths1,475 sq. ft.
40148 La Cota Drive, Palmdale, CA 93550
MLS# P1-26330Listed by: HOMESMART, EVERGREEN REALTY $500,000Active4 beds 3 baths2,034 sq. ft.
38633 Angele Trumpet Court, Palmdale, CA 93550
MLS# SR26057951Listed by: JOHNHART REAL ESTATE $495,000Pending3 beds 2 baths1,426 sq. ft.
130 Mountainside Drive, Palmdale, CA 93550
MLS# PW26057964Listed by: REAL BROKER $900,000Active2.13 Acres
2700 VAC E Palmdale Boulevard, Palmdale, CA 93550
MLS# 26664931Listed by: GOOD MEMBERS INVESTMENT $489,000Pending4 beds 3 baths1,978 sq. ft.
3828 Napa, Palmdale, CA 93550
MLS# SR26056754Listed by: CITIHOME $405,000Pending2 beds 3 baths1,519 sq. ft.
2648 Torres Court, Palmdale, CA 93550
MLS# 26002183Listed by: EXP REALTY OF CALIFORNIA, INC. $16,000Active0 Acres
804 E O East, Palmdale, CA 93591
MLS# HD26038021Listed by: OASIS REALTY GROUP $1,125,000Active4 beds 3 baths2,604 sq. ft.
2862 Calmgarden Road, Acton, CA 93510
MLS# SR26050929Listed by: HOMESMART EVERGREEN REALTY $399,998Active5 beds 2 baths1,716 sq. ft.
37841 Rudall, Palmdale, CA 93550
MLS# DW26042723Listed by: REAL BROKER $799,000Active0 Acres
0 96th, Palmdale, CA 93550
MLS# PW26052713Listed by: THE DOLE GROUP $100,000Active0 Acres
163 Avenue S, Palmdale, CA 93591
MLS# SR26054354Listed by: BEST REALTY & INVESTMENT, INC. $410,000Active2 beds 2 baths1,178 sq. ft.
3217 E Avenue S1, Palmdale, CA 93550
MLS# 26002116Listed by: REAL BROKERAGE TECHNOLOGIES $100,000Active0 Acres
165 E Avenue S, Palmdale, CA 93550
MLS# SR26053761Listed by: BEST REALTY & INVESTMENT, INC. $449,900Pending3 beds 3 baths1,687 sq. ft.
40432 Vereda Drive, Palmdale, CA 93550
MLS# CV26052476Listed by: EHOMES $558,000Active6 beds 2 baths1,338 sq. ft.
38513 32nd East, Palmdale, CA 93550
MLS# TR26052979Listed by: STARTRONIC REAL ESTATE $460,000Active3 beds 2 baths1,482 sq. ft.
37719 Nantucket Drive, Palmdale, CA 93550
MLS# SB26051993Listed by: HOME SMART REALTY GROUP $80,000Active0 Acres
0 Vac Harold 2nd St, Palmdale, CA 93550
MLS# SR26052953Listed by: GPC REALTY GROUP $449,900Pending3 beds 3 baths1,687 sq. ft.
40432 Vereda Drive, Palmdale, CA 93550
MLS# CV26052476Listed by: EHOMES $199,000Active1.65 Acres
0 Barrel Springs/ Lago Lindo, Palmdale, CA 93550
MLS# SR26052604Listed by: COLDWELL BANKER HARTWIG $120,000Active0 Acres
5 E Avenue R, Palmdale, CA 93550
MLS# DW26051012Listed by: FIRST FAMILY HOMES $499,999Active3 beds 2 baths1,336 sq. ft.
37623 Robin, Palmdale, CA 93550
MLS# RS26046454Listed by: EXCELLENCE RE REAL ESTATE $129,900Active2.14 Acres
E Palmdale Boulevard, Palmdale, CA 93550
MLS# 26001982Listed by: REAL BROKERAGE TECHNOLOGIES $565,000Active3 beds 3 baths2,270 sq. ft.
36861 37th East, Palmdale, CA 93550
MLS# OC26050183Listed by: HOMEQUEST REAL ESTATE $589,000Pending4 beds 2 baths1,558 sq. ft.
2725 Jojoba Ter, Palmdale, CA 93550
MLS# SR26047281Listed by: MISSION REAL ESTATE $126,000Active3 beds 3 baths1,296 sq. ft.
3524 E Avenue R #280, Palmdale, CA 93550
MLS# WS26043198Listed by: PINA REALTY $199,000Active1.65 Acres
E Vic Barrel # 14, Palmdale, CA 93550
MLS# 26001940Listed by: COLDWELL BANKER-A HARTWIG CO. $39,900Active0 Acres
0 Vac 30th St E, Palmdale, CA 93550
MLS# SR26047639Listed by: ENRG REALTY, INC $269,900Pending3 beds 2 baths1,156 sq. ft.
38710 E 10th Street #18, Palmdale, CA 93550
MLS# 26001926Listed by: KELLER WILLIAMS REALTY A.V. $41,000Active0 Acres
0 Ave S, Palmdale, CA 93951
MLS# SR26047862Listed by: SYNC BROKERAGE, INC. $79,999Active0 Acres
0 Barrel Springs, Palmdale, CA 93550
MLS# IV26046152Listed by: HOME & LAND SOURCE $100,000Active5.06 Acres
1800 Katee Lane, Palmdale, CA 93550
MLS# 26001856Listed by: CENTURY 21 DOUG ANDERSON $100,000Active20.29 Acres
1800 Richter Lane, Palmdale, CA 93550
MLS# 26001858Listed by: CENTURY 21 DOUG ANDERSON $749,000Active3 beds 2 baths1,932 sq. ft.
957 Sierra Hills Lane, Palmdale, CA 93550
MLS# GD26047071Listed by: WEALTHBRIDGE REAL ESTATE $69,900Pending0.19 Acres
Larkin Avenue S/o Ave Q # Q, Palmdale, CA 93550
MLS# 26001825Listed by: JPBROKER.COM $79,999Active4.93 Acres
Barrel Springs Road, Palmdale, CA 93550
MLS# 26001812Listed by: HOME & LAND SOURCE $25,000Active0.52 Acres
100 E 49th Street, Palmdale, CA 93550
MLS# 26658611Listed by: MAGNATE REALTY $399,000Active3 beds 2 baths1,136 sq. ft.
3243 E Avenue R4, Palmdale, CA 93550
MLS# DW26045907Listed by: CENTURY 21 ALLSTARS $279,900Active2 beds 2 baths853 sq. ft.
2554 Olive Drive #113, Palmdale, CA 93550
MLS# 26001789Listed by: LPT REALTY $469,990Pending4 beds 2 baths1,344 sq. ft.
3541 Acorde Avenue, Palmdale, CA 93550
MLS# 26001761Listed by: PANTHEON REALTY CORP. $109,999Active0 Acres
205 Avenue P, Palmdale, CA 93591
MLS# DW26044620Listed by: RESOLUTION BROKERS $429,999Pending3 beds 2 baths1,299 sq. ft.
1703 E Avenue R3, Palmdale, CA 93550
MLS# SR26043777Listed by: PINNACLE ESTATE PROPERTIES, INC. $385,000Active2.4 Acres
Cor 25th Ste Ave R12 Avenue, Palmdale, CA 93550
MLS# 26001723Listed by: JOHNHART REAL ESTATE $410,000Active3 beds 2 baths1,344 sq. ft.
3542 E Avenue R10, Palmdale, CA 93550
MLS# 26001706Listed by: PRESTIGIOUS REALTY, INC. $208,900Active0 Acres
200 Avenue R, Palmdale, CA 93591
MLS# SR26043202Listed by: SUNSHINE REALTY & ASSOCIATES $1,500,000Active0 Acres
15 Th St East, Palmdale, CA 93550
MLS# AR26042963Listed by: CENTURY 21 LUDECKE INC. $38,000Active1.28 Acres
0 W Ave L8, Palmdale, CA 93552
MLS# 26000433Listed by: HOME & LAND SOURCE $230,000Active3 beds 2 baths1,176 sq. ft.
1030 E Avenue Spc 130 South, Palmdale, CA 93550
MLS# SR26040679Listed by: CITIWIDE REALTY GROUP $425,000Active3 beds 3 baths1,600 sq. ft.
37711 San Ysidro, Palmdale, CA 93550
MLS# SR26040681Listed by: ORNELAS PROPERTIES $40,000Active1.25 Acres
On L-12 & 37th Street East, Palmdale, CA 93550
MLS# 26001608Listed by: WILLIAM RYAN REAL ESTATE $414,000Active4 beds 2 baths1,298 sq. ft.
38562 35th Street, Palmdale, CA 93550
MLS# 26001559Listed by: KELLER WILLIAMS REALTY A.V.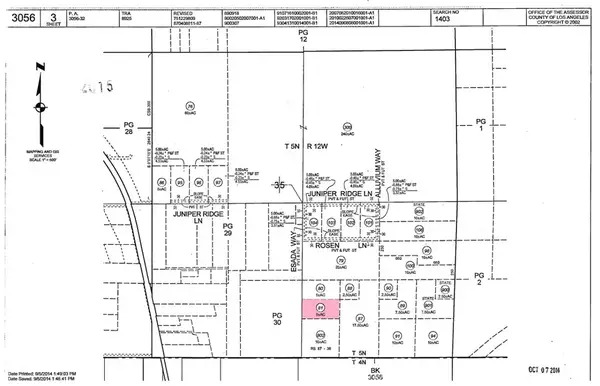 $35,000Active0 Acres
0 Esada Wy/rosen Ln, Acton, CA 93550
MLS# SR26036804Listed by: HOMEBASED REALTY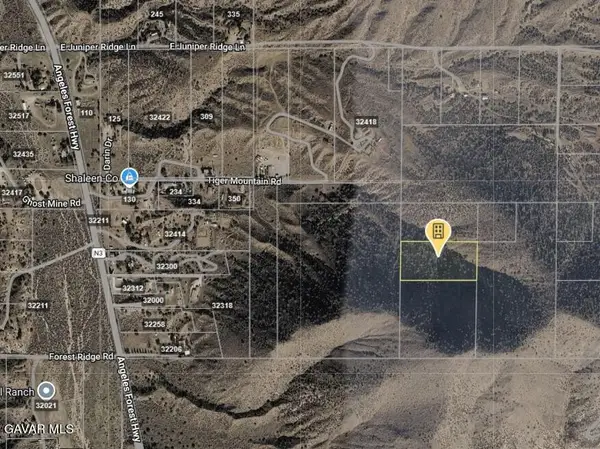 $35,000Active5 Acres
Esada Way, Palmdale, CA 93550
MLS# 26001438Listed by: HOMEBASED REALTY $270,000Active3 beds 3 baths1,156 sq. ft.
38710 10th Street E #Apt 15, Palmdale, CA 93550
MLS# 26001446Listed by: KELLER WILLIAMS REALTY A.V. $419,000Pending3 beds 2 baths1,125 sq. ft.
321 E Avenue R11, Palmdale, CA 93550
MLS# 26653233Listed by: KELLER WILLIAMS REALTY A.V. $55,000Active0.21 Acres
27th Ste Vic Ave R10, Palmdale, CA 93550
MLS# 26001399Listed by: JOHNHART REAL ESTATE $700,000Active0 Acres
0 Ave. Q2 X 10th St. East, Palmdale, CA 93550
MLS# NDP2601532Listed by: MARIA MATIENZO, BROKER $519,999Pending4 beds 3 baths1,766 sq. ft.
1147 Garnet Avenue, Palmdale, CA 93550
MLS# 26652613Listed by: REAL BROKER $126,000Active0.17 Acres
36447 Rozalee Drive, Palmdale, CA 93550
MLS# 26001283Listed by: DOMBROSKI REALTY $7,500Active2.52 Acres
83rd Street East & Avenue W8, Palmdale, CA 93550
MLS# 26001277Listed by: TOCCHINI REAL ESTATE $7,500Active2.52 Acres
83 rd Street East & Avenue W-8, Palmdale, CA 93550
MLS# 219143195DAListed by: TOCCHINI REAL ESTATE $419,999Active4 beds 2 baths1,192 sq. ft.
3102 E Avenue Q13, Palmdale, CA 93550
MLS# 26001239Listed by: AYDEN TYLER REALTY $9,995Active0 Acres
0 Nearby Black Butte Basin Rd/213th St E, Llano, CA 93544
MLS# SR26032304Listed by: CASTLESTONE PROPERTIES, INC. $439,900Active3 beds 2 baths1,064 sq. ft.
38738 36th Street East, Palmdale, CA 93550
MLS# SR26031422Listed by: BERKSHIRE HATHAWAY HOMESERVICES TROTH, REALTORS $580,000Pending4 beds 3 baths2,669 sq. ft.
37233 Weeping Branch Street, Palmdale, CA 93550
MLS# 26001177Listed by: LPT REALTY $533,900Pending4 beds 3 baths2,196 sq. ft.
36501 Crimson Court, Palmdale, CA 93550
MLS# 26001165Listed by: LPT REALTY $399,997Active2 beds 2 baths960 sq. ft.
33452 Angeles Forest, Palmdale, CA 93550
MLS# SR26030026Listed by: Z REAL ESTATE $280,000Pending3 beds 3 baths1,475 sq. ft.
40209 Casillo Road, Palmdale, CA 93550
MLS# 26001122Listed by: REAL BROKERAGE TECHNOLOGIES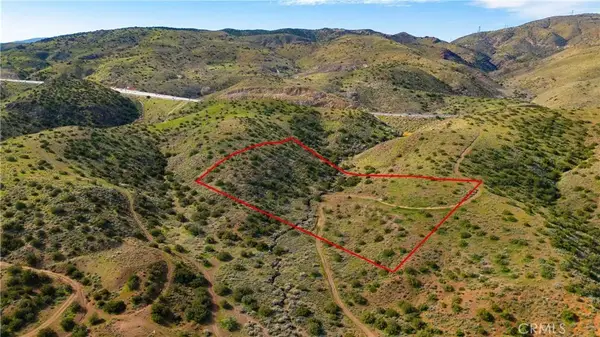 $44,500Active0 Acres
0 Courson Ranch Road, Palmdale, CA 93550
MLS# SR26029317Listed by: KELLER WILLIAMS REALTY ANTELOPE VALLEY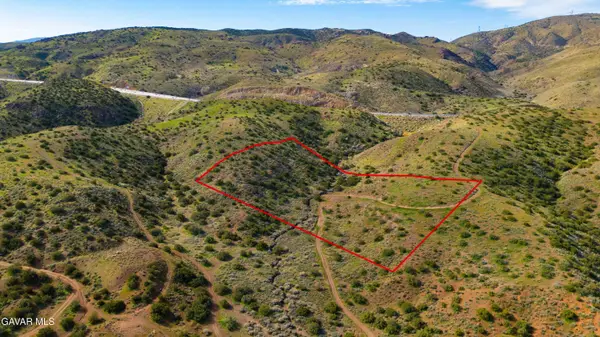 $44,500Active5 Acres
0 W1/2 Of Ne Of Sw 1/4 Of Nw 1/4, Palmdale, CA 93550
MLS# 26001099Listed by: KELLER WILLIAMS REALTY A.V.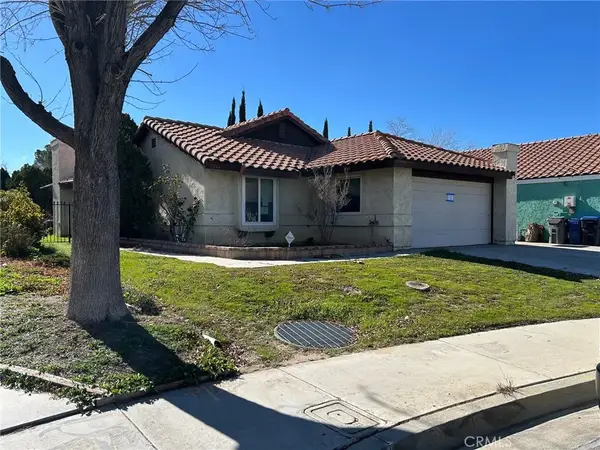 $394,000Pending3 beds 2 baths1,229 sq. ft.
3244 E Avenue S2, Palmdale, CA 93550
MLS# CV26028114Listed by: CROWN ROYAL REAL ESTATE, INC.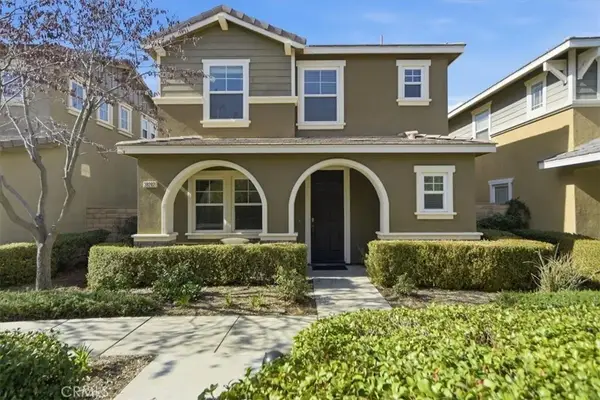 $429,950Active3 beds 3 baths1,854 sq. ft.
38202 Mendocino Way, Palmdale, CA 93550
MLS# SR26027414Listed by: RBS REALTY $529,999Pending4 beds 3 baths1,922 sq. ft.
37323 Daybreak Street, Palmdale, CA 93550
MLS# SR26027874Listed by: EXP REALTY OF GREATER LOS ANGELES, INC.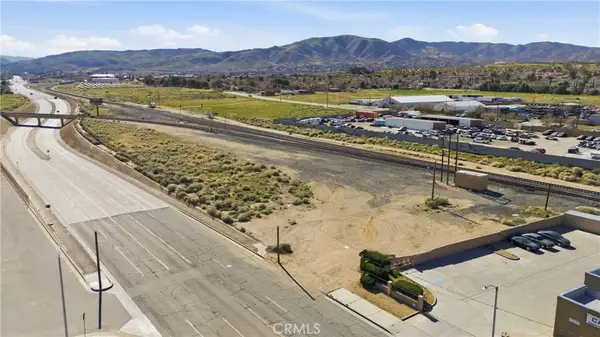 $180,000Active0 Acres
0 Sierra Hwy, Palmdale, CA 93550
MLS# WS26024893Listed by: THE REAL ESTATE CLUB $180,000Active1 Acres
Sierra Highway # R4, Palmdale, CA 93550
MLS# 26000919Listed by: THE REAL ESTATE CLUB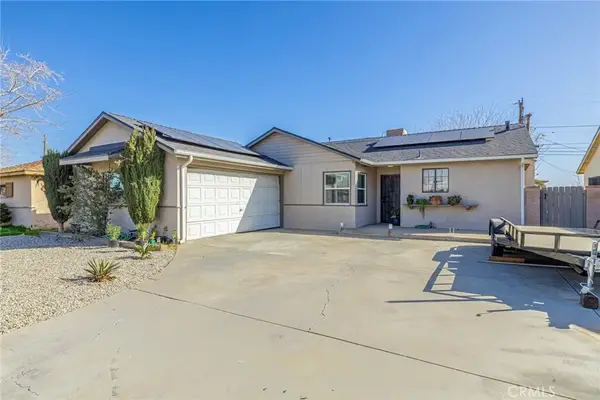 $421,000Active3 beds 2 baths1,167 sq. ft.
38738 Puerta Ave, Palmdale, CA 93550
MLS# IG26094742Listed by: PONCE & PONCE REALTY, INC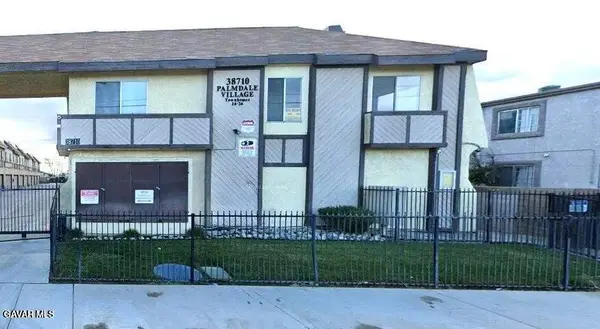 $299,995Active3 beds 3 baths1,156 sq. ft.
38710 E 10th Street #Apt 12, Palmdale, CA 93550
MLS# 26000839Listed by: RE/MAX ALL-PRO $275,000Active2 beds 1 baths925 sq. ft.
32301 Angeles Forest, Palmdale, CA 93550
MLS# CV26022098Listed by: PRIMETIME REALTY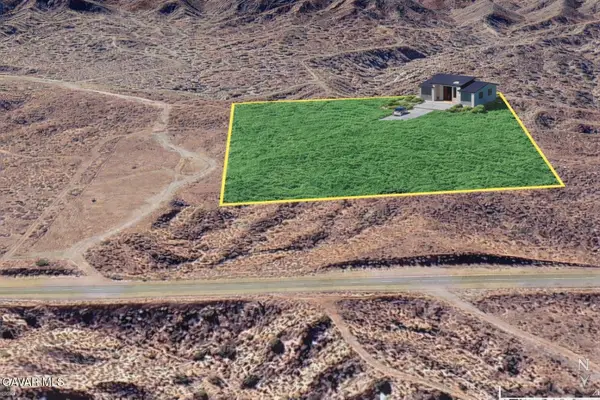 $40,000Active2.49 Acres
7300 E Vic Mt Emma & Weber Ranch Rd, Palmdale, CA 93550
MLS# 26000811Listed by: CENTURY 21 DOUG ANDERSON $475,000Active3 beds 2 baths1,551 sq. ft.
38511 Carolside, Palmdale, CA 93550
MLS# SR26021798Listed by: KELLER WILLIAMS REALTY ANTELOPE VALLEY $17,498Pending0 Acres
0 E Avenue N-8, Palmdale, CA 93550
MLS# IV26021176Listed by: HOME & LAND SOURCE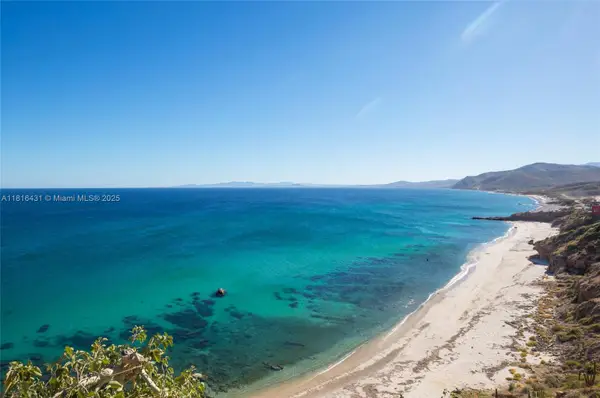 $5,500,000Active487.31 Acres
SAN FELIPE -RANCHO CALI SE Baja California, San Felipe, OS 23594
MLS# A11816431Listed by: MIAMI ZYR REALTY INC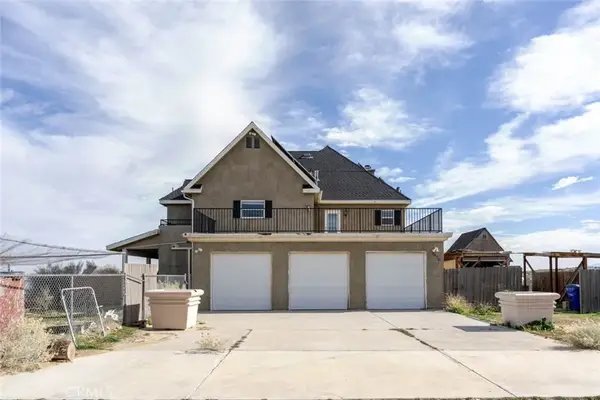 $799,000Active4 beds 3 baths3,085 sq. ft.
2575 Rale Drive, Palmdale, CA 93550
MLS# SR26019148Listed by: JOHNHART REAL ESTATE $800,000Active3 beds 1 baths924 sq. ft.
38657 Lilacview Avenue, Palmdale, CA 93550
MLS# 26000752Listed by: ANTELOPE VALLEY REAL ESTATE & ASSOCIATES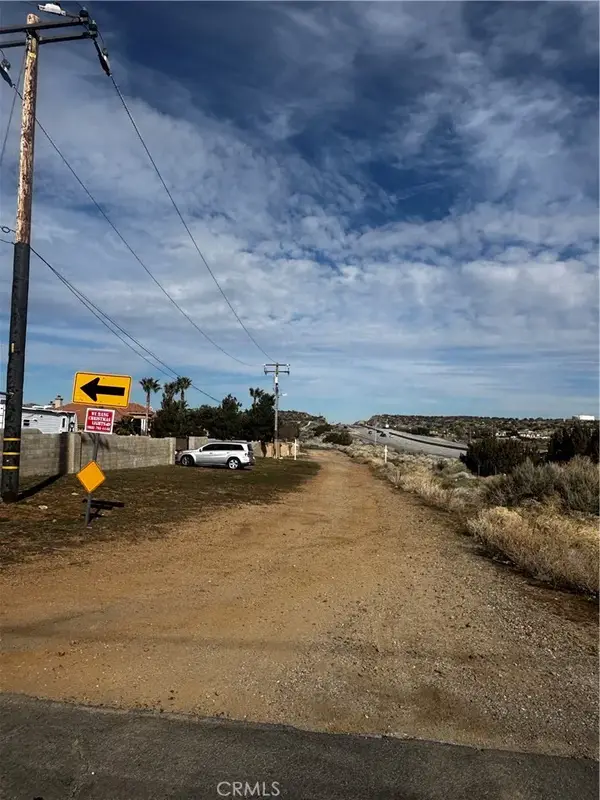 $35,000Active0 Acres
0 Ave S4 & El Camino., Palmdale, CA 93551
MLS# SR26018610Listed by: KELLER WILLIAMS REALTY ANTELOPE VALLEY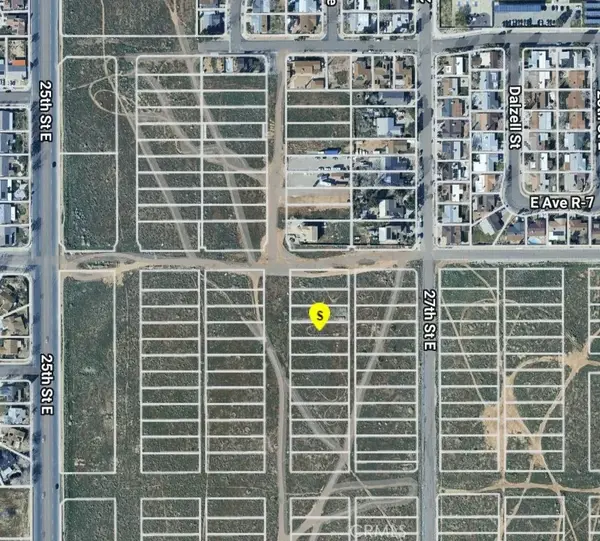 $54,000Active0 Acres
26 Ste/vic, Palmdale, CA 93550
MLS# SR26016834Listed by: EXP REALTY OF GREATER LOS ANGELES, INC. $54,000Active0.21 Acres
Vac/ 26th Ste Vic Ave #r8, Palmdale, CA 93550
MLS# 26000603Listed by: EXP REALTY OF GREATER LOS ANGELES, INC.
Local realty services provided by:CENTURY 21 Virginia Wilder Real Estate, CENTURY 21 Masters, CENTURY 21 Epic, CENTURY 21 Sierra Properties, CENTURY 21 Select Real Estate, Inc., CENTURY 21 Carioti
This information is deemed reliable but not guaranteed. You should rely on this information only to decide whether or not to further investigate a particular property. BEFORE MAKING ANY OTHER DECISION, YOU SHOULD PERSONALLY INVESTIGATE THE FACTS (e.g. square footage and lot size) with the assistance of an appropriate professional. You may use this information only to identify properties you may be interested in investigating further. All uses except for personal, non-commercial use in accordance with the foregoing purpose are prohibited. Redistribution or copying of this information, any photographs or video tours is strictly prohibited. This information is derived from the Internet Data Exchange (IDX) service provided by San Diego MLS®. Displayed property listings may be held by a brokerage firm other than the broker and/or agent responsible for this display. The information and any photographs and video tours and the compilation from which they are derived is protected by copyright. Compilation © 2020 San Diego MLS®, Inc. SANDICOR Member Broker: Randy Thompson
The information being provided by California Regional MLS (Southern California) is for the consumer's personal, non-commercial use and may not be used for any purpose other than to identify prospective properties consumer may be interested in purchasing. Any information relating to real estate for sale referenced on this web site comes from the Internet Data Exchange (IDX) program of the California Regional MLS (Southern California). CENTURY 21 Epic is not a Multiple Listing Service (MLS), nor does it offer MLS access. This website is a service of CENTURY 21 Epic, a broker participant of California Regional MLS (Southern California). This web site may reference real estate listing(s) held by a brokerage firm other than the broker and/or agent who owns this web site.
The accuracy of all information, regardless of source, including but not limited to open house information, square footages and lot sizes, is deemed reliable but not guaranteed and should be personally verified through personal inspection by and/or with the appropriate professionals. The data contained herein is copyrighted by California Regional MLS (Southern California) and is protected by all applicable copyright laws. Any unauthorized dissemination of this information is in violation of copyright laws and is strictly prohibited.
Copyright 2021 California Regional MLS (Southern California). All rights reserved. CRMLS Member Broker: Mike Southwick
MetroList MLS 2026. This information is being provided by MetroList MLS. All measurements and calculations of area are approximate. Information provided by Seller/Other sources, not verified by Broker. All interested persons should independently verify accuracy of information. Provided properties may or may not be listed by the office/agent presenting the information. Data Updated: June 5, 2026. Information being provided is for consumers' personal, non-commercial use and may not be used for any purpose other than to identify prospective properties consumers may be interested in purchasing. Information deemed reliable but not guaranteed. Any offer of compensation is made only to Participants of MLS where the subject listing is filed and in accordance with such MLS's regulations or rules. MFMLS Member Broker: Mike Southwick
Information deemed reliable but not guaranteed. Information is provided, in part, by Greater Miami MLS. This information being provided is for consumer's personal, non-commercial use and may not be used for any other purpose other than to identify prospective properties consumers may be interested in purchasing. SEFMLS Member Broker: Albert Carioti
Popular searches near 93550
Popular neighborhoods near 93550
- Antelope Valley Country Club Estates, Palmdale homes for sale
- Challenger, Lancaster homes for sale
- Columbia, Lancaster homes for sale
- Desert View Highlands, Palmdale homes for sale
- El Dorado, Lancaster homes for sale
- Joshua, Lancaster homes for sale
- Lake View Terrace, Sunland homes for sale
- Lincoln, Lancaster homes for sale
- Linda Verde, Lancaster homes for sale
- Lowtree, Lancaster homes for sale
- Parkview, Lancaster homes for sale
- Piute, Lancaster homes for sale
- Quartz Hill, Lancaster homes for sale
- Rancho Vista, Palmdale homes for sale
- South Downtown Lancaster, Lancaster homes for sale
- Tierra Bonita, Lancaster homes for sale
- Transit District, Lancaster homes for sale
- Trend, Lancaster homes for sale
- Tujunga, Tujunga homes for sale
- Yucca, Lancaster homes for sale
Counties near Palmdale, 93550
Protect your home and budget from life's surprises with an Assurant Home Warranty, backed by a partner that supports you through every step of homeownership. Explore Plans.
©2026 Century 21 Real Estate LLC. All rights reserved. CENTURY 21®, the CENTURY 21 Logo and C21® are service marks owned by Century 21 Real Estate LLC. Century 21 Real Estate LLC fully supports the principles of the Fair Housing Act and the Equal Opportunity Act. Each office is independently owned and operated. Listing information is deemed reliable but not guaranteed accurate.