- Belvedere Tiburon homes for sale
- Corte Madera homes for sale
- Fairfax homes for sale
- Greenbrae homes for sale
- Kentfield homes for sale
- Larkspur homes for sale
- Lucas Valley-Marinwood homes for sale
- Mill Valley homes for sale
- North Richmond homes for sale
- Richmond homes for sale
- Ross homes for sale
- Ross Valley homes for sale
- San Anselmo homes for sale
- San Rafael homes for sale
- Santa Venetia homes for sale
- Sleepy Hollow homes for sale
- Southeast Marin homes for sale
- Strawberry homes for sale
- Tamalpais-Homestead Valley homes for sale
- Woodacre homes for sale
94901, CA - homes for sale
108 of 108 results displayed
- New
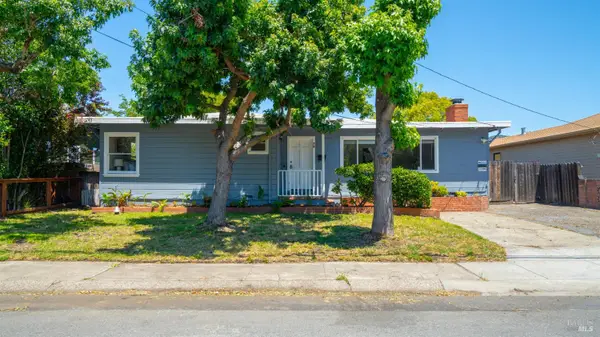
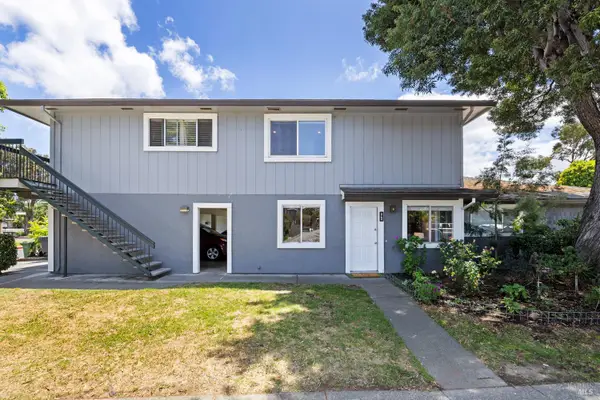 $410,000Active2 beds 1 baths903 sq. ft.
3704 Kerner Boulevard, San Rafael, CA 94901
MLS# 326046164Listed by: ABACUS REAL ESTATE - Open Sat, 1 to 4pmNew
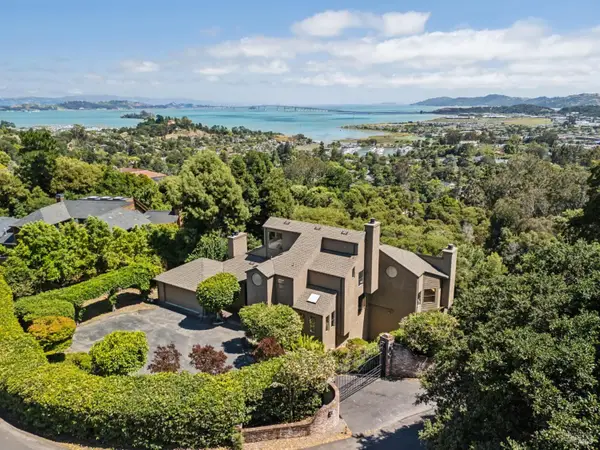
 $3,569,000Active6 beds 5 baths4,290 sq. ft.
80 Montecito Road, San Rafael, CA 94901
MLS# 326045891Listed by: COMPASS - New
 $2,495,000Active4 beds 4 baths2,571 sq. ft.
24 Dominican Drive, San Rafael, CA 94901
MLS# 326046555Listed by: GOLDEN GATE SOTHEBY'S INTERNATIONAL REALTY - Open Tue, 5 to 7pmNew
 $3,395,000Active6 beds 5 baths4,763 sq. ft.
310 Point San Pedro Road, San Rafael, CA 94901
MLS# 326045776Listed by: VANGUARD PROPERTIES - New
 $1,150,000Active3 beds 1 baths1,192 sq. ft.
833 Belle Avenue, San Rafael, CA 94901
MLS# 326046419Listed by: COMPASS - New
 $2,050,000Active4 beds 4 baths2,779 sq. ft.
115 Marina Boulevard, San Rafael, CA 94901
MLS# 326046245Listed by: COLDWELL BANKER REALTY - New
 $995,000Active2 beds 1 baths1,032 sq. ft.
708 Point San Pedro Road, San Rafael, CA 94901
MLS# 326046230Listed by: OWN MARIN  $1,075,000Pending4 beds 2 baths1,932 sq. ft.
210 Greenfield Avenue, San Anselmo, CA 94901
MLS# 326036806Listed by: COMPASS- New
 $1,400,000Active5 beds 3 baths2,080 sq. ft.
27 Latham Street, San Rafael, CA 94901
MLS# 326046089Listed by: GOLDEN GATE SOTHEBY'S INTERNATIONAL REALTY - New
 $1,275,000Active3 beds 3 baths2,244 sq. ft.
38 Bret Avenue, San Rafael, CA 94901
MLS# 326045515Listed by: GOLDEN GATE SOTHEBY'S INTERNATIONAL REALTY - New
 $2,695,000Active4 beds 4 baths3,216 sq. ft.
565 San Pedro Cove, San Rafael, CA 94901
MLS# 326045156Listed by: COMPASS - New
 $2,400,000Active5 beds 3 baths4,510 sq. ft.
260 Highland Avenue, San Rafael, CA 94901
MLS# 326045487Listed by: COMPASS  $1,549,000Pending4 beds 3 baths2,335 sq. ft.
129 Robinhood Drive, San Rafael, CA 94901
MLS# 326044026Listed by: COMPASS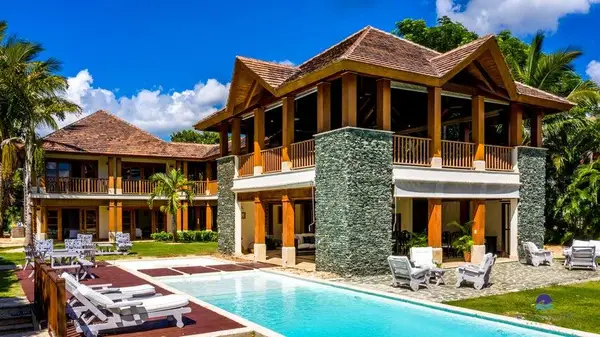 $3,500,000Active5 beds 6 baths8,773 sq. ft.
7a Bahia Chavon, ,
MLS# R11090903Listed by: TINA FANJUL ASSOCIATES, INC. $799,000Active2 beds 2 baths1,228 sq. ft.
50 Porto Bello Drive, OUT OF AREA, CA 94901
MLS# 26-662Listed by: COLDWELL BANKER REALTY $1,675,000Active4 beds 4 baths2,733 sq. ft.
1348 Grand Avenue, San Rafael, CA 94901
MLS# 326043697Listed by: COLDWELL BANKER REALTY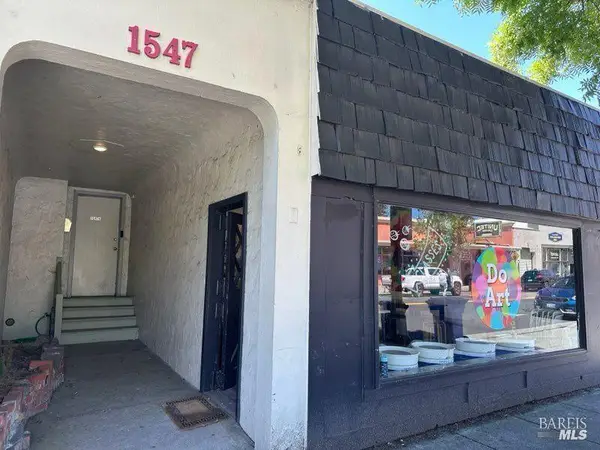 $999,000Active-- beds -- baths2,006 sq. ft.
1547 4th Street #A, San Rafael, CA 94901
MLS# 326043764Listed by: W REAL ESTATE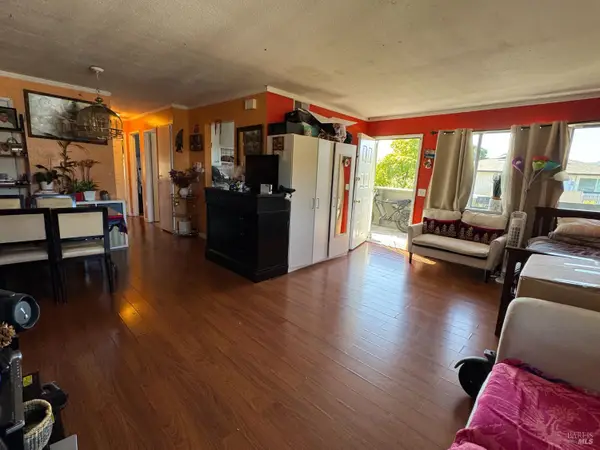 $419,500Active2 beds 1 baths840 sq. ft.
431 Bahia Way, San Rafael, CA 94901
MLS# 326040737Listed by: TRIN HONG REAL ESTATE INC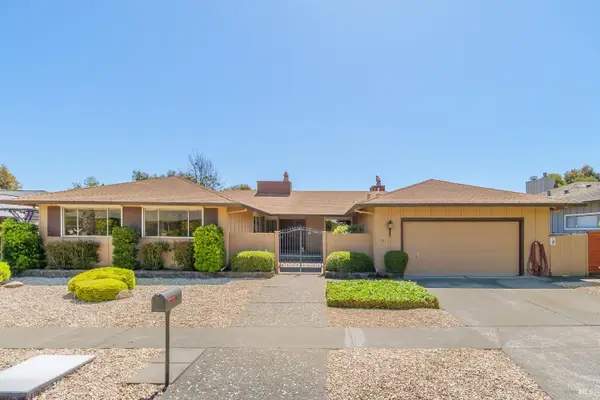 $1,495,000Pending4 beds 2 baths2,462 sq. ft.
132 Peacock Drive, San Rafael, CA 94901
MLS# 326043361Listed by: COLDWELL BANKER REALTY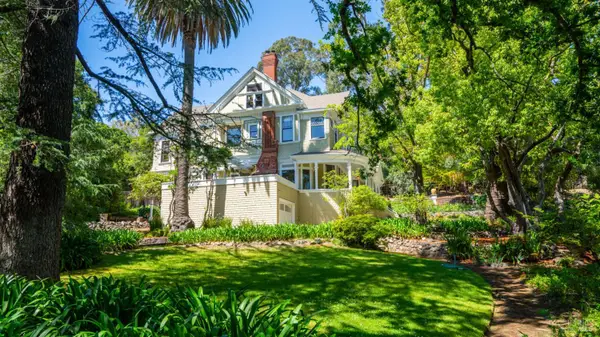 $2,595,000Pending5 beds 5 baths4,975 sq. ft.
27 Quarry Road, San Rafael, CA 94901
MLS# 326029459Listed by: COLDWELL BANKER REALTY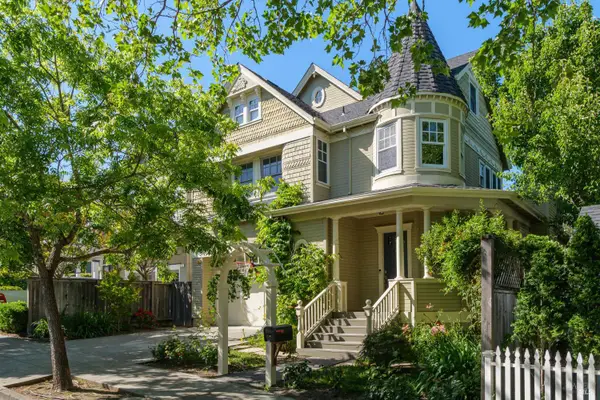 $2,995,000Active4 beds 3 baths3,836 sq. ft.
8 Center Street, San Rafael, CA 94901
MLS# 326041384Listed by: COMPASS $2,500,000Active4 beds 4 baths3,385 sq. ft.
91 Rollingwood Drive, San Rafael, CA 94901
MLS# 326041562Listed by: REDWOOD PROPERTY GROUP $2,495,000Active5 beds 3 baths2,596 sq. ft.
125 Convent Court, San Rafael, CA 94901
MLS# 326040735Listed by: COMPASS $460,000Active1 beds 1 baths738 sq. ft.
1579 Lincoln Avenue #103, San Rafael, CA 94901
MLS# 326039530Listed by: ENGEL & VOLKERS HEALDSBURG $1,174,990Active4 beds 2 baths2,072 sq. ft.
111 Altena Street, San Rafael, CA 94901
MLS# 326039992Listed by: GUIDE REAL ESTATE $2,295,000Pending4 beds 3 baths2,768 sq. ft.
10 Mcnear Drive, San Rafael, CA 94901
MLS# 326041713Listed by: GOLDEN GATE SOTHEBY'S INTERNATIONAL REALTY $849,000Pending1 beds 1 baths773 sq. ft.
12 Estates Court, San Rafael, CA 94901
MLS# 326038434Listed by: COMPASS $1,695,000Pending3 beds 3 baths2,254 sq. ft.
66 Marina Boulevard, San Rafael, CA 94901
MLS# 326041429Listed by: OWN MARIN $1,099,000Active5 beds 3 baths2,218 sq. ft.
44 Martens Boulevard, San Rafael, CA 94901
MLS# 326041651Listed by: COMPASS $1,670,000Active3 beds 3 baths2,310 sq. ft.
32 Alta Vista Way, San Rafael, CA 94901
MLS# 326039555Listed by: COMPASS $1,035,000Active2 beds 1 baths854 sq. ft.
234 Solano Street, San Rafael, CA 94901
MLS# 326041375Listed by: COLDWELL BANKER REALTY $3,450,000Pending5 beds 4 baths4,705 sq. ft.
21 Newhall Drive, San Rafael, CA 94901
MLS# 326040781Listed by: OWN MARIN $2,650,000Active4 beds 4 baths2,955 sq. ft.
43 La Crescenta Way, San Rafael, CA 94901
MLS# 326039998Listed by: THE HOUSE $1,050,000Pending2 beds 1 baths972 sq. ft.
135 Martens Boulevard, San Rafael, CA 94901
MLS# 326025120Listed by: BERKSHIRE HATHAWAY $1,449,000Active3 beds 4 baths2,012 sq. ft.
35 Hillview Avenue, San Rafael, CA 94901
MLS# 326040047Listed by: CORCORAN ICON PROPERTIES $2,398,000Active3 beds 3 baths3,175 sq. ft.
81 Peacock Drive, San Rafael, CA 94901
MLS# 326039488Listed by: COMPASS $1,760,000Active3 beds 3 baths2,924 sq. ft.
21 Woods Street, San Rafael, CA 94901
MLS# 326039216Listed by: COMPASS $975,000Active2 beds 2 baths1,865 sq. ft.
125 Knollwood Drive, San Rafael, CA 94901
MLS# 326038096Listed by: VANGUARD PROPERTIES $2,195,000Pending6 beds 4 baths3,499 sq. ft.
525 Belle Avenue, San Rafael, CA 94901
MLS# 326039638Listed by: THE AGENCY $895,000Pending3 beds 2 baths1,493 sq. ft.
111 C Street, San Rafael, CA 94901
MLS# 326038707Listed by: LOGIC INVESTMENTS, INC. $425,000Active2 beds 1 baths840 sq. ft.
247 Bahia Place, San Rafael, CA 94901
MLS# 326028846Listed by: BERKSHIRE HATHAWAY $2,149,000Active4 beds 3 baths2,976 sq. ft.
62 Oakdale Avenue, San Rafael, CA 94901
MLS# 326037179Listed by: COMPASS $695,000Active2 beds 2 baths1,122 sq. ft.
820 Mission Avenue #4, San Rafael, CA 94901
MLS# 326036978Listed by: REDFIN $1,695,000Pending3 beds 2 baths2,540 sq. ft.
17 Longwood Drive, San Rafael, CA 94901
MLS# 326029063Listed by: COMPASS $1,349,000Pending4 beds 2 baths1,456 sq. ft.
29 Windsor Avenue, San Rafael, CA 94901
MLS# 326008814Listed by: COLDWELL BANKER REALTY $579,000Pending2 beds 1 baths1,010 sq. ft.
1579 Lincoln Avenue #209, San Rafael, CA 94901
MLS# 326035966Listed by: COMPASS $1,048,000Active2 beds 2 baths1,316 sq. ft.
31 Martens Boulevard, San Rafael, CA 94901
MLS# 326035131Listed by: COLDWELL BANKER REALTY $585,000Active2 beds 2 baths1,280 sq. ft.
132 Tiburon Boulevard, San Rafael, CA 94901
MLS# 326028213Listed by: HOLMES BURRELL REAL ESTATE $3,150,000Active5 beds 4 baths4,095 sq. ft.
312 Fairhills Drive, San Rafael, CA 94901
MLS# 326034989Listed by: HOLMES BURRELL REAL ESTATE $2,325,000Pending4 beds 3 baths2,657 sq. ft.
351 G Street, San Rafael, CA 94901
MLS# 326028130Listed by: COLDWELL BANKER REALTY $289,000Active1 beds 1 baths646 sq. ft.
22 Fairfax Street #E, San Rafael, CA 94901
MLS# 326027955Listed by: COLDWELL BANKER REALTY $1,750,000Active4 beds 3 baths2,428 sq. ft.
1380 Grand Avenue, San Rafael, CA 94901
MLS# 326032790Listed by: CHRISTIE'S INT'L REAL ESTATE $2,895,000Active6 beds 6 baths4,747 sq. ft.
183 Reservoir Road, San Rafael, CA 94901
MLS# 326026163Listed by: COMPASS $1,099,000Active3 beds 3 baths2,100 sq. ft.
37 Greenside Way, San Rafael, CA 94901
MLS# 326028343Listed by: EXP REALTY OF CALIFORNIA, INC $5,500,000Active5 beds 5 baths4,930 sq. ft.
10 Morgan Lane, San Rafael, CA 94901
MLS# 326030922Listed by: COLDWELL BANKER REALTY $1,095,000Active-- beds -- baths1,960 sq. ft.
29 Leafwood Circle, San Rafael, CA 94901
MLS# 41130704Listed by: COLDWELL BANKER
 $1,799,000Active4 beds 5 baths3,237 sq. ft.
40 Villa Avenue, San Rafael, CA 94901
MLS# 326030110Listed by: GREEN VALLEY REALTY USA $1,050,000Active3 beds 2 baths1,764 sq. ft.
215 Bungalow Avenue, San Rafael, CA 94901
MLS# 326029361Listed by: COMPASS $1,995,000Active4 beds 4 baths2,416 sq. ft.
22 Clyde Avenue, San Rafael, CA 94901
MLS# 326029201Listed by: COMPASS $1,395,000Active5 beds 4 baths3,000 sq. ft.
138 Tamal Vista Drive, San Rafael, CA 94901
MLS# 326028566Listed by: COMPASS $699,000Pending4 beds 2 baths1,369 sq. ft.
11 San Rafael Avenue, San Rafael, CA 94901
MLS# 326016707Listed by: COLDWELL BANKER REALTY $1,395,000Active3 beds 3 baths2,251 sq. ft.
227 Coleman Drive, San Rafael, CA 94901
MLS# 326026745Listed by: COMPASS $1,349,000Active4 beds 3 baths2,650 sq. ft.
10 Capri Court, San Rafael, CA 94901
MLS# 326007644Listed by: BERKSHIRE HATHAWAY $995,000Active2 beds 1 baths1,300 sq. ft.
34 Fair Drive, San Rafael, CA 94901
MLS# 326026269Listed by: ROSS VALLEY REAL ESTATE $2,499,000Active2.04 Acres
0 Chula Vista Drive, San Rafael, CA 94901
MLS# 326024952Listed by: COMPASS $3,300,000Pending4 beds 5 baths4,517 sq. ft.
47 Main Drive, San Rafael, CA 94901
MLS# 326024932Listed by: COMPASS $1,425,000Active3 beds 3 baths2,495 sq. ft.
24 Mooring Road, San Rafael, CA 94901
MLS# 326023748Listed by: SOTHEBY'S INTERNATIONAL REALTY $899,000Active2 beds 2 baths1,234 sq. ft.
251 W End Avenue, San Rafael, CA 94901
MLS# 326024704Listed by: GOLDEN GATE SOTHEBY'S INTERNATIONAL REALTY $1,895,000Pending3 beds 3 baths2,407 sq. ft.
180 El Cerrito Avenue, San Rafael, CA 94901
MLS# 326022403Listed by: OWN MARIN $2,495,000Active5 beds 6 baths2,692 sq. ft.
282 Riviera Drive, San Rafael, CA 94901
MLS# 326022647Listed by: CITY REAL ESTATE $3,750,000Pending5 beds 6 baths5,900 sq. ft.
176 Highland Avenue, San Rafael, CA 94901
MLS# 326020773Listed by: GOLDEN GATE SOTHEBY'S INTERNATIONAL REALTY $2,750,000Pending5 beds 5 baths4,721 sq. ft.
30 Chateau Place, San Rafael, CA 94901
MLS# 326021753Listed by: HOLMES BURRELL REAL ESTATE $2,450,000Active-- beds -- baths4,720 sq. ft.
22 Mooring Road, San Rafael, CA 94901
MLS# 326033059Listed by: WESELY & ASSOCIATES $1,995,000Pending3 beds 3 baths1,839 sq. ft.
121 San Marino Drive, San Rafael, CA 94901
MLS# 326021083Listed by: ATHAS & ASSOCIATES REAL ESTATE, INC $3,450,000Active3 beds 3 baths5,130 sq. ft.
1380 Lincoln Avenue, San Rafael, CA 94901
MLS# 326020653Listed by: CITY REAL ESTATE $820,000Pending2 beds 1 baths892 sq. ft.
41 Meadow Avenue, San Rafael, CA 94901
MLS# 326013107Listed by: KELLER WILLIAMS REALTY $2,400,000Pending4 beds 4 baths2,700 sq. ft.
1820 Point San Pedro Road, San Rafael, CA 94901
MLS# 326012021Listed by: ROSE BOOTH REALTY $1,295,000Active2 beds 2 baths1,228 sq. ft.
24 Porto Bello Drive, San Rafael, CA 94901
MLS# 326019908Listed by: COMPASS $2,995,000Pending4 beds 4 baths3,950 sq. ft.
99 Deer Park Avenue, San Rafael, CA 94901
MLS# 326017871Listed by: GOLDEN GATE SOTHEBY'S INTERNATIONAL REALTY $949,950Active3 beds 3 baths1,822 sq. ft.
13 Heron Court, San Rafael, CA 94901
MLS# 326018480Listed by: LEGEND REAL ESTATE $1,150,000Active2 beds 1 baths817 sq. ft.
241 Humboldt St, San Rafael, CA 94901
MLS# 41126062Listed by: HOMECOIN.COM $2,488,000Active4 beds 4 baths3,172 sq. ft.
43 Baywood Terrace, San Rafael, CA 94901
MLS# ML82018422Listed by: COMPASS $699,000Pending3 beds 2 baths1,579 sq. ft.
1851 5th Avenue, San Rafael, CA 94901
MLS# 326015369Listed by: HOLMES BURRELL REAL ESTATE $899,000Pending2 beds 3 baths1,560 sq. ft.
111 Nantucket Cove, San Rafael, CA 94901
MLS# 326015462Listed by: KW ADVISORS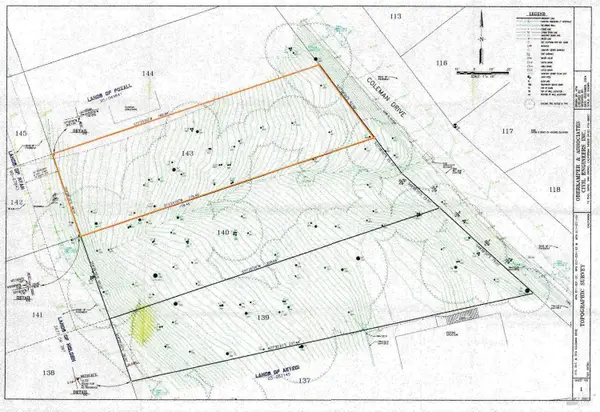 $135,000Active0.19 Acres
317 Coleman Drive, San Rafael, CA 94901
MLS# 326015231Listed by: BERKSHIRE HATHAWAY $425,000Active0.34 Acres
59 , 60 Clayton St., San Rafael, CA 94901
MLS# 41124872Listed by: BAY AREA MODERN REAL ESTATE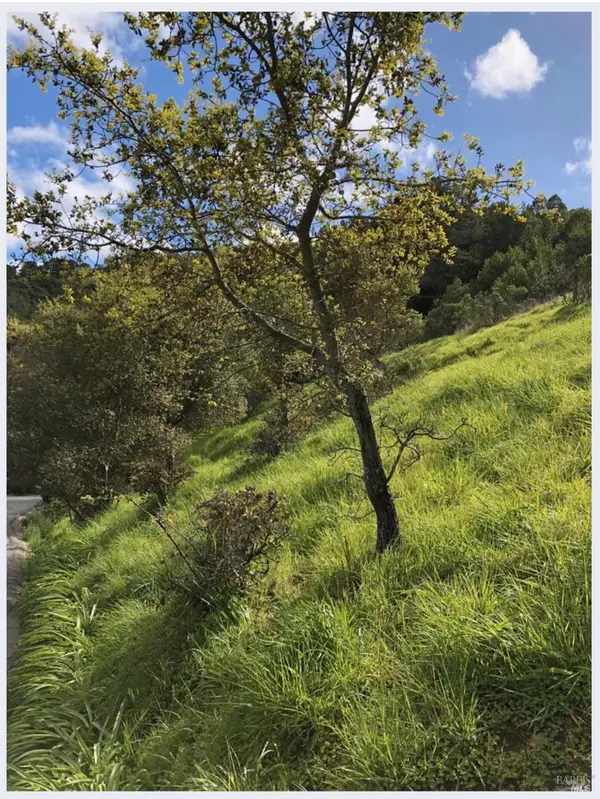 $100,000Active0.23 Acres
0 Coleman Drive, San Rafael, CA 94901
MLS# 326011947Listed by: KELLER WILLIAMS REALTY $1,595,000Active4 beds 3 baths2,377 sq. ft.
60 Marina Court Drive, San Rafael, CA 94901
MLS# 326002154Listed by: SOTHEBY'S INTERNATIONAL REALTY $1,395,000Pending6 beds 3 baths2,754 sq. ft.
29 Frances Street, San Rafael, CA 94901
MLS# 326004733Listed by: GOLDEN GATE SOTHEBY'S INTERNATIONAL REALTY $3,495,000Pending6 beds 6 baths4,687 sq. ft.
42 Grove Street, San Rafael, CA 94901
MLS# 326006720Listed by: GOLDEN GATE SOTHEBY'S INTERNATIONAL REALTY $1,510,000Active-- beds -- baths
1836 5th Ave, San Rafael, CA 94901
MLS# 41120655Listed by: BHHS DRYSDALE PROPERTIES $74,950Active1 beds 1 baths377 sq. ft.
742 Francisco W Boulevard #B12, San Rafael, CA 94901
MLS# 326001969Listed by: HARMONY COMMUNITIES, INC. $2,100,000Active-- beds -- baths9,999 sq. ft.
92 Elizabeth Way, San Rafael, CA 94901
MLS# 326000817Listed by: MARSHALL & CO PROP MGMNT INC $425,000Pending2 beds 1 baths840 sq. ft.
207 Bahia Place, San Rafael, CA 94901
MLS# 325086554Listed by: BERKSHIRE HATHAWAY $750,000Pending2 beds 2 baths1,366 sq. ft.
39 Latham Street, San Rafael, CA 94901
MLS# 325101121Listed by: BERKSHIRE HATHAWAY $1,395,000Active3 beds 3 baths1,556 sq. ft.
28 Marina Court Dr, San Rafael, CA 94901
MLS# 41120852Listed by: COMPASS $1,195,000Active2 beds 2 baths1,228 sq. ft.
20 Porto Bello Drive, San Rafael, CA 94901
MLS# 326018881Listed by: GOLDEN GATE SOTHEBY'S INTERNATIONAL REALTY $143,000Active0.16 Acres
57 Fair Drive, San Rafael, CA 94901
MLS# 326020630Listed by: COMPASS $5,100,000Active6 beds 7 baths6,431 sq. ft.
220 Deer Park Avenue, San Rafael, CA 94901
MLS# 325085574Listed by: COMPASS $759,000Pending2 beds 2 baths1,569 sq. ft.
226 Bayview Street, San Rafael, CA 94901
MLS# 325085399Listed by: CORCORAN ICON PROPERTIES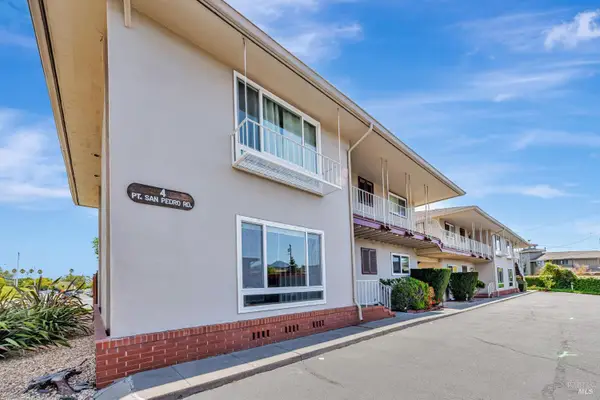 $550,000Active2 beds 2 baths1,250 sq. ft.
4 Point San Pedro Road #4, San Rafael, CA 94901
MLS# 325079463Listed by: COLDWELL BANKER REALTY $625,000Active1 beds 1 baths940 sq. ft.
820 Mission Avenue #7, San Rafael, CA 94901
MLS# 326001749Listed by: COLDWELL BANKER REALTY $165,000Active0.16 Acres
59 Fair Drive, San Rafael, CA 94915
MLS# 325072620Listed by: BERKSHIRE HATHAWAY $165,000Active0.24 Acres
0 Fair Drive, San Rafael, CA 94901
MLS# 325072555Listed by: BERKSHIRE HATHAWAY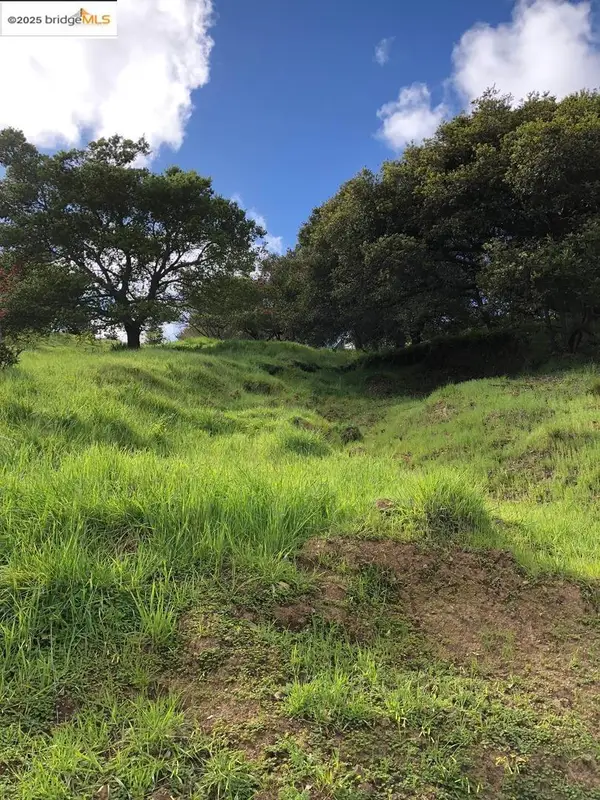 $1,310,000Active0.23 Acres
Address Withheld By Seller, San Rafael, CA 94901
MLS# 41104832Listed by: HOMECOIN.COM $1,310,000Active0.23 Acres
Address Withheld By Seller, San Rafael, CA 94901
MLS# 41104832Listed by: HOMECOIN.COM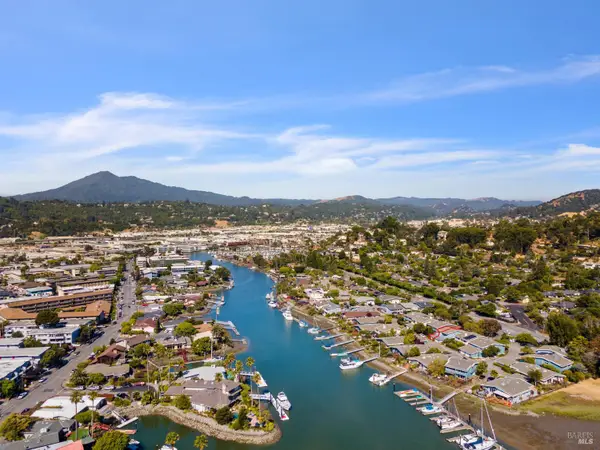 $699,000Active2 beds 3 baths1,408 sq. ft.
29 Porto Bello Drive, San Rafael, CA 94901
MLS# 326029304Listed by: GOLDEN GATE SOTHEBY'S INTERNATIONAL REALTY $105,000Active0.13 Acres
51 El Camino Avenue, San Rafael, CA 94901
MLS# 325091293Listed by: COMPASS
Local realty services provided by:CENTURY 21 Baldini Real Estate, Inc., CENTURY 21 Epic, CENTURY 21 All Professional, CENTURY 21 Masters, CENTURY 21 Select Real Estate, Inc., CENTURY 21 Classic Estates
The information being provided by San Francisco Association of REALTORS is for the consumer's personal, non-commercial use and may not be used for any purpose other than to identify prospective properties consumer may be interested in purchasing. Any information relating to real estate for sale referenced on this web site comes from the Internet Data Exchange (IDX) program of the San Francisco Association of REALTORS. This web site may reference real estate listing(s) held by a brokerage firm other than the broker and/or agent who owns this web site. The accuracy of all information, regardless of source, including but not limited to open house information, square footages and lot sizes, is deemed reliable but not guaranteed and should be personally verified through personal inspection by and/or with the appropriate professionals. The data contained herein is copyrighted by San Francisco Association of REALTORS and is protected by all applicable copyright laws. Any unauthorized dissemination of this information is in violation of copyright laws and is strictly prohibited.
The information being provided by Bay Area Real Estate Information Service is for the consumer's personal, non-commercial use and may not be used for any purpose other than to identify prospective properties consumer may be interested in purchasing. Any information relating to real estate for sale referenced on this web site comes from the Internet Data Exchange (IDX) program of the Bay Area Real Estate Information Service. CENTURY 21 Epic is not a Multiple Listing Service (MLS), nor does it offer MLS access. This website is a service of CENTURY 21 Epic, a broker participant of Bay Area Real Estate Information Service. This web site may reference real estate listing(s) held by a brokerage firm other than the broker and/or agent who owns this web site.
The accuracy of all information, regardless of source, including but not limited to open house information, square footages and lot sizes, is deemed reliable but not guaranteed and should be personally verified through personal inspection by and/or with the appropriate professionals. The data contained herein is copyrighted by Bay Area Real Estate Information Service and is protected by all applicable copyright laws. Any unauthorized dissemination of this information is in violation of copyright laws and is strictly prohibited.
Properties in listings may have been sold or may no longer be available.
Copyright 2026 Bay Area Real Estate Information Service. All rights reserved. CABAREIS Member Broker: Mike Southwick
Bay East 2026. CCAR 2026 bridgeMLS 2026. Information Deemed Reliable But Not Guaranteed. This information is being provided by the Bay East MLS, or CCAR MLS, or bridgeMLS. The listings presented here may or may not be listed by the Broker/Agent operating this website. This information is intended for the personal use of consumers and may not be used for any purpose other than to identify prospective properties consumers may be interested in purchasing. Data last updated at May 28, 2026 CAMAXMLS Member Broker: Mike Southwick
MetroList MLS 2026. This information is being provided by MetroList MLS. All measurements and calculations of area are approximate. Information provided by Seller/Other sources, not verified by Broker. All interested persons should independently verify accuracy of information. Provided properties may or may not be listed by the office/agent presenting the information. Data Updated: May 30, 2026. Information being provided is for consumers' personal, non-commercial use and may not be used for any purpose other than to identify prospective properties consumers may be interested in purchasing. Information deemed reliable but not guaranteed. Any offer of compensation is made only to Participants of MLS where the subject listing is filed and in accordance with such MLS's regulations or rules. MFMLS Member Broker: Mike Southwick
The information being provided by California Regional MLS (Southern California) is for the consumer's personal, non-commercial use and may not be used for any purpose other than to identify prospective properties consumer may be interested in purchasing. Any information relating to real estate for sale referenced on this web site comes from the Internet Data Exchange (IDX) program of the California Regional MLS (Southern California). CENTURY 21 Classic Estates is not a Multiple Listing Service (MLS), nor does it offer MLS access. This website is a service of CENTURY 21 Classic Estates, a broker participant of California Regional MLS (Southern California). This web site may reference real estate listing(s) held by a brokerage firm other than the broker and/or agent who owns this web site.
The accuracy of all information, regardless of source, including but not limited to open house information, square footages and lot sizes, is deemed reliable but not guaranteed and should be personally verified through personal inspection by and/or with the appropriate professionals. The data contained herein is copyrighted by California Regional MLS (Southern California) and is protected by all applicable copyright laws. Any unauthorized dissemination of this information is in violation of copyright laws and is strictly prohibited.
Copyright 2021 California Regional MLS (Southern California). All rights reserved. CRMLS Member Broker: Sol Almarines
Popular searches near 94901
Popular neighborhoods near 94901
- Bayfront - Enchanted Knolls - Shelter Ridge, Mill Valley homes for sale
- Blithedale Canyon, Mill Valley homes for sale
- Chapman Park, Corte Madera homes for sale
- Dominican, San Rafael homes for sale
- Downtown San Rafael, San Rafael homes for sale
- Fairhills, San Rafael homes for sale
- Gerstle Park, San Rafael homes for sale
- Glenwood, San Rafael homes for sale
- Greenbrae, Greenbrae homes for sale
- Homestead Valley, Mill Valley homes for sale
- Peacock Gap, San Rafael homes for sale
- San Anselmo, San Anselmo homes for sale
- San Rafael, San Rafael homes for sale
- San Rafael Country Club, San Rafael homes for sale
- Sleepy Hollow, San Anselmo homes for sale
- Smith Ranch, San Rafael homes for sale
- South Larkspur, Larkspur homes for sale
- Southwest Larkspur, Larkspur homes for sale
- Terra Linda, San Rafael homes for sale
- Warner Canyon - Kite Hill, Mill Valley homes for sale
Counties near San Rafael, 94901
- Alameda County homes for sale
- Colusa County homes for sale
- Contra Costa County homes for sale
- Lake County homes for sale
- Marin County homes for sale
- Napa County homes for sale
- Sacramento County homes for sale
- San Francisco County homes for sale
- San Joaquin County homes for sale
- San Mateo County homes for sale
- Santa Clara County homes for sale
- Santa Cruz County homes for sale
- Solano County homes for sale
- Sonoma County homes for sale
- Stanislaus County homes for sale
- Sutter County homes for sale
- Yolo County homes for sale
Protect your home and budget from life's surprises with an Assurant Home Warranty, backed by a partner that supports you through every step of homeownership. Explore Plans.
©2026 Century 21 Real Estate LLC. All rights reserved. CENTURY 21®, the CENTURY 21 Logo and C21® are service marks owned by Century 21 Real Estate LLC. Century 21 Real Estate LLC fully supports the principles of the Fair Housing Act and the Equal Opportunity Act. Each office is independently owned and operated. Listing information is deemed reliable but not guaranteed accurate.