- Acampo homes for sale
- August homes for sale
- Collierville homes for sale
- Country Club homes for sale
- Dogtown homes for sale
- Garden Acres homes for sale
- Kennedy homes for sale
- Lathrop homes for sale
- Lincoln Village homes for sale
- Linden homes for sale
- Linden-Farmington homes for sale
- Lockeford homes for sale
- Lodi homes for sale
- Manteca homes for sale
- Morada homes for sale
- Peters homes for sale
- Ripon homes for sale
- Stockton homes for sale
- Terminous homes for sale
- Woodbridge homes for sale
95205, CA - homes for sale
80 of 80 results displayed
- New
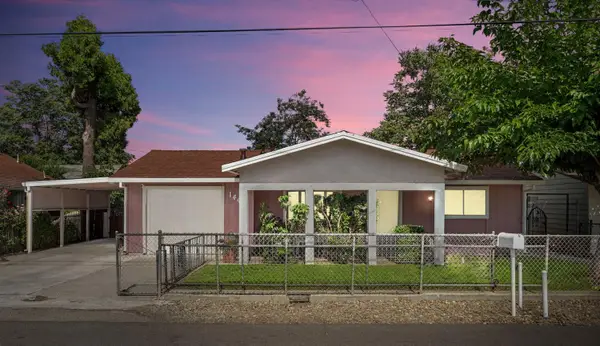
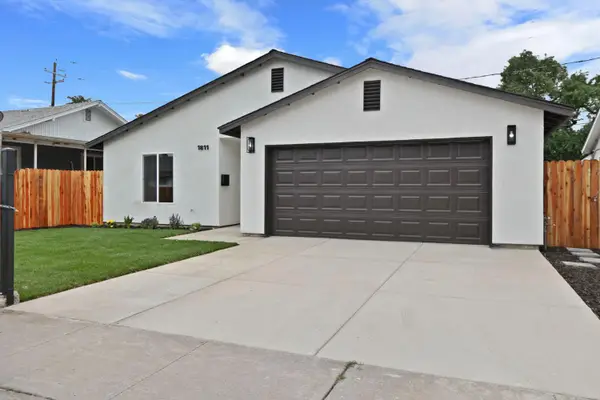 $500,000Active3 beds 2 baths1,507 sq. ft.
1811 N Stanford Avenue, Stockton, CA 95205
MLS# 226057560Listed by: PMZ REAL ESTATE - New
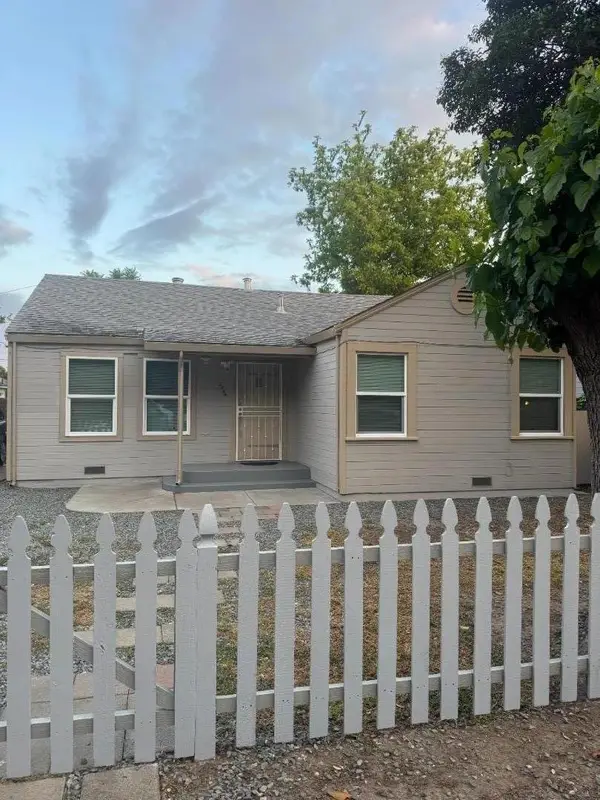
 $700,000Active3 beds 2 baths1,463 sq. ft.
3639 S Pock Lane, Stockton, CA 95205
MLS# 226057192Listed by: BRIAN A. MERRION, BROKER - New
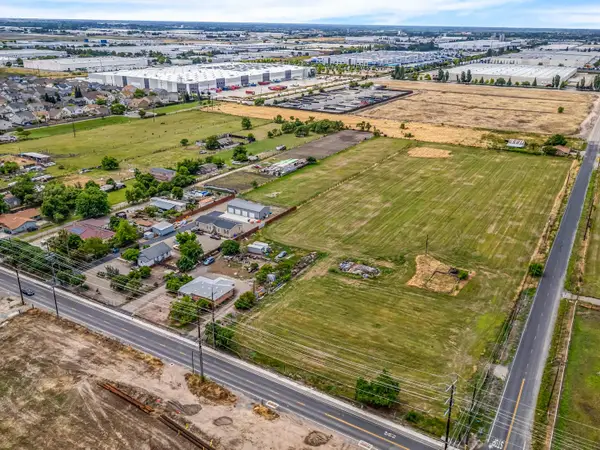
 $449,900Active-- beds -- baths1,792 sq. ft.
1211 E Main Street, Stockton, CA 95205
MLS# 226055894Listed by: J.PETER REALTORS - New
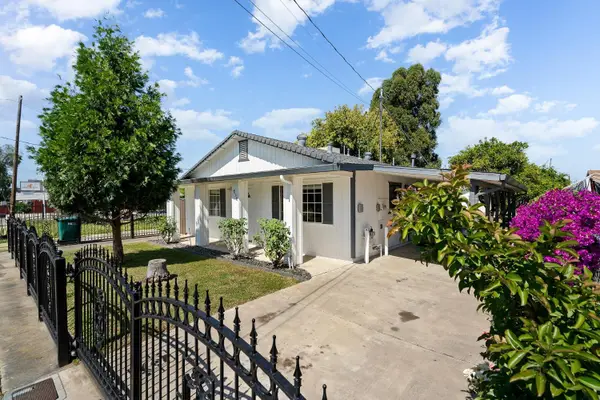
 $300,000Active4 beds 2 baths1,260 sq. ft.
2418 Nightingale Avenue, Stockton, CA 95205
MLS# 226055222Listed by: DICK STEPKEN REALTORS - New
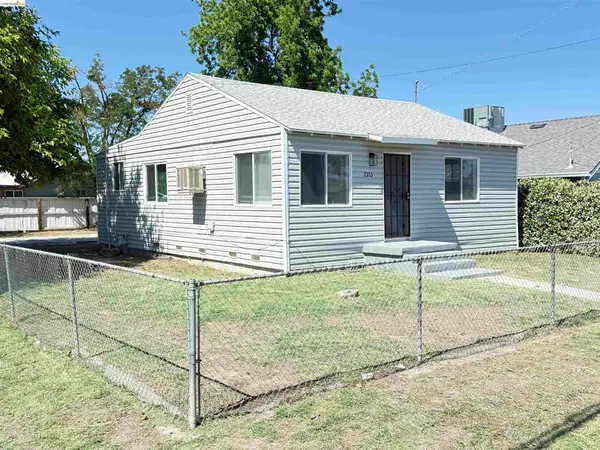
 $409,900Active3 beds 2 baths1,178 sq. ft.
608 S Golden Gate Avenue, Stockton, CA 95206
MLS# 226055748Listed by: 3SIXTY REAL ESTATE - New
 $319,500Active2 beds 1 baths836 sq. ft.
2353 Robindale Ave, Stockton, CA 95205
MLS# 41133245Listed by: COMMUNITY REALTY & INVESTMENTS - Open Sun, 12 to 2pmNew
 $429,000Active4 beds 2 baths1,245 sq. ft.
1440 N Golden Gate Avenue, Stockton, CA 95205
MLS# 226054142Listed by: KW SAC METRO - Open Sat, 12 to 2pmNew
 $335,000Active2 beds 1 baths972 sq. ft.
2544 E Marsh Street, Stockton, CA 95205
MLS# ML82045143Listed by: INTERO REAL ESTATE SERVICES 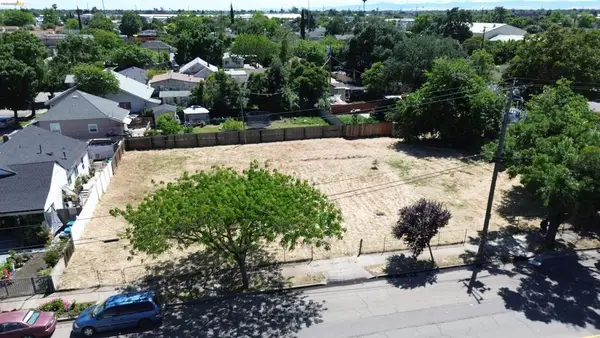 $99,900Pending0.23 Acres
1640 E Hazelton Ave, Stockton, CA 95205
MLS# 41132646Listed by: REAL ESTATE SOURCE INC. $366,500Active3 beds 1 baths917 sq. ft.
425 Burkett Avenue, Stockton, CA 95205
MLS# 226049950Listed by: REALTY ONE GROUP ZOOM $458,990Pending3 beds 2 baths1,481 sq. ft.
2228 E Loomis Road, Stockton, CA 95206
MLS# 226049297Listed by: KB HOME SALES-NORTHERN CALIFORNIA INC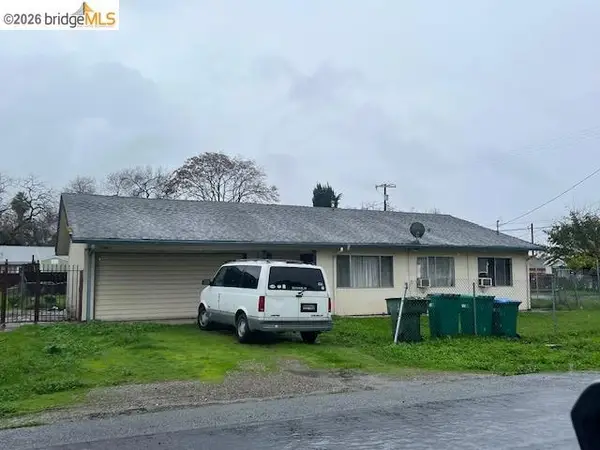 $305,000Active3 beds 1 baths1,110 sq. ft.
1402 N Morrison Ave, Stockton, CA 95205
MLS# 41131473Listed by: RE/MAX CROSSROADS $330,000Pending3 beds 1 baths828 sq. ft.
1810 E Flora Street, Stockton, CA 95205
MLS# 226048385Listed by: LPT REALTY, INC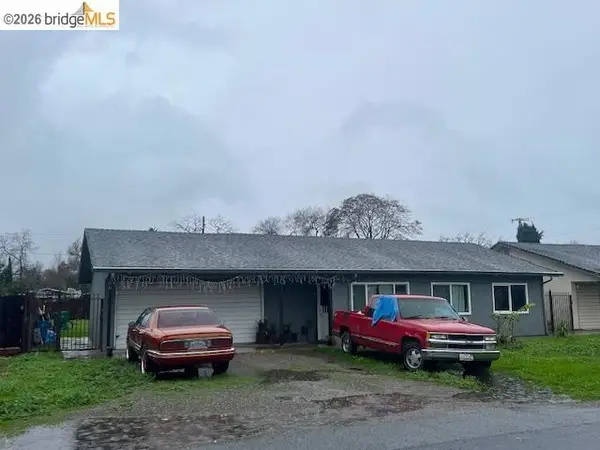 $345,000Active3 beds 2 baths1,110 sq. ft.
1412 N Morrison Ave, Stockton, CA 95205
MLS# 41131457Listed by: RE/MAX CROSSROADS $410,000Pending4 beds 2 baths1,716 sq. ft.
2502 Belair Street, Stockton, CA 95205
MLS# 226042469Listed by: EXP REALTY OF NORTHERN CALIFORNIA, INC. $359,000Pending3 beds 2 baths1,040 sq. ft.
2540 Jordan Court, Stockton, CA 95205
MLS# 226046989Listed by: BERG PROPERTIES $409,000Active3 beds 2 baths1,494 sq. ft.
2335 E Washington Street, Stockton, CA 95205
MLS# 226046982Listed by: PRIME REAL ESTATE $270,000Active3 beds 1 baths1,217 sq. ft.
1806 E Poplar Street, Stockton, CA 95205
MLS# 225146993Listed by: BERG PROPERTIES $399,000Pending2 beds 1 baths1,080 sq. ft.
447 N Shasta Avenue, Stockton, CA 95205
MLS# 226045448Listed by: GRUPE REAL ESTATE $299,950Pending4 beds 2 baths1,836 sq. ft.
2018 E Myrtle Street, Stockton, CA 95205
MLS# 226013887Listed by: KIETZKE&KRAMER PROPERTIES INC. $269,000Active2 beds 1 baths768 sq. ft.
1865 E Acacia Street, Stockton, CA 95205
MLS# 226042769Listed by: REALTY ASSOCIATES, INC $559,990Active5 beds 3 baths2,541 sq. ft.
2348 E Loomis Road, Stockton, CA 95205
MLS# 226045689Listed by: KB HOME SALES-NORTHERN CALIFORNIA INC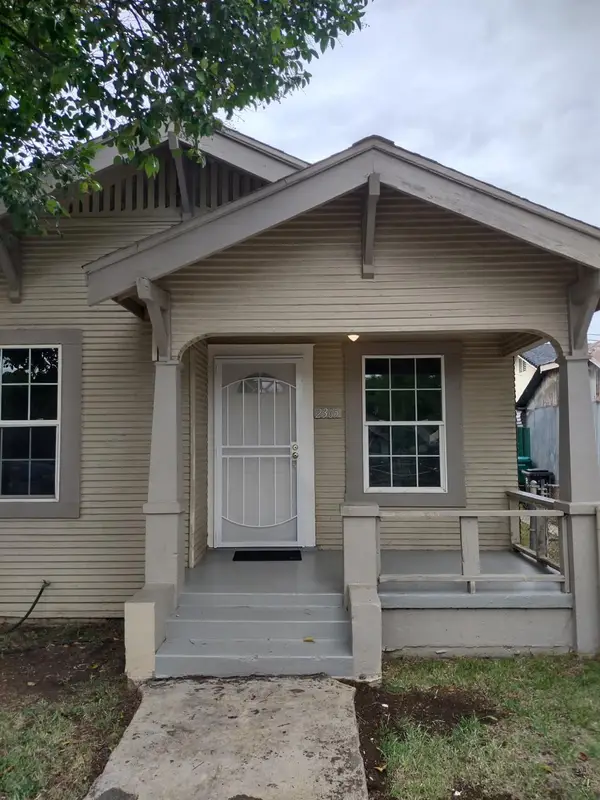 $239,900Pending2 beds 1 baths606 sq. ft.
2365 E Church Street, Stockton, CA 95205
MLS# 226045002Listed by: CALIFORNIA REAL ESTATE GROUP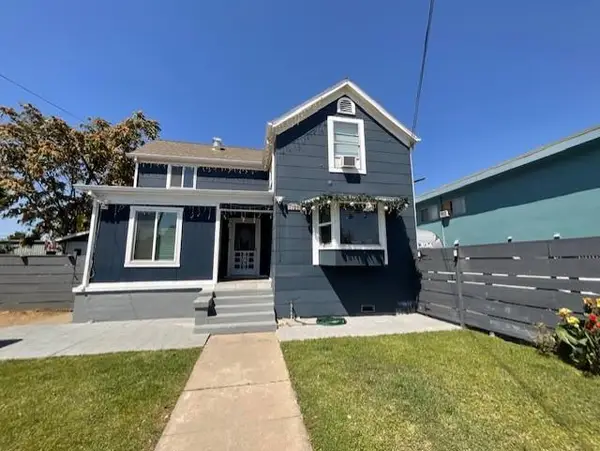 $399,000Pending4 beds 3 baths1,588 sq. ft.
1123 E Park Street, Stockton, CA 95205
MLS# 226044814Listed by: FATHOM REALTY GROUP, INC.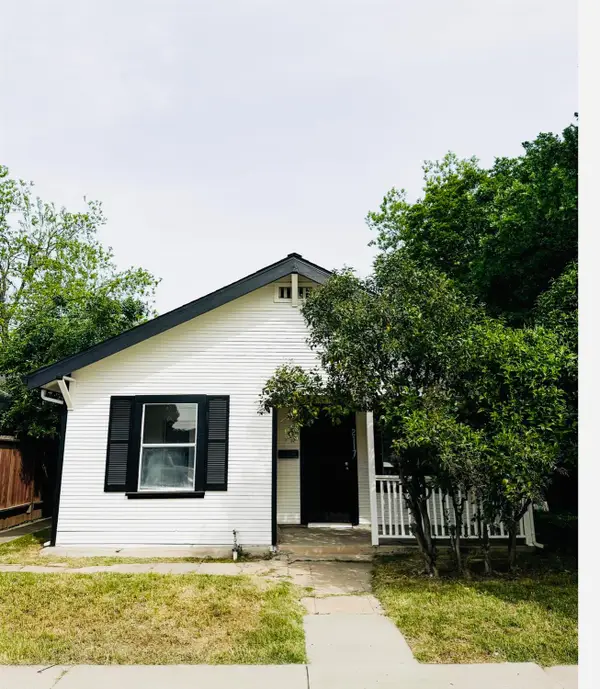 $339,000Active2 beds 1 baths767 sq. ft.
2117 E Washington Street, Stockton, CA 95205
MLS# 226042933Listed by: JRP REALTY GROUP $465,000Pending3 beds 3 baths2,272 sq. ft.
3974 Marchesotti Way, Stockton, CA 95205
MLS# 226040196Listed by: CORNERSTONE REAL ESTATE GROUP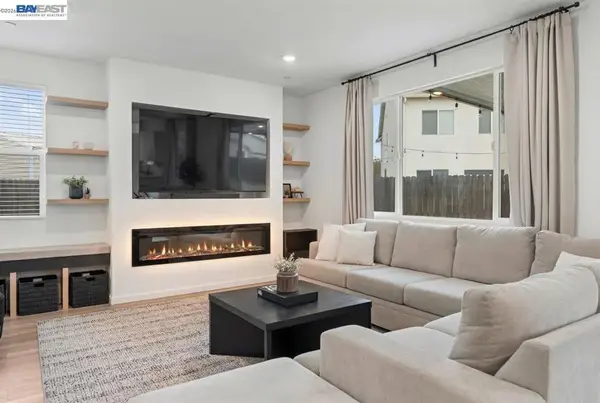 $599,000Active4 beds 3 baths2,308 sq. ft.
3651 Mcguire Dr, Stockton, CA 95205
MLS# 41129679Listed by: EXP REALTY OF CALIFORNIA, INC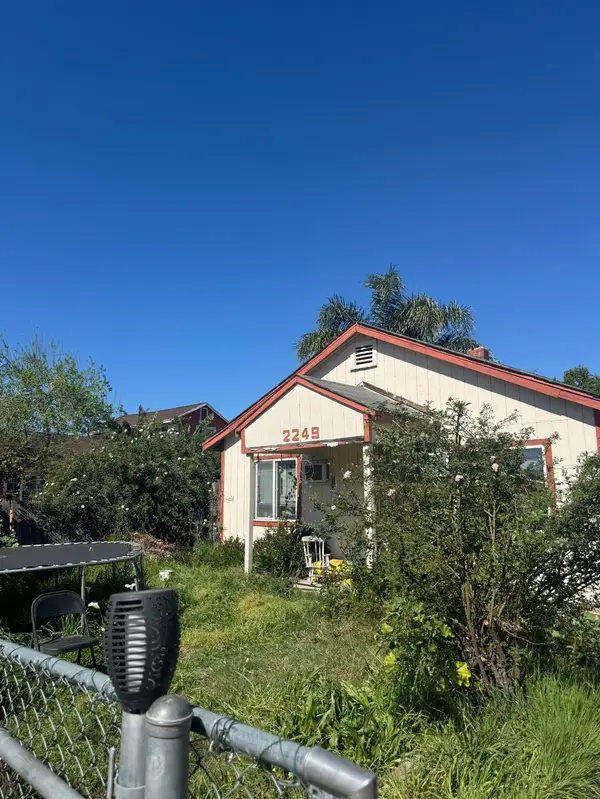 $350,000Active2 beds 1 baths750 sq. ft.
2249 E Vine Street, Stockton, CA 95205
MLS# 226040249Listed by: KW CENTRAL VALLEY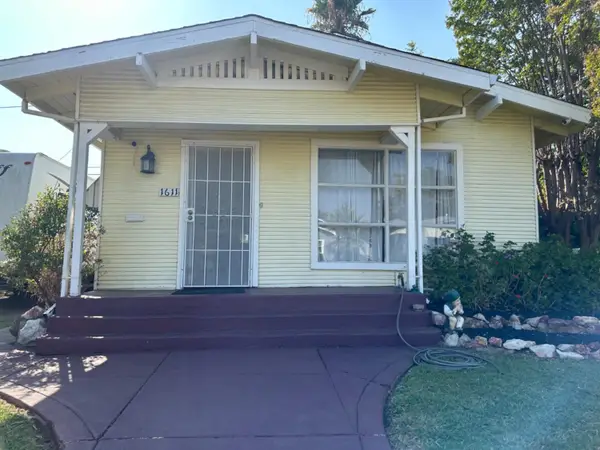 $250,000Active2 beds 2 baths1,486 sq. ft.
1611 N Stanford Avenue, Stockton, CA 95205
MLS# 226036801Listed by: OTSAR REALTY ENTERPRISE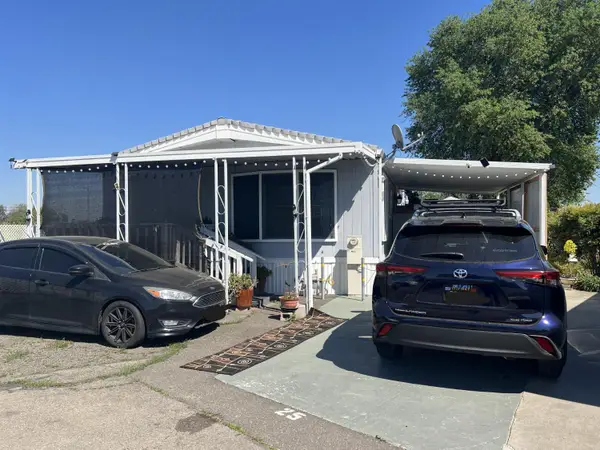 $160,000Active2 beds 2 baths1,056 sq. ft.
4501 Wilson Way #25, Stockton, CA 95205
MLS# 226034241Listed by: CAPITAL'S FINEST, INC. $165,000Active-- beds -- baths1,328 sq. ft.
517 N Windsor Avenue, Stockton, CA 95205
MLS# 226032659Listed by: PMZ REAL ESTATE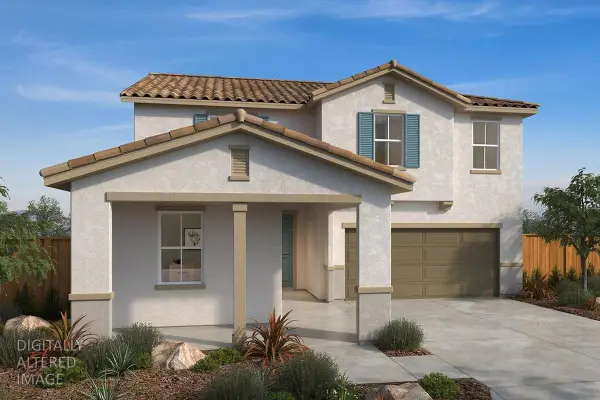 $543,990Active4 beds 3 baths2,308 sq. ft.
2297 E Amboy Avenue, Stockton, CA 95204
MLS# 226031665Listed by: KB HOME SALES-NORTHERN CALIFORNIA INC $669,000Active-- beds -- baths3,439 sq. ft.
345 S Pilgrim Street, Stockton, CA 95205
MLS# ML82038200Listed by: INFINITE REAL ESTATE $549,000Active1.3 Acres
716 N Filbert Street, Stockton, CA 95205
MLS# 226028889Listed by: BOKIDES-HESSELTINE REAL ESTATE $299,000Active3 beds 1 baths1,065 sq. ft.
1647 N Gilchrist Avenue, Stockton, CA 95205
MLS# ML82037678Listed by: RE/MAX SYNERGY GROUP $528,888Pending4 beds 3 baths2,272 sq. ft.
3886 Trieste Circle, Stockton, CA 95205
MLS# 226025245Listed by: BHGRE INTEGRITY REAL ESTATE $458,990Pending3 beds 2 baths1,481 sq. ft.
2291 E Amboy Avenue, Stockton, CA 95204
MLS# 226024095Listed by: KB HOME SALES-NORTHERN CALIFORNIA INC $580,000Active4 beds 3 baths2,308 sq. ft.
3534 Mcguire Drive, Stockton, CA 95205
MLS# 226019169Listed by: CORE FOUR REALTY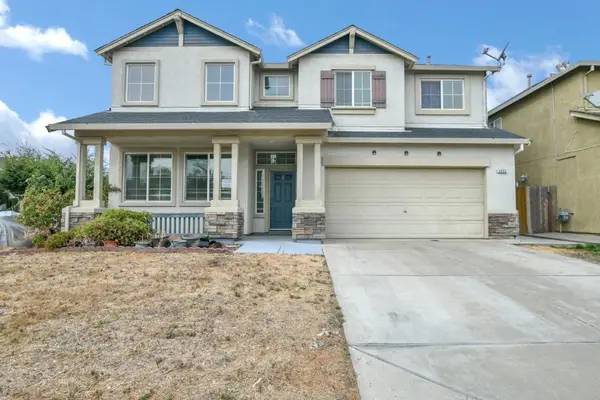 $519,000Active5 beds 3 baths2,555 sq. ft.
3605 Gloria Court, Stockton, CA 95205
MLS# ML82036067Listed by: EXP REALTY OF CALIFORNIA INC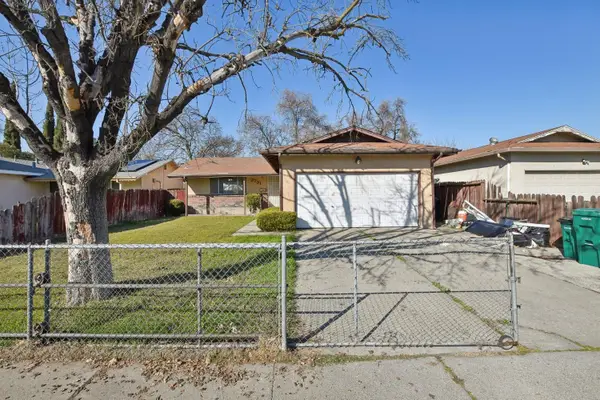 $359,000Pending3 beds 2 baths1,078 sq. ft.
2731 E Anita Street, Stockton, CA 95205
MLS# 226020799Listed by: PMZ REAL ESTATE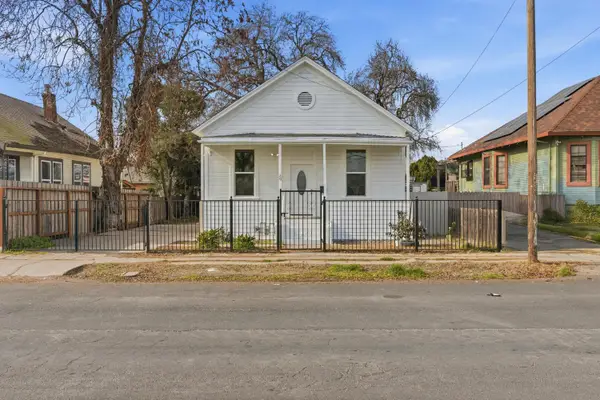 $399,887Active3 beds 1 baths1,144 sq. ft.
29 S Sierra Nevada Street, Stockton, CA 95205
MLS# 226020655Listed by: REAL ESTATE PROFESSIONALS 4 YOU $369,000Active2 beds 1 baths718 sq. ft.
2261 S Netherton Avenue, Stockton, CA 95205
MLS# 226020640Listed by: GRUPE REAL ESTATE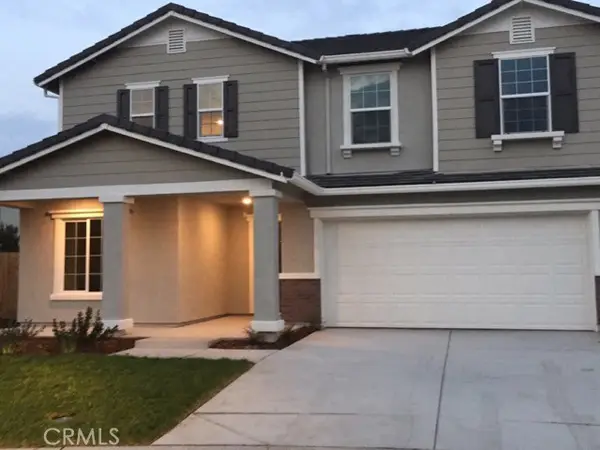 $524,999Pending4 beds 3 baths2,272 sq. ft.
4028 Triesta Circle Circle, Stockton, CA 95205
MLS# SR26007788Listed by: LPT REALTY, INC $335,000Active2 beds 1 baths816 sq. ft.
1551 Chronicle Avenue, Stockton, CA 95205
MLS# 226019706Listed by: KW CENTRAL VALLEY $515,888Pending3 beds 2 baths1,756 sq. ft.
3624 Palermo St, Stockton, CA 95205
MLS# 41124300Listed by: REALTY ONE GROUP ELITE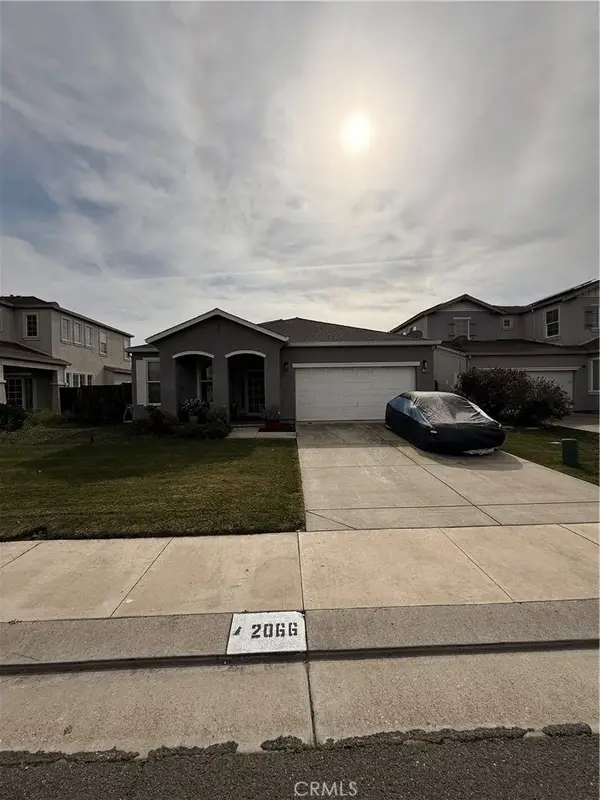 $499,000Active4 beds 2 baths1,948 sq. ft.
2066 Shady Forest, Stockton, CA 95205
MLS# PW26035081Listed by: HOME SAVER REALTY $435,000Active3 beds 3 baths1,865 sq. ft.
2379 E Willow Street, Stockton, CA 95205
MLS# 226009361Listed by: BECK, REALTORS $495,990Pending4 beds 2 baths1,718 sq. ft.
2258 E Loomis Road, Stockton, CA 95206
MLS# 226015947Listed by: KB HOME SALES-NORTHERN CALIFORNIA INC- $559,990Pending4 beds 3 baths2,308 sq. ft.
2278 E Loomis Road, Stockton, CA 95206
MLS# 226015953Listed by: KB HOME SALES-NORTHERN CALIFORNIA INC  $410,000Active3 beds 2 baths1,232 sq. ft.
3106 Castellon Way, Stockton, CA 95205
MLS# 226014792Listed by: REALTY1TEAM $524,990Pending3 beds 2 baths1,934 sq. ft.
2336 Amboy Avenue, Stockton, CA 95206
MLS# 226012533Listed by: KB HOME SALES-NORTHERN CALIFORNIA INC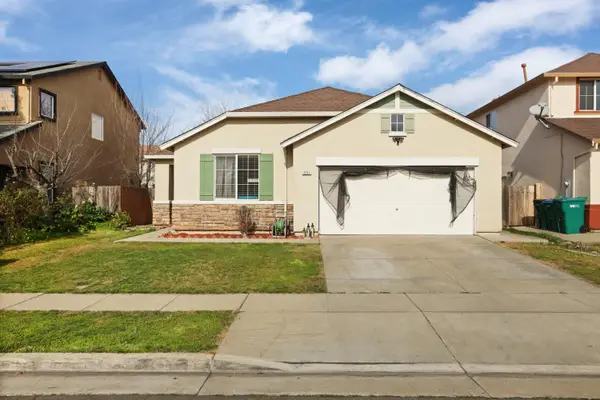 $449,000Pending3 beds 2 baths1,660 sq. ft.
1771 Fontanella Way, Stockton, CA 95205
MLS# 226009584Listed by: EXP REALTY OF CALIFORNIA INC.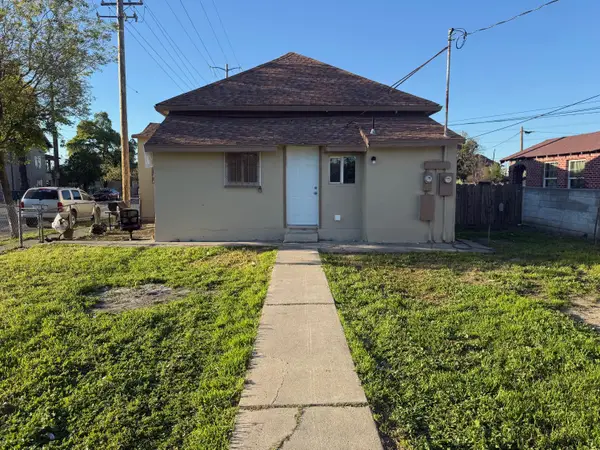 $349,998Active-- beds -- baths1,609 sq. ft.
2006 E Lafayette Street, Stockton, CA 95205
MLS# 226009602Listed by: RELIANCE REAL ESTATE, INC $210,000Active2 beds 1 baths988 sq. ft.
1141 N E Street, Stockton, CA 95205
MLS# 226008053Listed by: EXIT REALTY CONSULTANTS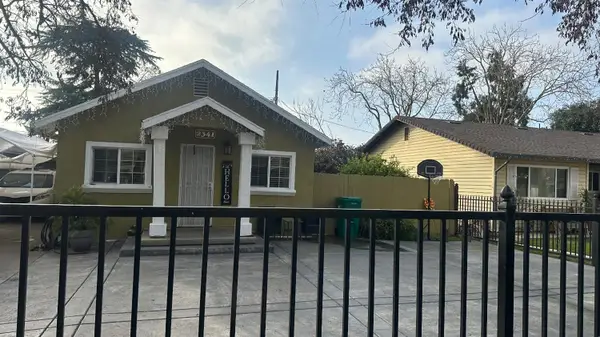 $330,000Pending2 beds 1 baths770 sq. ft.
2341 Mccomb Avenue, Stockton, CA 95205
MLS# 226006367Listed by: MARKETING MASTERS REALTY GROUP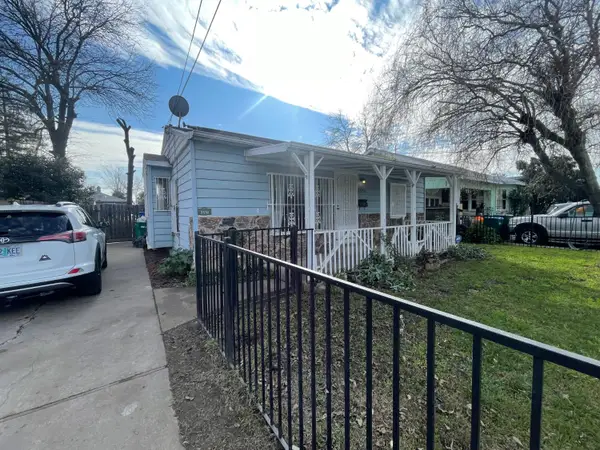 $299,000Pending2 beds 1 baths842 sq. ft.
2330 E Finland Avenue, Stockton, CA 95205
MLS# 226003789Listed by: GRUPE REAL ESTATE $457,990Pending3 beds 2 baths1,481 sq. ft.
2306 E Amboy Avenue, Stockton, CA 95206
MLS# 225153733Listed by: KB HOME SALES-NORTHERN CALIFORNIA INC $494,990Pending3 beds 2 baths1,934 sq. ft.
2318 E Amboy Avenue, Stockton, CA 95206
MLS# 226001128Listed by: KB HOME SALES-NORTHERN CALIFORNIA INC $565,990Active4 beds 3 baths2,541 sq. ft.
2348 E Amboy Avenue, Stockton, CA 95206
MLS# 226003619Listed by: KB HOME SALES-NORTHERN CALIFORNIA INC $399,999Pending3 beds 2 baths1,600 sq. ft.
545 N Golden Gate Ave, Stockton, CA 95205
MLS# 41119736Listed by: REAL BROKER $350,000Pending2 beds 2 baths944 sq. ft.
1111 Pinchot Street, Stockton, CA 95205
MLS# 225153219Listed by: APPROVED REAL ESTATE GROUP $369,000Pending2 beds 1 baths768 sq. ft.
2822 Belvedere Avenue, Stockton, CA 95205
MLS# 225152486Listed by: DIVERSIFIED ASSET AND PROPERTY MANAGEMENT $698,000Active-- beds -- baths1,070 sq. ft.
1217 E Harding Way, Stockton, CA 95205
MLS# ML82029059Listed by: COMPASS $478,000Active3 beds 2 baths1,272 sq. ft.
2497 E Marsh Street, Stockton, CA 95205
MLS# 225150155Listed by: J.PETER REALTORS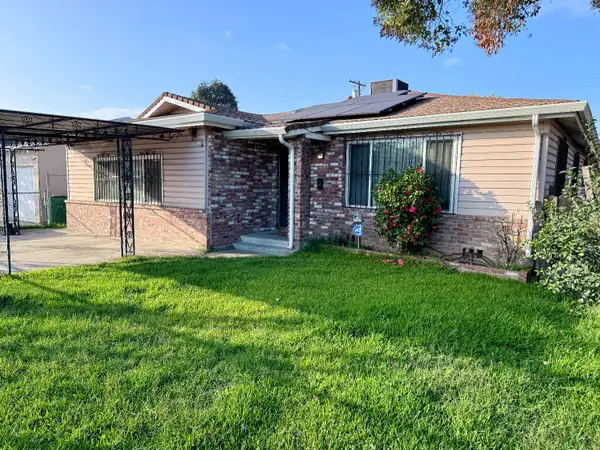 $350,000Pending5 beds 2 baths2,230 sq. ft.
2477 E Washington Street, Stockton, CA 95205
MLS# 225148060Listed by: STARPOINT REAL ESTATE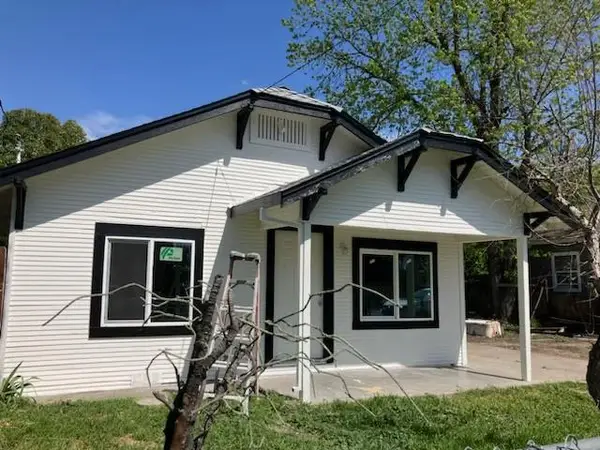 $339,000Active2 beds 2 baths932 sq. ft.
524 Burkett Avenue, Stockton, CA 95205
MLS# 225145795Listed by: BERG PROPERTIES $249,000Pending3 beds 1 baths879 sq. ft.
2472 Robindale Avenue, Stockton, CA 95205
MLS# 225146994Listed by: BERG PROPERTIES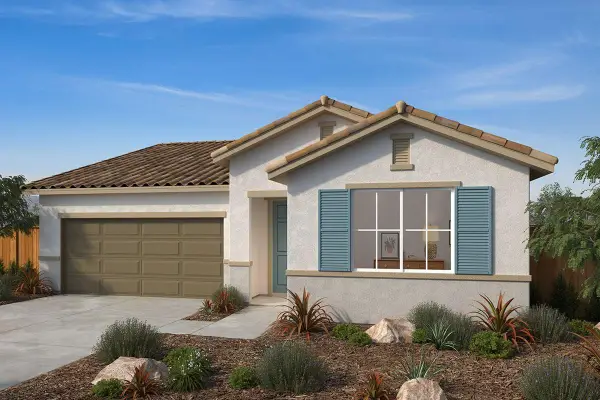 $454,990Pending3 beds 2 baths1,481 sq. ft.
2315 Amboy Avenue, Stockton, CA 95206
MLS# 225142902Listed by: KB HOME SALES-NORTHERN CALIFORNIA INC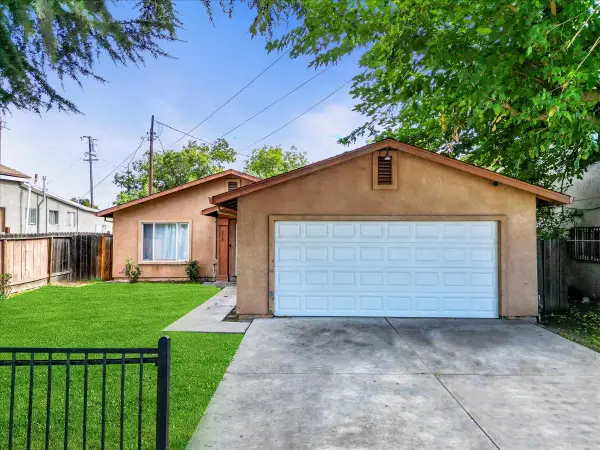 $340,000Pending3 beds 2 baths1,200 sq. ft.
336 S Airport Way, Stockton, CA 95205
MLS# 225141639Listed by: COMPASS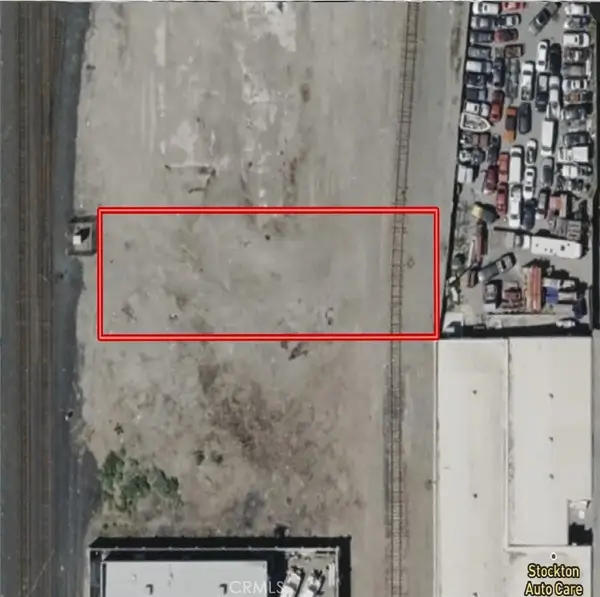 $39,000Active0 Acres
0 Park, Stockton, CA 95205
MLS# SR25247647Listed by: ANTHEM REAL ESTATE $319,000Active2 beds 1 baths1,070 sq. ft.
1926 E Roosevelt Street, Stockton, CA 95205
MLS# 225132599Listed by: GRUPE REAL ESTATE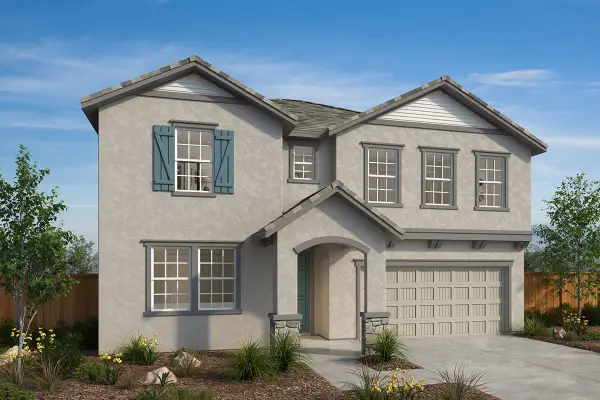 $559,990Active5 beds 3 baths2,541 sq. ft.
2321 Amboy Avenue, Stockton, CA 95206
MLS# 225131845Listed by: KB HOME SALES-NORTHERN CALIFORNIA INC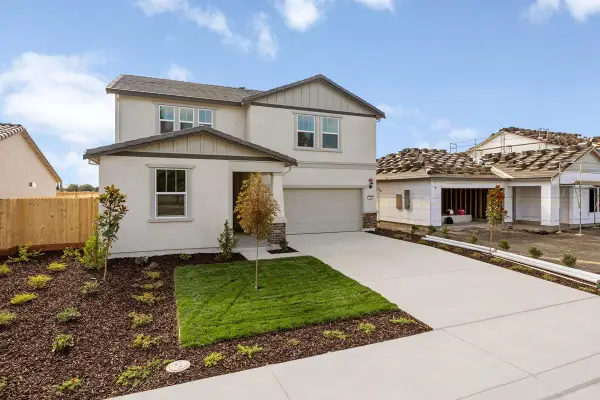 $549,990Pending4 beds 3 baths2,308 sq. ft.
2318 Loomis Road, Stockton, CA 95206
MLS# 225131857Listed by: KB HOME SALES-NORTHERN CALIFORNIA INC $399,999Pending-- beds -- baths2,458 sq. ft.
1200 E Miner Avenue, Stockton, CA 95205
MLS# 225104638Listed by: PMZ REAL ESTATE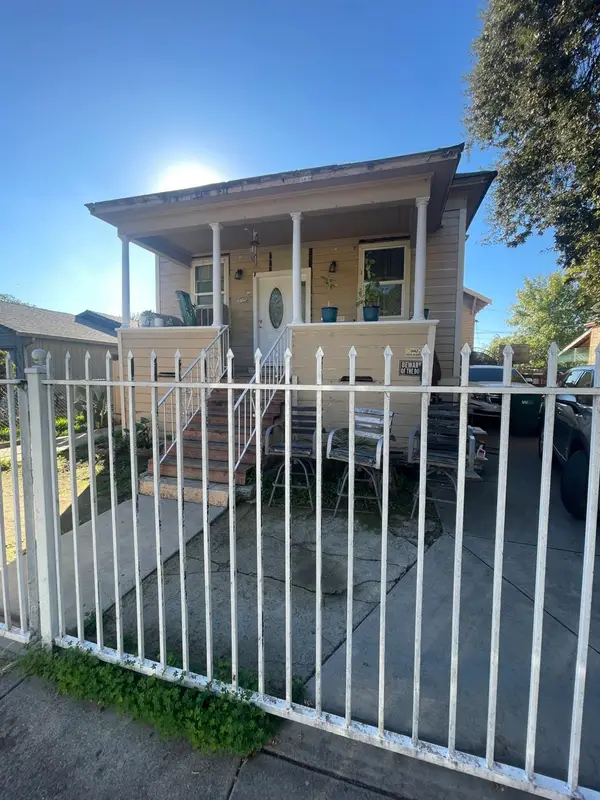 $319,999Active4 beds 2 baths1,372 sq. ft.
1224 E Lafayette Street, Stockton, CA 95205
MLS# 225102028Listed by: GRUPE REAL ESTATE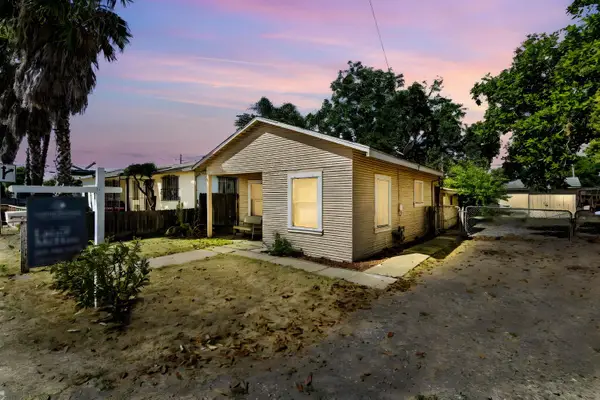 $250,000Pending2 beds 1 baths820 sq. ft.
1825 N Filbert Street, Stockton, CA 95205
MLS# 225088870Listed by: CORNERSTONE REAL ESTATE GROUP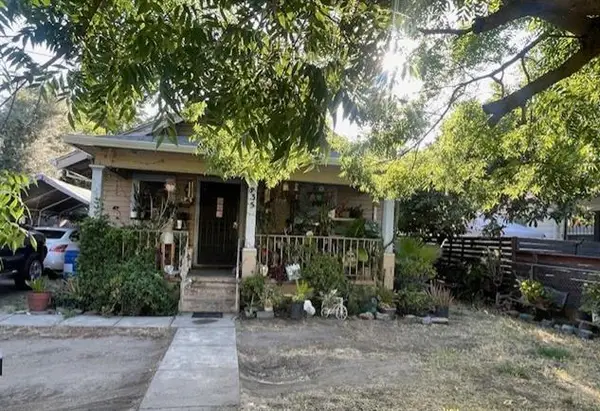 $275,000Active2 beds 1 baths942 sq. ft.
835 S Airport Way, Stockton, CA 95205
MLS# 225079952Listed by: GRUPE REAL ESTATE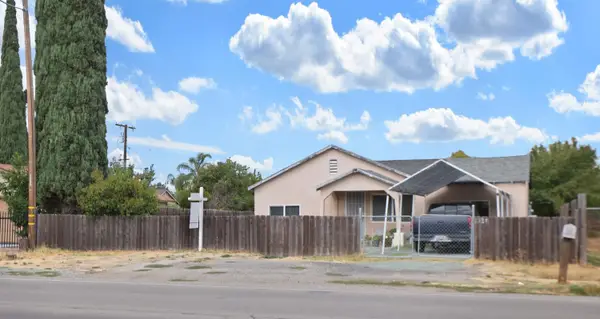 $261,000Pending2 beds 1 baths770 sq. ft.
2337 E Alpine Avenue, Stockton, CA 95205
MLS# 226015958Listed by: GRUPE REAL ESTATE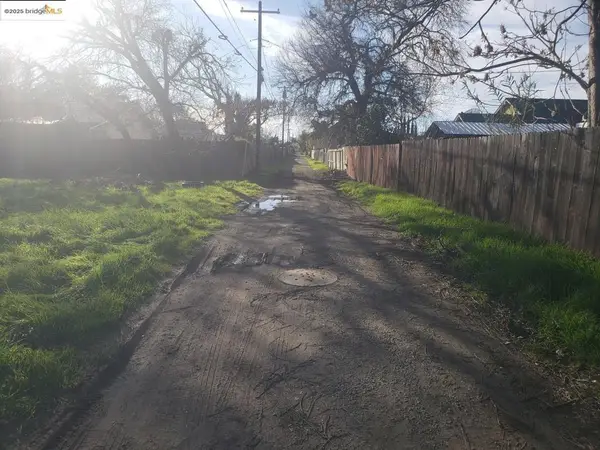 $98,950Pending0.2 Acres
2387 E Lafayette St, Stockton, CA 95205
MLS# 41095300Listed by: HOMECOIN.COM $348,000Active3 beds 2 baths956 sq. ft.
1600 Sunnyside Avenue, Stockton, CA 95205
MLS# 224110893Listed by: MARKETING MASTERS REALTY GROUP
Local realty services provided by:CENTURY 21 Select Real Estate, Inc., CENTURY 21 Baldini Real Estate, Inc., CENTURY 21 Village Realty, CENTURY 21 Affiliated
MetroList MLS 2026. This information is being provided by MetroList MLS. All measurements and calculations of area are approximate. Information provided by Seller/Other sources, not verified by Broker. All interested persons should independently verify accuracy of information. Provided properties may or may not be listed by the office/agent presenting the information. Data Updated: October 23, 2025. Information being provided is for consumers' personal, non-commercial use and may not be used for any purpose other than to identify prospective properties consumers may be interested in purchasing. Information deemed reliable but not guaranteed. Any offer of compensation is made only to Participants of MLS where the subject listing is filed and in accordance with such MLS's regulations or rules.
The information being provided by San Francisco Association of REALTORS is for the consumer's personal, non-commercial use and may not be used for any purpose other than to identify prospective properties consumer may be interested in purchasing. Any information relating to real estate for sale referenced on this web site comes from the Internet Data Exchange (IDX) program of the San Francisco Association of REALTORS. This web site may reference real estate listing(s) held by a brokerage firm other than the broker and/or agent who owns this web site. The accuracy of all information, regardless of source, including but not limited to open house information, square footages and lot sizes, is deemed reliable but not guaranteed and should be personally verified through personal inspection by and/or with the appropriate professionals. The data contained herein is copyrighted by San Francisco Association of REALTORS and is protected by all applicable copyright laws. Any unauthorized dissemination of this information is in violation of copyright laws and is strictly prohibited.
The information being provided by California Regional MLS (Southern California) is for the consumer's personal, non-commercial use and may not be used for any purpose other than to identify prospective properties consumer may be interested in purchasing. Any information relating to real estate for sale referenced on this web site comes from the Internet Data Exchange (IDX) program of the California Regional MLS (Southern California). CENTURY 21 Village Realty is not a Multiple Listing Service (MLS), nor does it offer MLS access. This website is a service of CENTURY 21 Village Realty, a broker participant of California Regional MLS (Southern California). This web site may reference real estate listing(s) held by a brokerage firm other than the broker and/or agent who owns this web site.
The accuracy of all information, regardless of source, including but not limited to open house information, square footages and lot sizes, is deemed reliable but not guaranteed and should be personally verified through personal inspection by and/or with the appropriate professionals. The data contained herein is copyrighted by California Regional MLS (Southern California) and is protected by all applicable copyright laws. Any unauthorized dissemination of this information is in violation of copyright laws and is strictly prohibited.
Copyright 2021 California Regional MLS (Southern California). All rights reserved.
This information is deemed reliable but not guaranteed. You should rely on this information only to decide whether or not to further investigate a particular property. BEFORE MAKING ANY OTHER DECISION, YOU SHOULD PERSONALLY INVESTIGATE THE FACTS (e.g. square footage and lot size) with the assistance of an appropriate professional. You may use this information only to identify properties you may be interested in investigating further. All uses except for personal, non-commercial use in accordance with the foregoing purpose are prohibited. Redistribution or copying of this information, any photographs or video tours is strictly prohibited. This information is derived from the Internet Data Exchange (IDX) service provided by San Diego MLS®. Displayed property listings may be held by a brokerage firm other than the broker and/or agent responsible for this display. The information and any photographs and video tours and the compilation from which they are derived is protected by copyright. Compilation © 2020 San Diego MLS®, Inc.
Popular searches near 95205
Popular neighborhoods near 95205
- August, Stockton homes for sale
- Civic, Stockton homes for sale
- Civic Center, Stockton homes for sale
- El Piñal, Stockton homes for sale
- Fair Oaks, Stockton homes for sale
- Garden Acres, Stockton homes for sale
- Gleason Park, Stockton homes for sale
- Kennedy, Stockton homes for sale
- Kentfield, Stockton homes for sale
- Magnolia, Stockton homes for sale
- McKinley Park, Stockton homes for sale
- Oak Park, Stockton homes for sale
- Park, Stockton homes for sale
- Seaport, Stockton homes for sale
- South of Mormon Channel, Stockton homes for sale
- University, Stockton homes for sale
- Waterloo, Stockton homes for sale
- Weber Ranch, Stockton homes for sale
- West of Center, Stockton homes for sale
- Wilson, Stockton homes for sale
Counties near Stockton, 95205
- Alameda County homes for sale
- Amador County homes for sale
- Calaveras County homes for sale
- Contra Costa County homes for sale
- El Dorado County homes for sale
- Marin County homes for sale
- Mariposa County homes for sale
- Merced County homes for sale
- Napa County homes for sale
- Placer County homes for sale
- Sacramento County homes for sale
- San Joaquin County homes for sale
- San Mateo County homes for sale
- Santa Clara County homes for sale
- Santa Cruz County homes for sale
- Solano County homes for sale
- Stanislaus County homes for sale
- Sutter County homes for sale
- Tuolumne County homes for sale
- Yolo County homes for sale
Protect your home and budget from life's surprises with an Assurant Home Warranty, backed by a partner that supports you through every step of homeownership. Explore Plans.
©2026 Century 21 Real Estate LLC. All rights reserved. CENTURY 21®, the CENTURY 21 Logo and C21® are service marks owned by Century 21 Real Estate LLC. Century 21 Real Estate LLC fully supports the principles of the Fair Housing Act and the Equal Opportunity Act. Each office is independently owned and operated. Listing information is deemed reliable but not guaranteed accurate.