- Belle Meade, Rockford homes for sale
- Bello Reserve, Rockford homes for sale
- Churchill Grove, Rockford homes for sale
- CMC, Rockford homes for sale
- Colonial Gardens, Machesney Park homes for sale
- Edgewater, Rockford homes for sale
- Forest Hills View, Rockford homes for sale
- Gregory Heights, Rockford homes for sale
- Highland Area, Rockford homes for sale
- Jackson Oaks, Rockford homes for sale
- Keith Creek, Rockford homes for sale
- Martin Shorwood, Loves Park homes for sale
- Midtown District, Rockford homes for sale
- North Highland, Rockford homes for sale
- Palmwood, Rockford homes for sale
- Pine Manor, Rockford homes for sale
- Rock Cut Area, Loves Park homes for sale
- Rockview, Rockford homes for sale
- Rolling Green, Rockford homes for sale
- Southeast Helping Hands, Rockford homes for sale
Belvidere, IL - homes for sale
101 of 101 results displayed
- New
 $450,000Active-- beds -- baths4,180 sq. ft.
522 S State Street, BELVIDERE, IL 61008
MLS# 202603280Listed by: KELLER WILLIAMS REALTY SIGNATURE - New
 $60,000Active0.74 Acres
1900 Pierce Court, Belvidere, IL 61008
MLS# 12669045Listed by: BERKSHIRE HATHAWAY HOMESERVICES STARCK REAL ESTATE
- New

 $214,900Active3 beds 2 baths2,275 sq. ft.
927 E Lincoln Avenue, Belvidere, IL 61008
MLS# 12667230Listed by: CENTURY 21 LANGOS & CHRISTIAN - New
 $375,000Active4 beds 4 baths2,474 sq. ft.
1504 Bliss Street, Belvidere, IL 61008
MLS# 12643545Listed by: COLDWELL BANKER REALTY - New
 $250,000Active5 beds 2 baths2,052 sq. ft.
604 E Pleasant Street, BELVIDERE, IL 61008
MLS# 202603222Listed by: KEY REALTY, INC - New
 $288,000Active5 beds 3 baths3,624 sq. ft.
306 Beacon Drive, BELVIDERE, IL 61008
MLS# 202603211Listed by: KELLER WILLIAMS REALTY SIGNATURE - New
 $215,000Active2 beds 3 baths1,868 sq. ft.
649 Southtowne Drives, BELVIDERE, IL 61008
MLS# 202603180Listed by: EXP REALTY - New
 $599,900Active3 beds 3 baths3,180 sq. ft.
5866 Irene Road, BELVIDERE, IL 61008
MLS# 202603169Listed by: GAMBINO REALTORS - New
 $73,900Active3 beds 2 baths1,344 sq. ft.
207 Fox Lane, BELVIDERE, IL 61008
MLS# 202603164Listed by: RE/MAX PROPERTY SOURCE  $141,900Pending2 beds 1 baths948 sq. ft.
415 N State Street, BELVIDERE, IL 61008
MLS# 202603131Listed by: RE/MAX PROPERTY SOURCE $239,900Pending5 beds 2 baths
2140 Davis Drive, Belvidere, IL 61008
MLS# 12651853Listed by: WEICHERT REALTORS - TOVAR PROP $255,000Pending3 beds 2 baths1,200 sq. ft.
1169 Russell Road, BELVIDERE, IL 61008
MLS# 202603101Listed by: KELLER WILLIAMS REALTY SIGNATURE $389,000Pending4 beds 3 baths3,328 sq. ft.
1765 Greenfield Court, Belvidere, IL 61008
MLS# 12659158Listed by: GAMBINO REALTORS HOME BUILDERS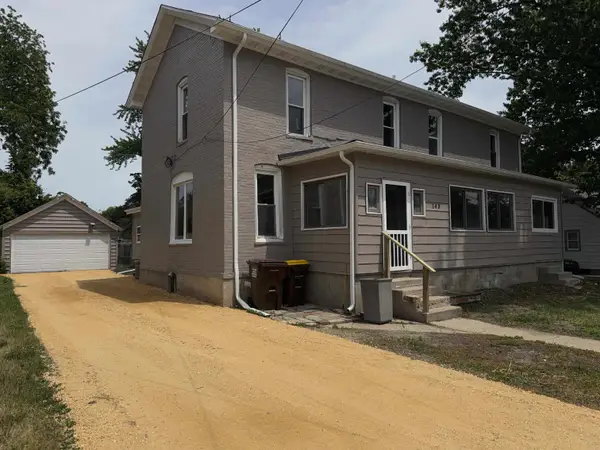 $265,000Pending3 beds 3 baths2,872 sq. ft.
143 Gladys Court, BELVIDERE, IL 61008
MLS# 202603060Listed by: KELLER WILLIAMS REALTY SIGNATURE $209,900Active3 beds 2 baths1,443 sq. ft.
1105 Oakley Street, BELVIDERE, IL 61008
MLS# 202603003Listed by: RE/MAX PROFESSIONAL ADVANTAGE $240,000Pending3 beds 2 baths1,912 sq. ft.
818 W Jackson St, BELVIDERE, IL 61008
MLS# 202602978Listed by: WEICHERT REALTORS - TOVAR PROPERTIES $180,000Pending4 beds 2 baths2,044 sq. ft.
617 East Avenue, BELVIDERE, IL 61008
MLS# 202602955Listed by: KELLER WILLIAMS REALTY SIGNATURE $29,900Active2 beds 1 baths840 sq. ft.
579 Park Avenue, BELVIDERE, IL 61008
MLS# 202602940Listed by: GAMBINO REALTORS $199,900Pending3 beds 2 baths1,374 sq. ft.
1421 Garfield Avenue, Belvidere, IL 61008
MLS# 12654766Listed by: DICKERSON & NIEMAN REALTORS - ROCKFORD $69,900Active3 beds 2 baths
409 E Wood Lane, Belvidere, IL 61008
MLS# 12654801Listed by: COLDWELL BANKER REALTY $249,900Active5 beds 2 baths2,490 sq. ft.
910 N State Street, BELVIDERE, IL 61008
MLS# 202602911Listed by: KELLER WILLIAMS REALTY SIGNATURE $325,000Pending3 beds 3 baths2,034 sq. ft.
1629 Cloverdale Way, Belvidere, IL 61008
MLS# 12652545Listed by: WEICHERT REALTORS SIGNATURE PROFESSIONALS $52,999Active3 beds 2 baths
273 Fox Lane, Belvidere, IL 61008
MLS# 12653880Listed by: GRANDVIEW REALTY, LLC $579,000Active3 beds 3 baths2,300 sq. ft.
5145 Sycamore Ridge Road, BELVIDERE, IL 61008
MLS# 202602851Listed by: KEY REALTY, INC $35,000Active2 beds 2 baths952 sq. ft.
501 Lindenwood Drive, BELVIDERE, IL 61008
MLS# 202602852Listed by: KELLER WILLIAMS REALTY SIGNATURE $73,900Active3 beds 2 baths
406 Spruce Drive, Belvidere, IL 61008
MLS# 12650140Listed by: RE/MAX SUBURBAN $299,000Pending4 beds 2 baths1,600 sq. ft.
1919 Cloverdale Way, BELVIDERE, IL 61008
MLS# 202602823Listed by: KELLER WILLIAMS REALTY SIGNATURE $210,000Pending3 beds 1 baths1,370 sq. ft.
320 E MARSHALL Street, BELVIDERE, IL 61008
MLS# 202602776Listed by: DICKERSON & NIEMAN $69,900Active3 beds 2 baths1,120 sq. ft.
498 Park Avenue, BELVIDERE, IL 61008
MLS# 202602778Listed by: GAMBINO REALTORS $399,900Pending3 beds 3 baths2,526 sq. ft.
629 E Lincoln Avenue, Belvidere, IL 61008
MLS# 12630603Listed by: BERKSHIRE HATHAWAY HOMESERVICES STARCK REAL ESTATE $225,000Pending3 beds 2 baths2,121 sq. ft.
220 Beacon Drive, BELVIDERE, IL 61008
MLS# 202602742Listed by: KELLER WILLIAMS REALTY SIGNATURE $299,000Pending3 beds 2 baths2,724 sq. ft.
8739 Belvoir Drive, BELVIDERE, IL 61008
MLS# 202602741Listed by: KELLER WILLIAMS REALTY SIGNATURE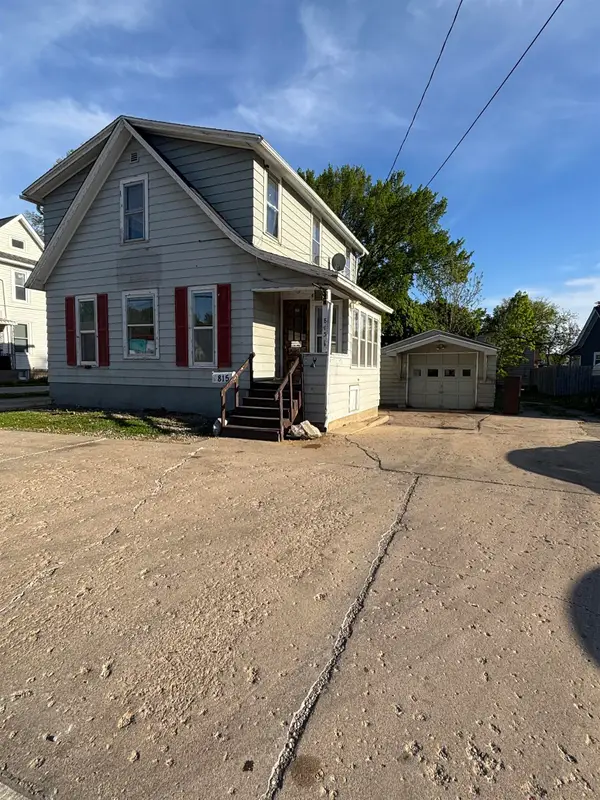 $129,000Pending3 beds 2 baths1,982 sq. ft.
815 Logan Avenue, BELVIDERE, IL 61008
MLS# 202602724Listed by: BERKSHIRE HATHAWAY HOMESERVICES CROSBY STARCK RE $225,000Active3 beds 3 baths1,785 sq. ft.
2246 Derby Lane, BELVIDERE, IL 61008
MLS# 202602713Listed by: KELLER WILLIAMS REALTY SIGNATURE $304,900Pending3 beds 2 baths3,160 sq. ft.
1135 RUSSELL Road, BELVIDERE, IL 61008
MLS# 202602698Listed by: DICKERSON & NIEMAN $22,000Active2 beds 1 baths784 sq. ft.
215 Fox Lane, BELVIDERE, IL 61008
MLS# 202602675Listed by: GAMBINO REALTORS $189,900Pending3 beds 1 baths1,580 sq. ft.
316 W Perry Street, BELVIDERE, IL 61008
MLS# 202602667Listed by: SMART HOME REALTY $275,000Pending4 beds 2 baths1,800 sq. ft.
412 Brynwood Lane, BELVIDERE, IL 61008
MLS# 202602643Listed by: KELLER WILLIAMS REALTY SIGNATURE $315,000Pending3 beds 3 baths1,924 sq. ft.
8642 SUMMERSET Drive, BELVIDERE, IL 61008
MLS# 202602615Listed by: DICKERSON & NIEMAN $149,900Pending3 beds 2 baths1,384 sq. ft.
112 W 2nd Street, Belvidere, IL 61008
MLS# 12642472Listed by: REALTY OF AMERICA, LLC $180,000Pending3 beds 1 baths1,116 sq. ft.
617 Gardner Street, BELVIDERE, IL 61008
MLS# 202602590Listed by: KELLER WILLIAMS REALTY SIGNATURE $389,900Active3 beds 3 baths2,908 sq. ft.
1900 Wycliffe Street, BELVIDERE, IL 61008
MLS# 202602568Listed by: KELLER WILLIAMS REALTY SIGNATURE $182,000Pending4 beds 2 baths1,486 sq. ft.
1126 Columbia Avenue, Belvidere, IL 61008
MLS# 12636132Listed by: DICKERSON & NIEMAN REALTORS - ROCKFORD $349,900Active3 beds 4 baths2,868 sq. ft.
401 E Lincoln Avenue, BELVIDERE, IL 61008
MLS# 202602540Listed by: BERKSHIRE HATHAWAY HOMESERVICES STARCK RE $289,900Pending3 beds 2 baths1,784 sq. ft.
1581 Parkside Drive, BELVIDERE, IL 61008
MLS# 202602524Listed by: KELLER WILLIAMS REALTY SIGNATURE $154,900Pending4 beds 2 baths2,068 sq. ft.
220 E Lincoln Avenue, Belvidere, IL 61008
MLS# 12635516Listed by: REAL BROKER, LLC $175,000Pending3 beds 2 baths1,220 sq. ft.
715 E 3rd Street, BELVIDERE, IL 61008
MLS# 202602473Listed by: KELLER WILLIAMS REALTY SIGNATURE $195,000Pending3 beds 2 baths1,688 sq. ft.
525 W Hurlbut Avenue, Belvidere, IL 61008
MLS# 12635434Listed by: DICKERSON & NIEMAN REALTORS - ROCKFORD $359,000Pending4 beds 3 baths2,128 sq. ft.
2535 Mary Street, Belvidere, IL 61008
MLS# 12633437Listed by: VNT REALTY $329,900Pending3 beds 2 baths2,112 sq. ft.
2731 Clines Ford Drive, Belvidere, IL 61008
MLS# 12628326Listed by: BERKSHIRE HATHAWAY HOMESERVICES STARCK REAL ESTATE $250,000Pending4 beds 3 baths2,232 sq. ft.
1240 S Appleton Road, Belvidere, IL 61008
MLS# 12628301Listed by: KELLER WILLIAMS REALTY SIGNATURE $35,000Active2 beds 2 baths1,848 sq. ft.
1202 Spring Circle, BELVIDERE, IL 61008
MLS# 202602282Listed by: KELLER WILLIAMS REALTY SIGNATURE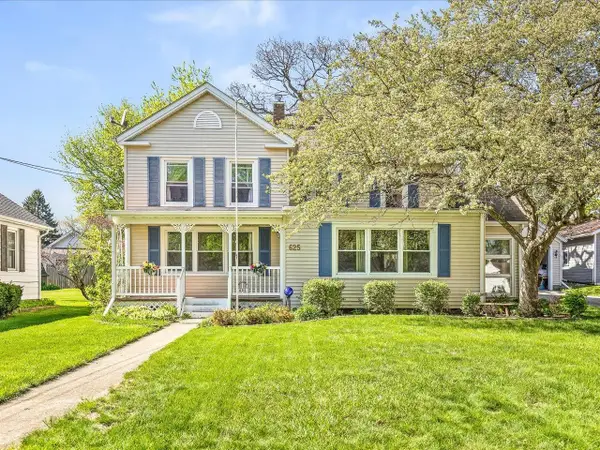 $209,999Pending3 beds 2 baths2,576 sq. ft.
625 W HURLBUT Avenue, BELVIDERE, IL 61008
MLS# 202602277Listed by: DICKERSON & NIEMAN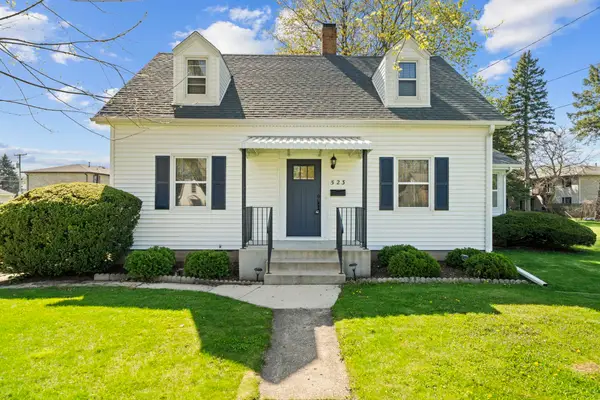 $230,000Pending3 beds 2 baths1,296 sq. ft.
523 W Harrison Street, BELVIDERE, IL 61008
MLS# 202602267Listed by: SMART HOME REALTY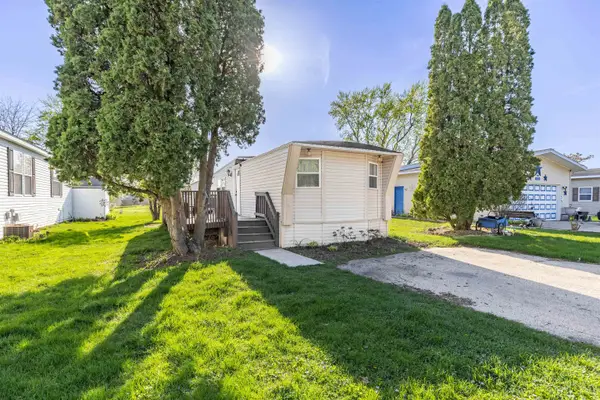 $37,000Active2 beds 1 baths1,008 sq. ft.
403 Spruce Drive, BELVIDERE, IL 61008
MLS# 202602261Listed by: KELLER WILLIAMS REALTY SIGNATURE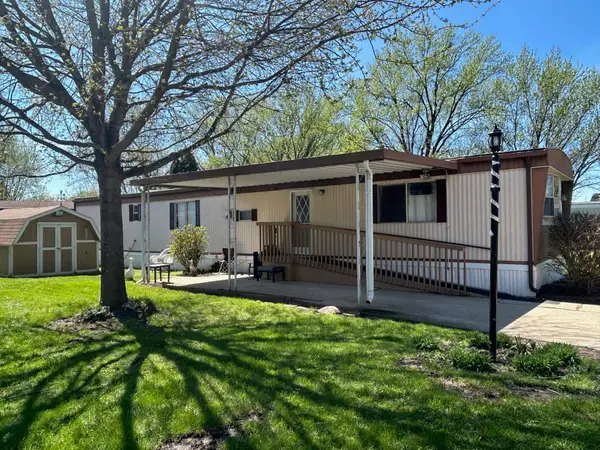 $26,900Active2 beds 1 baths924 sq. ft.
309 Lindenwood Drive, BELVIDERE, IL 61008
MLS# 202602205Listed by: BERKSHIRE HATHAWAY HOMESERVICES STARCK RE $65,000Pending3 beds 2 baths
2250 Sunrise Drive, Belvidere, IL 61008
MLS# 12625320Listed by: BERKSHIRE HATHAWAY HOMESERVICES STARCK REAL ESTATE- New
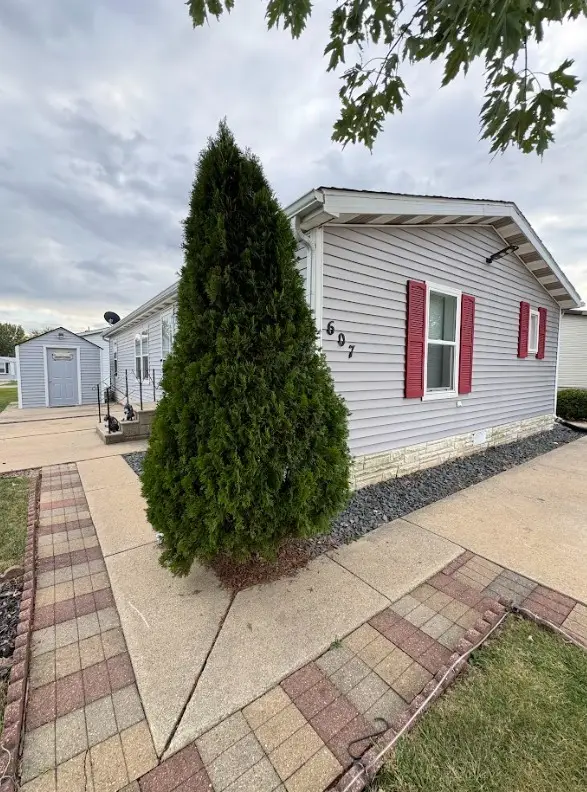 $59,000Active3 beds 2 baths
607 Park Avenue, Belvidere, IL 61008
MLS# 12666773Listed by: KELLER WILLIAMS THRIVE  $242,900Pending4 beds 2 baths2,069 sq. ft.
1014 Caswell Street, BELVIDERE, IL 61008
MLS# 202602096Listed by: KELLER WILLIAMS REALTY SIGNATURE $339,000Pending3 beds 2 baths1,796 sq. ft.
Address Withheld By Seller, Belvidere, IL 61008
MLS# 12618739Listed by: KELLER WILLIAMS REALTY SIGNATURE $89,900Active3 beds 2 baths1,792 sq. ft.
537 Park Avenue, BELVIDERE, IL 61008
MLS# 202602007Listed by: GAMBINO REALTORS $200,000Active2 beds 4 baths
1016 S Main Street, Belvidere, IL 61008
MLS# 12616364Listed by: KELLER WILLIAMS REALTY SIGNATURE $90,000Active3 beds 2 baths
2295 Iris Avenue, Belvidere, IL 61008
MLS# 12614236Listed by: COLDWELL BANKER REALTY $219,900Pending4 beds 3 baths
1121 8th Avenue, Belvidere, IL 61008
MLS# 12613116Listed by: BERKSHIRE HATHAWAY HOMESERVICES STARCK REAL ESTATE $220,000Active5 beds 2 baths4,448 sq. ft.
628 Buchanan Street, BELVIDERE, IL 61008
MLS# 202601786Listed by: CENTURY 21 AFFILIATED $59,900Active3 beds 2 baths1,344 sq. ft.
4001 GREENSPIRE, BELVIDERE, IL 61008
MLS# 202601784Listed by: DICKERSON & NIEMAN $359,000Active3 beds 3 baths2,041 sq. ft.
8722 Sheffield Drive, Belvidere, IL 61008
MLS# 12604617Listed by: EXP REALTY $340,000Pending5 beds 3 baths10,001 sq. ft.
520 Calgary Way, Belvidere, IL 61008
MLS# 12601593Listed by: UNIVERSAL REAL ESTATE LLC $120,000Active3 beds 2 baths1,680 sq. ft.
447 Seasons Parkway, BELVIDERE, IL 61008
MLS# 202601638Listed by: GAMBINO REALTORS $32,500Pending2 beds 2 baths924 sq. ft.
1206 Spring Circle, BELVIDERE, IL 61008
MLS# 202601561Listed by: GAMBINO REALTORS $52,000Active3 beds 2 baths
541 Park Avenue, Belvidere, IL 61008
MLS# 12596520Listed by: SMART HOME REALTY $225,000Pending3 beds 2 baths1,637 sq. ft.
900 Whitney Boulevard, Belvidere, IL 61008
MLS# 12590236Listed by: REAL BROKER, LLC $399,900Pending-- beds -- baths1,761 sq. ft.
601 Pearl Street, BELVIDERE, IL 61008
MLS# 202601125Listed by: KELLER WILLIAMS REALTY SIGNATURE $59,900Active3 beds 2 baths1,568 sq. ft.
3708 Greenspire Court, BELVIDERE, IL 61008
MLS# 202600938Listed by: WEICHERT REALTORS - TOVAR PROPERTIES $750,000Active5 beds 4 baths4,100 sq. ft.
2520 Us Route 20 Street, Belvidere, IL 61008
MLS# 12567262Listed by: EXIT REAL ESTATE PARTNERS $235,000Pending4 beds 2 baths1,872 sq. ft.
1419 7th Avenue, BELVIDERE, IL 61008
MLS# 202600517Listed by: KELLER WILLIAMS THRIVE $239,000Pending3 beds 2 baths2,331 sq. ft.
407 Allen St, BELVIDERE, IL 61008
MLS# 202600462Listed by: EXIT REALTY REDEFINED MAURER GROUP $300,000Active1.88 Acres
1803 Kristine Drive, BELVIDERE, IL 61008
MLS# 202507669Listed by: DICKERSON & NIEMAN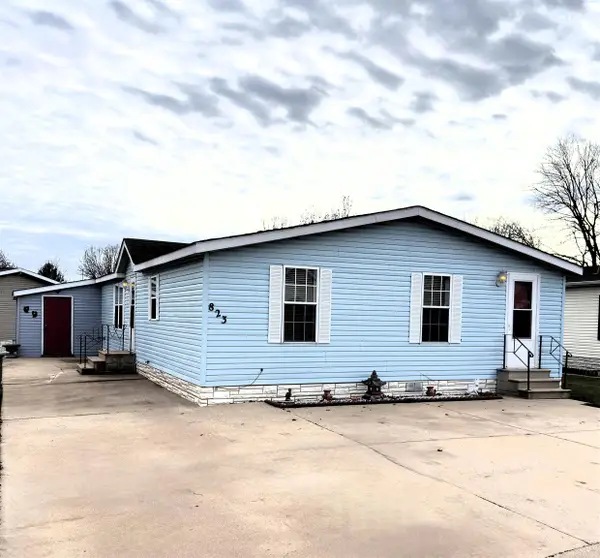 $67,000Active3 beds 2 baths1,568 sq. ft.
823 Fox Lane, BELVIDERE, IL 61008
MLS# 202507271Listed by: GAMBINO REALTORS $386,220Active3 beds 3 baths2,018 sq. ft.
5165 Sparrow Drive, Belvidere, IL 61008
MLS# 12517369Listed by: DICKERSON & NIEMAN REALTORS - ROCKFORD $370,315Pending3 beds 3 baths1,922 sq. ft.
4483 Spotted Deer Trail, Belvidere, IL 61008
MLS# 12517652Listed by: DICKERSON & NIEMAN REALTORS - ROCKFORD $398,539Pending3 beds 2 baths2,040 sq. ft.
5149 Sparrow Drive, Belvidere, IL 61008
MLS# 12517428Listed by: DICKERSON & NIEMAN REALTORS - ROCKFORD $364,110Pending3 beds 2 baths1,823 sq. ft.
679 Clarksen Drive, Belvidere, IL 61008
MLS# 12517520Listed by: DICKERSON & NIEMAN REALTORS - ROCKFORD $358,710Active3 beds 2 baths1,819 sq. ft.
633 CLARKSEN Drive, BELVIDERE, IL 61008
MLS# 202506958Listed by: DICKERSON & NIEMAN $340,000Active3 beds 3 baths2,284 sq. ft.
1311 Conlin Court, BELVIDERE, IL 61008
MLS# 202506880Listed by: BLACK CASTLE PROPERTIES $539,000Active3 beds 3 baths2,170 sq. ft.
4137 Waters Edge Drive, Belvidere, IL 61008
MLS# 12457611Listed by: KELLER WILLIAMS REALTY SIGNATURE $282,400Active2 beds 2 baths1,435 sq. ft.
586 Fuller Lane, BELVIDERE, IL 61008
MLS# 202505201Listed by: BERKSHIRE HATHAWAY HOMESERVICES STARCK RE $282,400Active2 beds 2 baths1,435 sq. ft.
588 Fuller Lane, BELVIDERE, IL 61008
MLS# 202505204Listed by: BERKSHIRE HATHAWAY HOMESERVICES STARCK RE $282,400Active2 beds 2 baths1,435 sq. ft.
566 Fuller Lane, BELVIDERE, IL 61008
MLS# 202505199Listed by: BERKSHIRE HATHAWAY HOMESERVICES STARCK RE $294,400Active2 beds 2 baths1,435 sq. ft.
882 Fuller Lane, BELVIDERE, IL 61008
MLS# 202505185Listed by: BERKSHIRE HATHAWAY HOMESERVICES STARCK RE $298,900Active2 beds 2 baths1,435 sq. ft.
880 Fuller Lane, BELVIDERE, IL 61008
MLS# 202505184Listed by: BERKSHIRE HATHAWAY HOMESERVICES STARCK RE $72,000Active1.26 Acres
5502 River Run Parkway, BELVIDERE, IL 61008
MLS# 202505172Listed by: KELLER WILLIAMS REALTY SIGNATURE $137,000Active2.46 Acres
5502 River Run Parkway, BELVIDERE, IL 61008
MLS# 202504931Listed by: KELLER WILLIAMS REALTY SIGNATURE $65,000Active1.2 Acres
926 Driftwood Court, BELVIDERE, IL 61008
MLS# 202504933Listed by: KELLER WILLIAMS REALTY SIGNATURE $39,900Active0.31 Acres
659 Boz Way, BELVIDERE, IL 61008
MLS# 202504020Listed by: KEY REALTY, INC $207,000Active1.04 Acres
Lot 6 Corporate Parkway, Belvidere, IL 61008
MLS# 11927139Listed by: HOMETOWN REALTY, LTD. $340,000Active1.74 Acres
Lot 9 Keene Parkway, Belvidere, IL 61008
MLS# 11927398Listed by: HOMETOWN REALTY, LTD.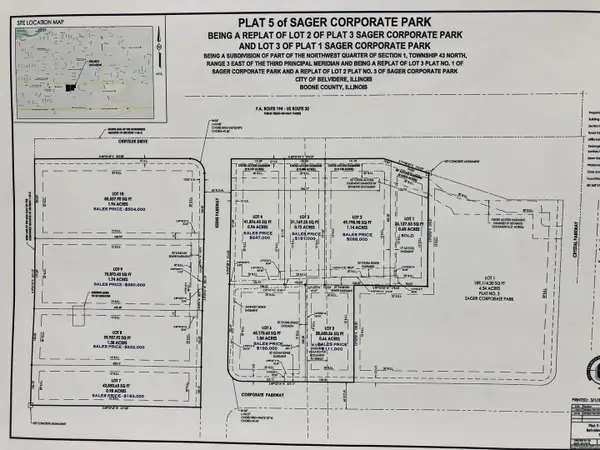 $560,000Active1.96 Acres
Lot 10 Keene Parkway, Belvidere, IL 61008
MLS# 11927404Listed by: HOMETOWN REALTY, LTD. $330,000Active1.14 Acres
Lot 2 Chrysler Drive, Belvidere, IL 61008
MLS# 11927005Listed by: HOMETOWN REALTY, LTD. $210,000Active0.72 Acres
Lot 3 Chrysler Drive, Belvidere, IL 61008
MLS# 11927045Listed by: HOMETOWN REALTY, LTD. $280,000Active0.96 Acres
Lot 4 Chrysler Drive, Belvidere, IL 61008
MLS# 11927060Listed by: HOMETOWN REALTY, LTD.
Local realty services provided by:CENTURY 21 Affiliated, CENTURY 21 Circle
Copyright 2026 Midwest Real Estate Data LLC. All rights reserved. The data relating to real estate for sale on this web site comes in part from the Broker Reciprocity Program of the Midwest Real Estate Data LLC. Listing information is deemed reliable but not guaranteed.
Neighborhoods near Belvidere, IL
Zip codes near Belvidere, IL
- 60033 homes for sale
- 60135 homes for sale
- 60145 homes for sale
- 60146 homes for sale
- 60152 homes for sale
- 60180 homes for sale
- 61008 homes for sale
- 61011 homes for sale
- 61012 homes for sale
- 61016 homes for sale
- 61065 homes for sale
- 61073 homes for sale
- 61103 homes for sale
- 61104 homes for sale
- 61107 homes for sale
- 61108 homes for sale
- 61109 homes for sale
- 61111 homes for sale
- 61114 homes for sale
- 61115 homes for sale
Popular searches near Belvidere, IL
- Belvidere township homes for sale
- Bonus homes for sale
- Boone homes for sale
- Caledonia Township homes for sale
- Caledonia homes for sale
- Candlewick Lake homes for sale
- Capron homes for sale
- Cherry Valley homes for sale
- Cherry Valley homes for sale
- Cherry Valley Township homes for sale
- Flora homes for sale
- Franklin homes for sale
- Kingston Township homes for sale
- Loves Park homes for sale
- Marengo Township homes for sale
- Poplar Grove homes for sale
- Poplar Grove township homes for sale
- Riley Township homes for sale
- Rockford homes for sale
- Timberlane homes for sale
Protect your home and budget from life's surprises with an Assurant Home Warranty, backed by a partner that supports you through every step of homeownership. Explore Plans.
©2026 Century 21 Real Estate LLC. All rights reserved. CENTURY 21®, the CENTURY 21 Logo and C21® are service marks owned by Century 21 Real Estate LLC. Century 21 Real Estate LLC fully supports the principles of the Fair Housing Act and the Equal Opportunity Act. Each office is independently owned and operated. Listing information is deemed reliable but not guaranteed accurate.