- Cielo Vista, San Antonio homes for sale
- College Park, San Antonio homes for sale
- Crownridge Of Texas, San Antonio homes for sale
- Dominion, San Antonio homes for sale
- Fair Oaks Ranch, Fair Oaks Ranch homes for sale
- Forest Crest, San Antonio homes for sale
- Friends of Friedrich Wilderness Park, San Antonio homes for sale
- Grey Forest, Helotes homes for sale
- Helotes, Helotes homes for sale
- Hunter's Chase, San Antonio homes for sale
- Iron Horse Canyon, Helotes homes for sale
- Kinder Ranch, San Antonio homes for sale
- La Cantera, San Antonio homes for sale
- Northwest San Antonio, Helotes homes for sale
- Rogers Ranch, San Antonio homes for sale
- Sonoma Ranch, Helotes homes for sale
- Stage Coach Hills, San Antonio homes for sale
- Stonehaven, San Antonio North homes for sale
- The Heights at Stone Oaks, San Antonio homes for sale
- Timber Wood Park, San Antonio homes for sale
Boerne, TX - homes for sale
300 of 398 results displayed
- New
 $649,000Active4 beds 3 baths2,969 sq. ft.
111 Huntwick Dr, Boerne, TX 78006
MLS# 1993188Listed by: EXP REALTY - New
 $879,000Active4 beds 3 baths2,740 sq. ft.
230 W Hosack St, Boerne, TX 78006
MLS# 1993162Listed by: KUPER SOTHEBY'S INT'L REALTY - New
 $349,500Active3 beds 2 baths1,688 sq. ft.
220 Jordan Place, Boerne, TX 78006
MLS# 1993141Listed by: PHYLLIS BROWNING COMPANY - Open Sat, 11am to 2pmNew
 $750,000Active4 beds 3 baths3,094 sq. ft.
109 El Cielo, Boerne, TX 78006
MLS# 1958723Listed by: KELLER WILLIAMS BOERNE - New
 $650,000Active3 beds 3 baths2,662 sq. ft.
340 James St, Boerne, TX 78006
MLS# 1970219Listed by: KELLER WILLIAMS CITY-VIEW - New
 $925,000Active4 beds 4 baths2,856 sq. ft.
34 J Williams Rd, Boerne, TX 78006
MLS# 1985000Listed by: REAL BROKER, LLC - New
 $340,000Active3 beds 2 baths1,690 sq. ft.
224 Azalea Trail, Boerne, TX 78006
MLS# 1992909Listed by: PHYLLIS BROWNING COMPANY  $375,000Pending4.01 Acres
LOT 45 Sabinas Creek Ranch, Boerne, TX 78006
MLS# 1992824Listed by: PHYLLIS BROWNING COMPANY- New
 $1,595,000Active4 beds 6 baths4,094 sq. ft.
107 Lajitas, Boerne, TX 78006
MLS# 1992665Listed by: KUPER SOTHEBY'S INT'L REALTY - New
 $1,650,000Active3 beds 3 baths3,239 sq. ft.
106B Fm 1376, Boerne, TX 78006
MLS# 1992378Listed by: LEGACY BROKER GROUP - New
 $599,900Active4 beds 3 baths2,879 sq. ft.
110 Stablewood Ct, Boerne, TX 78006
MLS# 1992299Listed by: RE/MAX NORTH-SAN ANTONIO - New
 $667,600Active4 beds 4 baths2,685 sq. ft.
140 Rainwater Creek, Boerne, TX 78006
MLS# 1991758Listed by: DINA VERTERAMO, BROKER - New
 $721,690Active5 beds 6 baths3,468 sq. ft.
112 Rainwater Creek, Boerne, TX 78006
MLS# 1991759Listed by: DINA VERTERAMO, BROKER - New
 $689,995Active3 beds 2 baths1,811 sq. ft.
139 W Hosack St, Boerne, TX 78006
MLS# 1991734Listed by: PHYLLIS BROWNING COMPANY - New
 $745,000Active5 beds 4 baths4,156 sq. ft.
127 Noble Woods, Boerne, TX 78006
MLS# 1991722Listed by: WELLSTONE PROPERTIES - Open Sat, 12 to 2pmNew
 $639,000Active5 beds 4 baths3,337 sq. ft.
109 Alder Woods, Boerne, TX 78006
MLS# 1991394Listed by: PHYLLIS BROWNING COMPANY - New
 $419,900Active4 beds 3 baths2,601 sq. ft.
117 Winding Windmill, Boerne, TX 78006
MLS# 1991298Listed by: KELLER WILLIAMS BOERNE - New
 $519,000Active5 beds 4 baths3,958 sq. ft.
109 Rattlesnake Bluff, Boerne, TX 78006
MLS# 1991203Listed by: PHYLLIS BROWNING COMPANY - New
 $439,990Active3 beds 2 baths1,908 sq. ft.
102 Bretford, Boerne, TX 78006
MLS# 1991154Listed by: EXP REALTY - New
 $385,000Active2 beds 1 baths1,510 sq. ft.
114 Short St, Boerne, TX 78006
MLS# 1990972Listed by: LPT REALTY, LLC - Open Sat, 11am to 2pmNew
 $487,777Active3 beds 2 baths1,860 sq. ft.
213 Ranger Dr, Boerne, TX 78006
MLS# 1990842Listed by: KELLER WILLIAMS HERITAGE - New
 $400,000Active4 beds 2 baths2,020 sq. ft.
123 Latigo Ln, Boerne, TX 78006
MLS# 1990711Listed by: TEXAS PREMIER REALTY - New
 $875,000Active14.13 Acres
117 Thunder Valley, Boerne, TX 78006
MLS# 1990598Listed by: PHYLLIS BROWNING COMPANY  $703,022Pending5 beds 5 baths3,403 sq. ft.
201 Boulder Creek, Boerne, TX 78006
MLS# 1990436Listed by: DINA VERTERAMO, BROKER $798,363Pending5 beds 6 baths3,477 sq. ft.
215 Boulder Creek, Boerne, TX 78006
MLS# 1990441Listed by: DINA VERTERAMO, BROKER- New
 $399,190Active4 beds 3 baths2,029 sq. ft.
312 Jersey Ln, Boerne, TX 78006
MLS# 1990399Listed by: MOVE UP AMERICA - New
 $389,510Active4 beds 3 baths1,837 sq. ft.
216 Jersey Ln, Boerne, TX 78006
MLS# 1990401Listed by: MOVE UP AMERICA - New
 $395,250Active4 beds 2 baths1,688 sq. ft.
224 Jersey Lane, Boerne, TX 78006
MLS# 1990379Listed by: MOVE UP AMERICA  $732,900Pending4 beds 4 baths2,944 sq. ft.
201 Fandango, Boerne, TX 78006
MLS# 1990358Listed by: PERRY HOMES REALTY, LLC- New
 $435,000Active5 beds 3 baths3,127 sq. ft.
117 Sage Canyon, Boerne, TX 78006
MLS# 1990333Listed by: LONESTAR PROPERTIES - New
 $615,000Active4 beds 4 baths3,388 sq. ft.
205 Woods Of Boerne, Boerne, TX 78006
MLS# 1990256Listed by: GURNEY KING, REALTORS - New
 $599,100Active5 beds 4 baths3,743 sq. ft.
117 Farming Grv, Boerne, TX 78006
MLS# 1982240Listed by: MOVE UP AMERICA - Open Sat, 12 to 2pmNew
 $799,000Active5 beds 5 baths3,741 sq. ft.
103 Palisades, Boerne, TX 78006
MLS# 1973698Listed by: PHYLLIS BROWNING COMPANY  $285,000Pending2 beds 2 baths1,526 sq. ft.
125 View Point Drive E, Boerne, TX 78006
MLS# 10640303Listed by: COREY SMITH, REALTOR- Open Sat, 11am to 1pmNew
 $1,499,000Active3 beds 4 baths3,752 sq. ft.
193 Ranch Hts, Boerne, TX 78015
MLS# 1973682Listed by: REAL ESTATE MUSES  $530,000Active4 beds 3 baths2,974 sq. ft.
146 Stablewood Ct, Boerne, TX 78006
MLS# 1973435Listed by: REDKORR REALTY LLC $364,277Active2 beds 2 baths996 sq. ft.
530 #1000 Oak Park Dr, Boerne, TX 78006
MLS# 1973284Listed by: KELLER WILLIAMS BOERNE $469,000Active3 beds 1 baths970 sq. ft.
528 Frey St, Boerne, TX 78006
MLS# 1973266Listed by: TR REAL CO, LLC $722,900Active4 beds 4 baths2,942 sq. ft.
221 Sasparilla, Boerne, TX 78006
MLS# 1973080Listed by: PERRY HOMES REALTY, LLC $679,900Active4 beds 3 baths2,663 sq. ft.
225 Sasparilla, Boerne, TX 78006
MLS# 1973066Listed by: PERRY HOMES REALTY, LLC $550,000Active4 beds 3 baths2,437 sq. ft.
120 Escondido, Boerne, TX 78006
MLS# 1973023Listed by: KELLER WILLIAMS CITY-VIEW $739,900Active4 beds 3 baths2,709 sq. ft.
188 Cimarron Creek, Boerne, TX 78006
MLS# 1972985Listed by: PRIME REAL ESTATE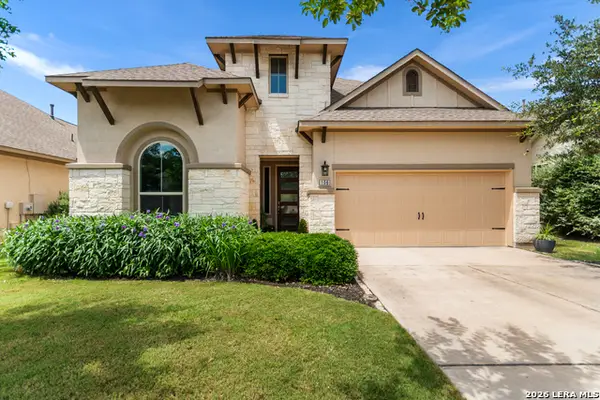 $499,000Active4 beds 3 baths2,846 sq. ft.
106 Escondido, Boerne, TX 78006
MLS# 1972955Listed by: KELLER WILLIAMS BOERNE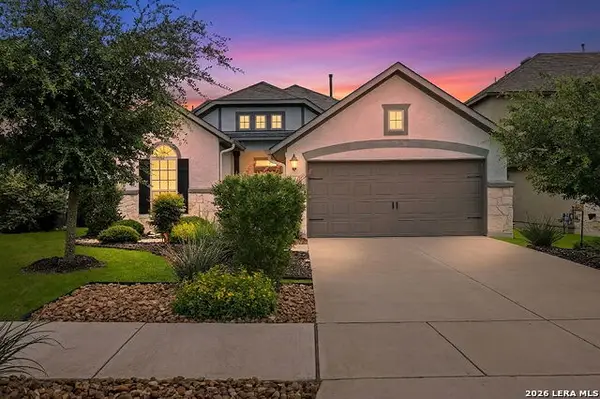 $475,000Active4 beds 2 baths1,611 sq. ft.
127 Talavera, Boerne, TX 78006
MLS# 1972928Listed by: KELLER WILLIAMS CITY-VIEW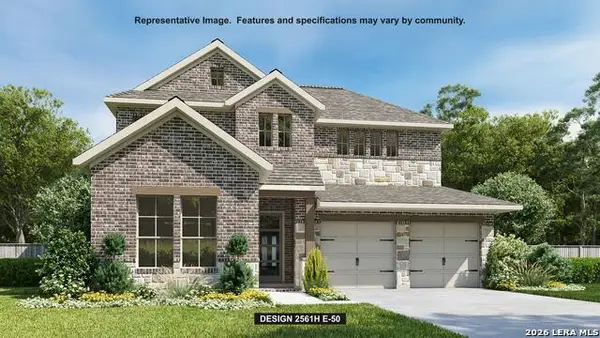 $624,900Active4 beds 4 baths2,561 sq. ft.
124 Brown Swiss Ridge, Boerne, TX 78006
MLS# 1972756Listed by: PERRY HOMES REALTY, LLC $927,900Active4 beds 4 baths3,526 sq. ft.
132 Alonzo, Boerne, TX 78006
MLS# 1972709Listed by: HOMESUSA.COM $430,000Active2 beds 2 baths1,075 sq. ft.
111 Brackenridge, Boerne, TX 78006
MLS# 1967065Listed by: KUPER SOTHEBY'S INT'L REALTY $399,999Pending5 beds 3 baths2,469 sq. ft.
100 Dusty Corral, Boerne, TX 78006
MLS# 1972564Listed by: LONESTAR PROPERTIES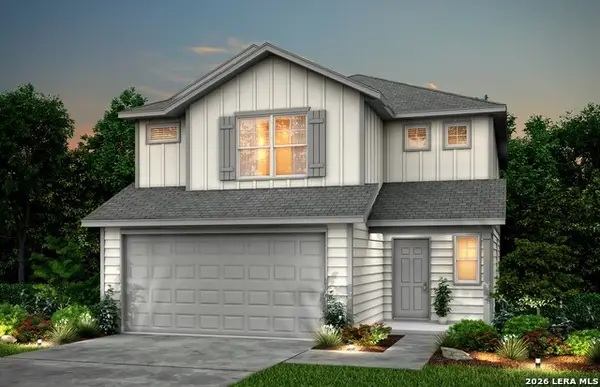 $399,390Active4 beds 3 baths2,029 sq. ft.
212 Jersey Lane, Boerne, TX 78006
MLS# 1972570Listed by: MOVE UP AMERICA $425,000Active3 beds 3 baths2,508 sq. ft.
408 Sambar Bay Dr, Boerne, TX 78005
MLS# 124580Listed by: KERRVILLE REAL ESTATE COMPANY $212,500Active1.1 Acres
9 Ledgestone Trl, Boerne, TX 78006
MLS# 1972027Listed by: EXP REALTY $360,000Active4 beds 2 baths1,699 sq. ft.
105 Rolling Crk, Boerne, TX 78006
MLS# 1971810Listed by: PHILLIPS & ASSOCIATES REALTY $365,000Active3 beds 2 baths1,582 sq. ft.
324 Lasso Falls, Boerne, TX 78006
MLS# 1971657Listed by: LONESTAR PROPERTIES $1,198,630Active4 beds 5 baths3,998 sq. ft.
210 Navarro, Boerne, TX 78006
MLS# 1971492Listed by: DINA VERTERAMO, BROKER $799,180Active4 beds 5 baths3,032 sq. ft.
520 Dulce Vista, Boerne, TX 78006
MLS# 1971505Listed by: DINA VERTERAMO, BROKER $821,580Active4 beds 4 baths3,450 sq. ft.
113 Corazon, Boerne, TX 78006
MLS# 1971507Listed by: DINA VERTERAMO, BROKER $645,000Active4 beds 4 baths3,781 sq. ft.
236 Woods Of Boerne Blvd, Boerne, TX 78006
MLS# 1971383Listed by: REAL BROKER, LLC $1,269,999Active4 beds 4 baths3,340 sq. ft.
349 Menger Springs, Boerne, TX 78006
MLS# 1971342Listed by: KELLER WILLIAMS BOERNE $1,750,000Active4 beds 5 baths4,346 sq. ft.
643 Menger Spgs, Boerne, TX 78006
MLS# 1971300Listed by: PHYLLIS BROWNING COMPANY $299,000Pending4 beds 2 baths1,910 sq. ft.
109 Glenn Oaks Dr, Boerne, TX 78006
MLS# 1971263Listed by: WELCOME HOME REAL ESTATE $449,900Active3 beds 2 baths1,284 sq. ft.
212 Shadywood, Boerne, TX 78006
MLS# 1971184Listed by: PHYLLIS BROWNING COMPANY $1,350,000Pending4 beds 3 baths3,174 sq. ft.
340 Marvil Lee, Boerne, TX 78006
MLS# 1971143Listed by: PHYLLIS BROWNING COMPANY- Open Sat, 11am to 2pm
 $519,777Active5 beds 4 baths2,886 sq. ft.
139 E Flowing River Dr, Boerne, TX 78006
MLS# 1971057Listed by: KELLER WILLIAMS HERITAGE  $495,000Active5 beds 3 baths2,879 sq. ft.
228 Winding Riv, Boerne, TX 78006
MLS# 1968815Listed by: COLDWELL BANKER D'ANN HARPER $750,000Active2 beds 2 baths1,479 sq. ft.
119 E Evergreen St, Boerne, TX 78006
MLS# 1966067Listed by: KELLER WILLIAMS CITY-VIEW $449,000Active3 beds 2 baths1,458 sq. ft.
106 Lehmann St, Boerne, TX 78006
MLS# 1970679Listed by: LEGACY BROKER GROUP $349,900Active1.23 Acres
104 Oak Acres Ln, Boerne, TX 78006
MLS# 1970640Listed by: THE HOUSE COMPANY $745,000Active5 beds 4 baths3,740 sq. ft.
108 La Cima, Boerne, TX 78006
MLS# 1970593Listed by: PHYLLIS BROWNING COMPANY $199,250Active2 beds 2 baths1,116 sq. ft.
603 Oak Park Dr Drive, Boerne, TX 78006
MLS# 615123 $374,900Active3 beds 2 baths1,533 sq. ft.
208 Latigo Ln, Boerne, TX 78006
MLS# 1970061Listed by: PHYLLIS BROWNING COMPANY $210,000Active5.21 Acres
L92 Billings Forest, Boerne, TX 78006
MLS# 1969657Listed by: COMPASS RE TEXAS, LLC. $575,000Active3 beds 2 baths1,559 sq. ft.
324 Ebner St, Boerne, TX 78006
MLS# 1969495Listed by: KELLER WILLIAMS BOERNE $379,000Active2 beds 3 baths1,357 sq. ft.
2104 Paniolo, Boerne, TX 78006
MLS# 1969479Listed by: HILL COUNTRY HOME AND LAND LLC $350,000Active3 beds 2 baths1,627 sq. ft.
115 Bentwood Dr, Boerne, TX 78006
MLS# 1969410Listed by: KUPER SOTHEBY'S INT'L REALTY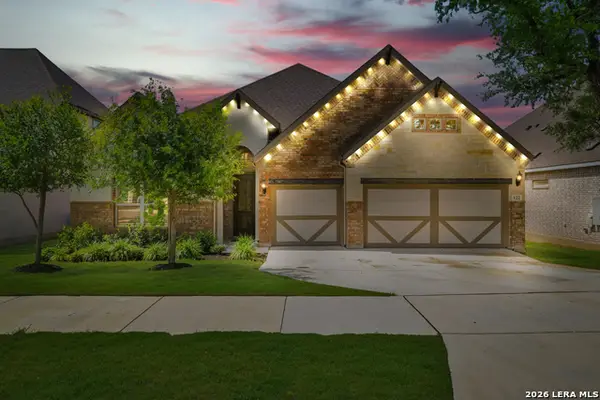 $629,999Active4 beds 3 baths2,922 sq. ft.
122 Huntwick, San Antonio, TX 78006
MLS# 1969359Listed by: REAL BROKER, LLC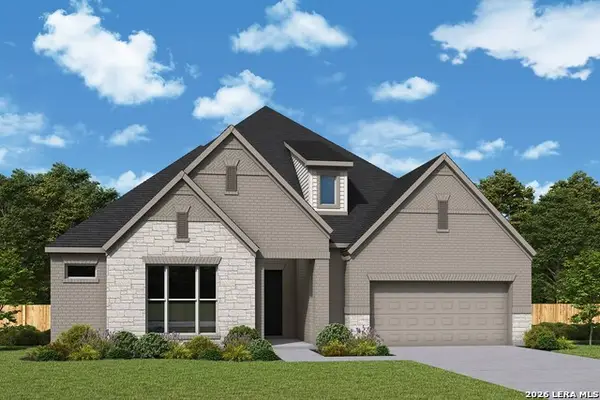 $624,990Active4 beds 3 baths2,803 sq. ft.
27511 Moonglade Rd, Boerne, TX 78006
MLS# 1969327Listed by: DAVID WEEKLEY HOMES, INC.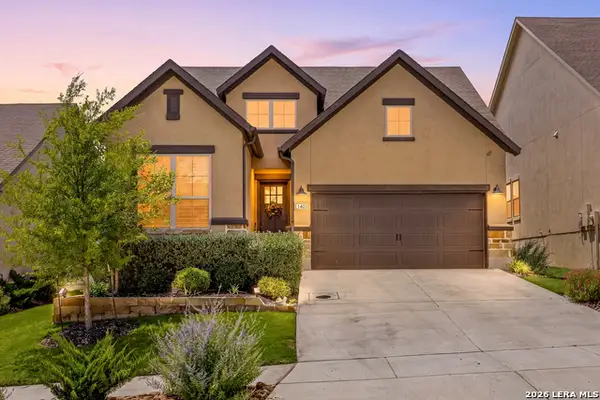 $519,999Active2 beds 2 baths1,873 sq. ft.
140 Sentido, Boerne, TX 78006
MLS# 1969185Listed by: REDFIN CORPORATION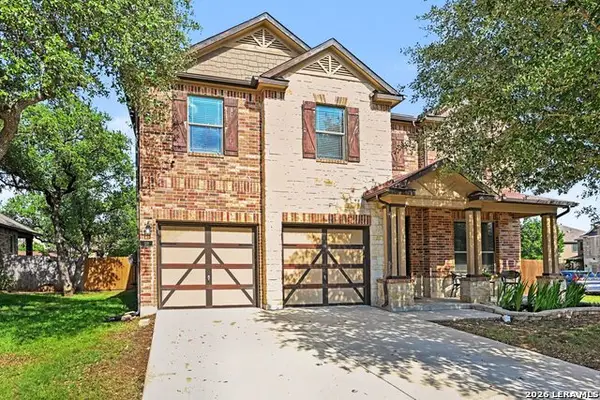 $489,000Active5 beds 3 baths3,254 sq. ft.
129 Rocky Path, Boerne, TX 78006
MLS# 1969136Listed by: LPT REALTY, LLC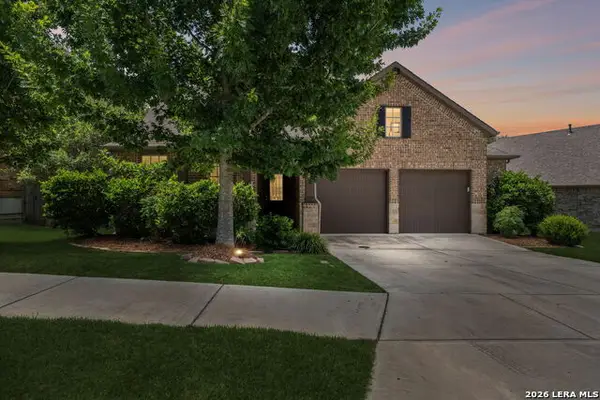 $550,000Active4 beds 3 baths3,070 sq. ft.
121 Cimarron Crk, Boerne, TX 78006
MLS# 1968982Listed by: REAL BROKER, LLC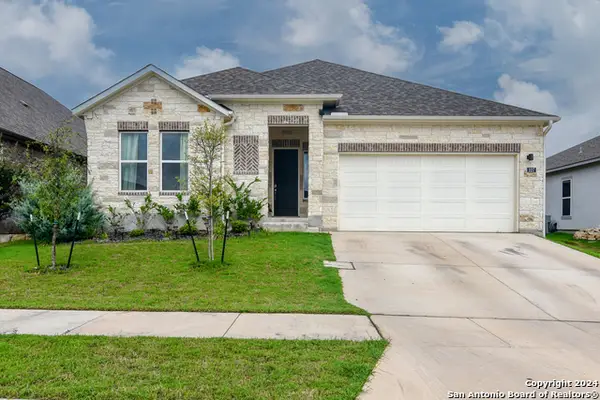 $560,000Active4 beds 3 baths2,584 sq. ft.
107 Cheslyn, Boerne, TX 78006
MLS# 1969006Listed by: RE/MAX ASSOCIATES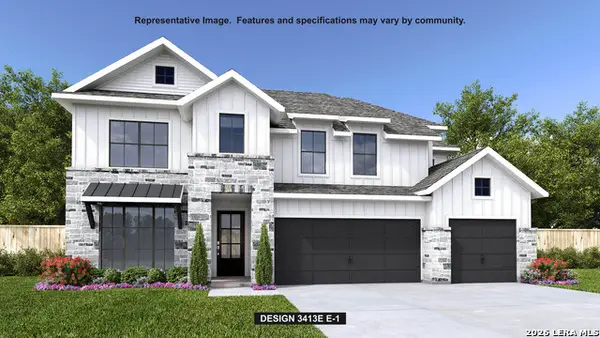 $760,900Pending4 beds 5 baths3,413 sq. ft.
325 Fandango, Boerne, TX 78006
MLS# 1968897Listed by: PERRY HOMES REALTY, LLC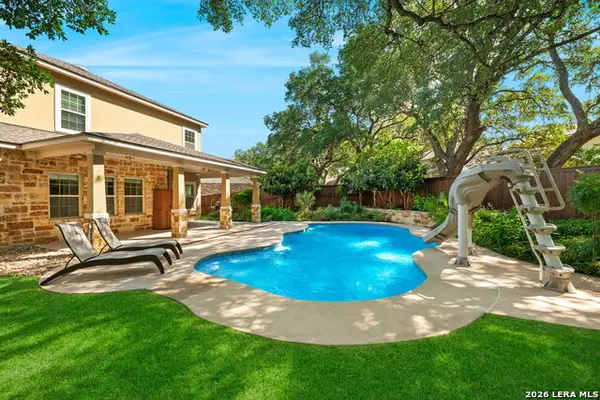 $700,000Active5 beds 4 baths4,085 sq. ft.
221 Windsor Dr, Boerne, TX 78006
MLS# 1968929Listed by: REAL BROKER, LLC $2,100,000Active4 beds 3 baths3,617 sq. ft.
105 Lodge Spgs, Boerne, TX 78006
MLS# 1968748Listed by: REAL BROKER, LLC $1,056,900Active4 beds 4 baths3,478 sq. ft.
120 Alonzo, Boerne, TX 78006
MLS# 1968773Listed by: PERRY HOMES REALTY, LLC $625,000Active3 beds 2 baths1,698 sq. ft.
126 Kenwood Ave, Boerne, TX 78006
MLS# 1968707Listed by: HILL COUNTRY FLAT FEE REALTY $625,000Active3 beds 3 baths2,244 sq. ft.
41 W Mariposa Parkway, Boerne, TX 78006
MLS# 1968401Listed by: KELLER WILLIAMS BOERNE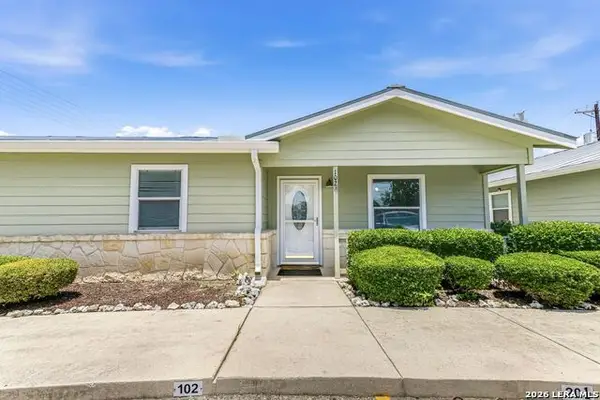 $270,000Active3 beds 2 baths1,132 sq. ft.
121 S Plant #APT 102, Boerne, TX 78006
MLS# 1967797Listed by: EXP REALTY $399,700Active4 beds 2 baths1,688 sq. ft.
204 Jersey Lane, Boerne, TX 78006
MLS# 1968368Listed by: MOVE UP AMERICA $369,610Active3 beds 2 baths1,512 sq. ft.
209 Jersey Lane, Boerne, TX 78006
MLS# 1968372Listed by: MOVE UP AMERICA $721,690Active5 beds 6 baths3,468 sq. ft.
136 Rainwater Creek, Boerne, TX 78006
MLS# 1968060Listed by: DINA VERTERAMO, BROKER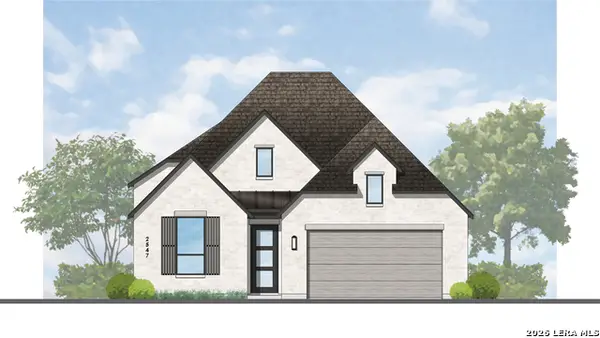 $649,158Active4 beds 5 baths2,593 sq. ft.
108 Rainwater Creek, Boerne, TX 78006
MLS# 1968080Listed by: DINA VERTERAMO, BROKER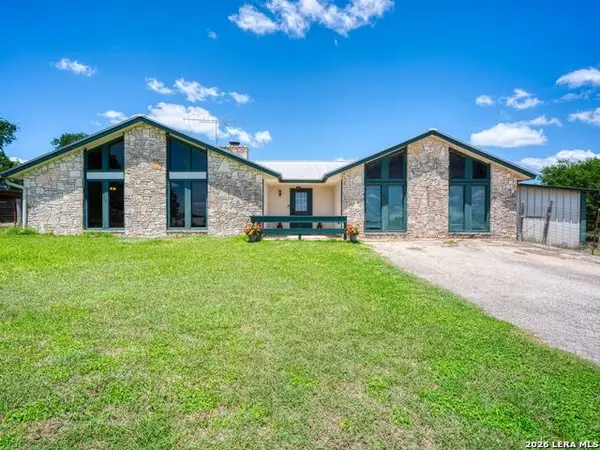 $525,000Pending3 beds 2 baths2,254 sq. ft.
122 Steel Valley Dr, Boerne, TX 78006
MLS# 1968083Listed by: KUPER SOTHEBY'S INT'L REALTY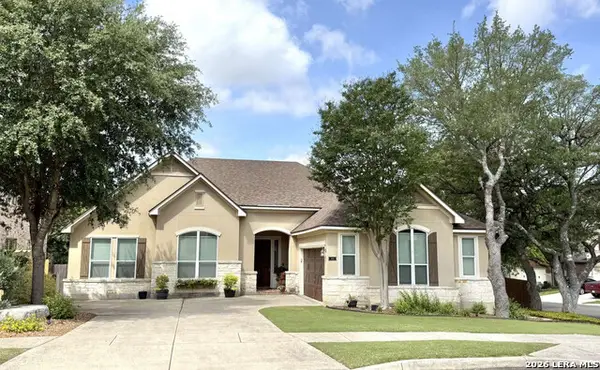 $509,000Active4 beds 4 baths3,040 sq. ft.
100 Rattlesnake Blf, Boerne, TX 78006
MLS# 1967833Listed by: CONGRESS REALTY, INC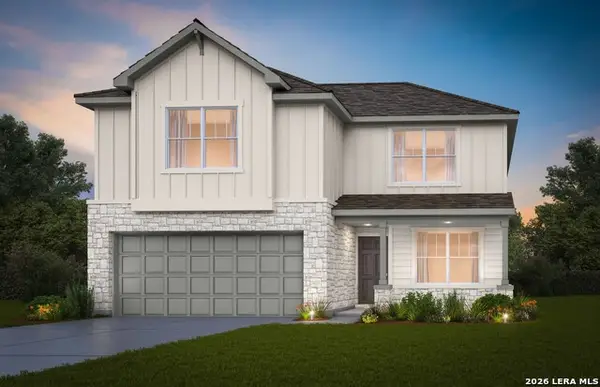 $439,960Active5 beds 3 baths2,466 sq. ft.
317 Jersey Lane, Boerne, TX 78006
MLS# 1967722Listed by: MOVE UP AMERICA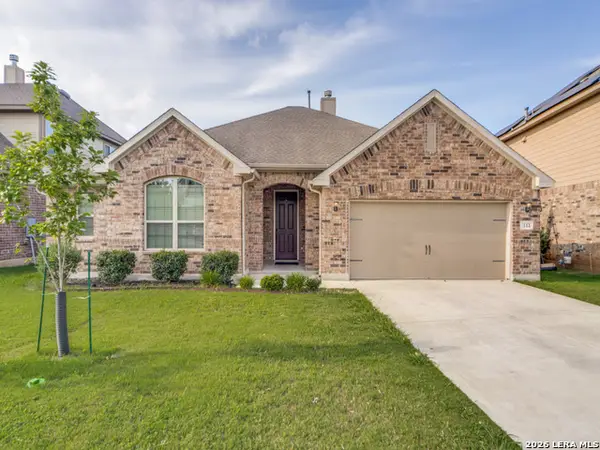 $529,750Active3 beds 2 baths2,112 sq. ft.
111 Arbor Woods, Boerne, TX 78006
MLS# 1967459Listed by: RE/MAX NORTH-SAN ANTONIO $469,000Pending3 beds 2 baths1,890 sq. ft.
138 Stonegate North Dr, Boerne, TX 78006
MLS# 1967250Listed by: KELLER WILLIAMS CITY-VIEW $300,000Pending1.51 Acres
11472 Cat Springs, Boerne, TX 78006
MLS# 1967219Listed by: PINNACLE REALTY ADVISORS $540,000Active3 beds 3 baths2,132 sq. ft.
477 Vamanos, Boerne, TX 78006
MLS# 1966994Listed by: KELLER WILLIAMS BOERNE $345,000Pending-- beds -- baths1,686 sq. ft.
716 -718 Rosewood, Boerne, TX 78006
MLS# 1966688Listed by: WELCOME HOME REAL ESTATE $850,000Active5 beds 6 baths3,675 sq. ft.
402 Fandango, Boerne, TX 78006
MLS# 1966740Listed by: PHYLLIS BROWNING COMPANY $599,000Active4 beds 3 baths2,766 sq. ft.
123 Capano Crk, Boerne, TX 78006
MLS# 1966575Listed by: KELLER WILLIAMS BOERNE $750,777Active4 beds 3 baths3,000 sq. ft.
135 Wild Rose Hl, Boerne, TX 78006
MLS# 1966521Listed by: KELLER WILLIAMS HERITAGE $2,825,000Active5 beds 7 baths6,964 sq. ft.
108 Peach Spgs, Boerne, TX 78006
MLS# 1963214Listed by: THE AGENCY SAN ANTONIO $640,000Active5 beds 4 baths3,100 sq. ft.
501 Huntwick Drive, Boerne, TX 78006
MLS# 1966480Listed by: NEW HOME REALTY $424,900Active4 beds 3 baths2,616 sq. ft.
117 Retama Rd, Boerne, TX 78006
MLS# 1966495Listed by: HILL COUNTRY FLAT FEE REALTY $449,000Active4 beds 3 baths2,921 sq. ft.
121 Abbeydell, Boerne, TX 78015
MLS# 1958688Listed by: CLOVER PROPERTIES, LLC $419,430Active4 beds 3 baths2,079 sq. ft.
217 Jersey Lane, Boerne, TX 78006
MLS# 1965622Listed by: MOVE UP AMERICA $1,002,900Active4 beds 5 baths3,566 sq. ft.
115 Alonzo, Boerne, TX 78006
MLS# 1965446Listed by: PERRY HOMES REALTY, LLC $415,000Active3 beds 2 baths1,676 sq. ft.
110 Churchill, Boerne, TX 78006
MLS# 1965359Listed by: NIEMEYER & ASSOCIATES, REALTORS $425,000Active3 beds 3 baths2,052 sq. ft.
232 Winding Riv, Boerne, TX 78006
MLS# 1965289Listed by: CIBOLO CREEK REALTY, LLC $865,000Active4 beds 3 baths3,205 sq. ft.
150 Lake View Dr, Boerne, TX 78006
MLS# 1965278Listed by: WHITE LINE REALTY LLC $295,000Active3 beds 2 baths1,344 sq. ft.
112 N Wagon Wheel Dr, Boerne, TX 78015
MLS# 1965246Listed by: LEGACY PARTNERS $875,000Pending4 beds 3 baths2,730 sq. ft.
104 Spike Rush Ln, Boerne, TX 78006
MLS# 1962334Listed by: JB GOODWIN, REALTORS $849,000Active4 beds 2 baths1,960 sq. ft.
404 Oak Park Dr, Boerne, TX 78006
MLS# 1965089Listed by: REAL BROKER, LLC $1,324,900Active4 beds 5 baths4,068 sq. ft.
140 Western Justice, Boerne, TX 78006
MLS# 1965144Listed by: HOMESUSA.COM $999,999Active3 beds 2 baths1,908 sq. ft.
604 Schweppe St, Boerne, TX 78006
MLS# 1965192Listed by: PHYLLIS BROWNING COMPANY $519,000Active4 beds 3 baths3,059 sq. ft.
128 Talavera, Boerne, TX 78006
MLS# 1965047Listed by: REAL BROKER, LLC $724,900Active4 beds 5 baths3,651 sq. ft.
159 Newcourt, Boerne, TX 78006
MLS# 1964777Listed by: PREMIER REALTY GROUP PLATINUM $699,900Active4 beds 4 baths2,493 sq. ft.
221 Boulder Creek, Boerne, TX 78006
MLS# 1964695Listed by: PERRY HOMES REALTY, LLC $555,000Active3 beds 3 baths2,345 sq. ft.
226 Lone Tree, Boerne, TX 78006
MLS# 1964705Listed by: JB GOODWIN, REALTORS $790,900Active4 beds 4 baths3,445 sq. ft.
117 Rainwater Creek, Boerne, TX 78006
MLS# 1964710Listed by: PERRY HOMES REALTY, LLC $788,900Active5 beds 5 baths3,397 sq. ft.
121 Rainwater Creek, Boerne, TX 78006
MLS# 1964724Listed by: PERRY HOMES REALTY, LLC $436,900Active4 beds 4 baths2,914 sq. ft.
120 Jolie Cir, Boerne, TX 78015
MLS# 1964752Listed by: SAN ANTONIO PORTFOLIO KW RE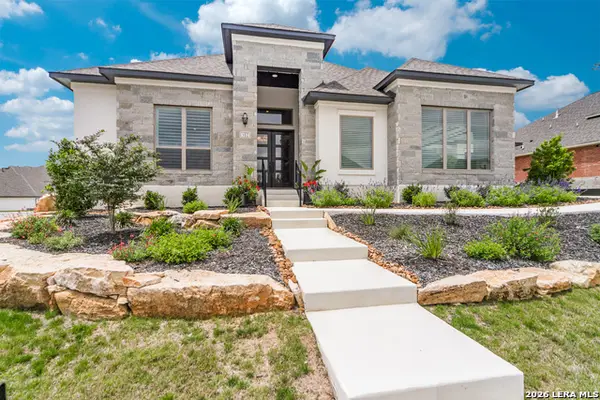 $1,100,000Active4 beds 5 baths3,992 sq. ft.
102 Cascada, Boerne, TX 78006
MLS# 1964755Listed by: SAN ANTONIO PORTFOLIO KW RE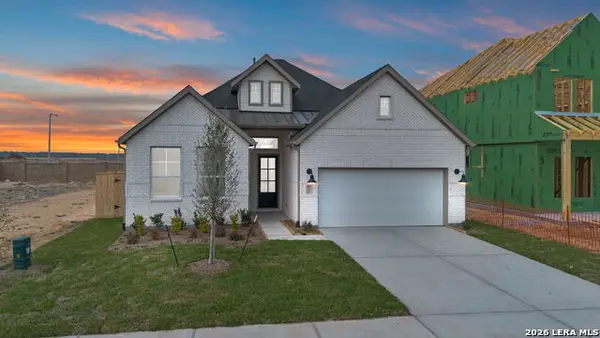 $526,320Active4 beds 7 baths2,052 sq. ft.
218 Sasparilla, Boerne, TX 78006
MLS# 1964549Listed by: CHESMAR HOMES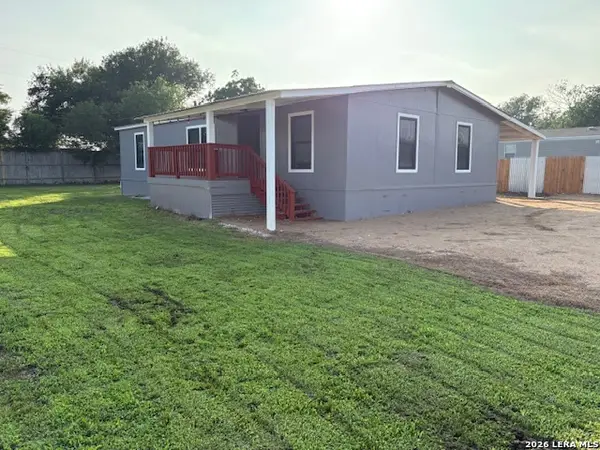 $260,000Active3 beds 2 baths1,344 sq. ft.
104 Bluebonnet Dr, Boerne, TX 78015
MLS# 1964384Listed by: VORTEX REALTY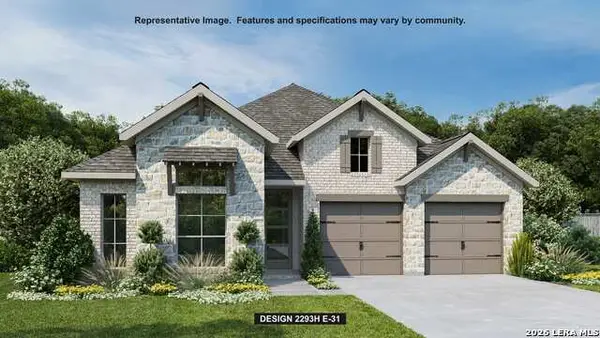 $649,900Active4 beds 4 baths2,293 sq. ft.
217 Sasparilla, Boerne, TX 78006
MLS# 1964287Listed by: PERRY HOMES REALTY, LLC $995,000Active4 beds 4 baths2,678 sq. ft.
120 W Hosack St, Boerne, TX 78006
MLS# 1962394Listed by: EXP REALTY $399,000Active3 beds 2 baths1,576 sq. ft.
118 Richter Ave, Boerne, TX 78006
MLS# 1963855Listed by: EXP REALTY $1,899,000Active5 beds 4 baths3,847 sq. ft.
555 Prado Xing, Boerne, TX 78006
MLS# 1963676Listed by: TEXAS LANDMEN- Open Sat, 2 to 4pm
 $735,000Active4 beds 4 baths2,944 sq. ft.
138 Cimarron Crk, Boerne, TX 78006
MLS# 1963476Listed by: AC REAL ESTATE SERVICES  $899,900Active4 beds 5 baths3,816 sq. ft.
205 Cascada, Boerne, TX 78006
MLS# 1963458Listed by: HOMESUSA.COM $654,620Active3 beds 4 baths2,449 sq. ft.
231 Boulder Creek, Boerne, TX 78006
MLS# 1963443Listed by: DINA VERTERAMO, BROKER $580,000Pending4 beds 4 baths3,185 sq. ft.
71 Mariposa Pkwy W, Boerne, TX 78006
MLS# 1963169Listed by: LONESTAR PROPERTIES $859,990Active4 beds 6 baths3,346 sq. ft.
102 Bandalero, Boerne, TX 78006
MLS# 1963110Listed by: DINA VERTERAMO, BROKER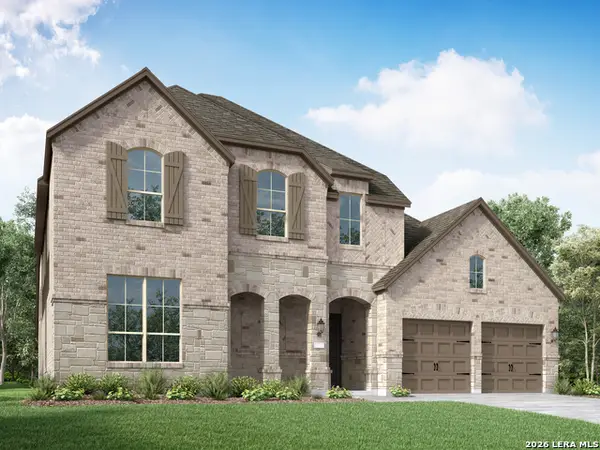 $877,999Active4 beds 4 baths4,044 sq. ft.
317 Dulce Vista, Boerne, TX 78006
MLS# 1963115Listed by: DINA VERTERAMO, BROKER $665,000Active5 beds 4 baths4,168 sq. ft.
107 Destiny, Boerne, TX 78006
MLS# 1962924Listed by: KELLER WILLIAMS HERITAGE $349,000Active3 beds 2 baths1,540 sq. ft.
218 W Flowing River Dr, Boerne, TX 78006
MLS# 1962887Listed by: EPIQUE REALTY LLC $540,000Active4 beds 4 baths3,043 sq. ft.
110 Breamoor, Boerne, TX 78015
MLS# 1962836Listed by: MAGNOLIA REALTY $399,000Active6 Acres
142 Aermotor, Boerne, TX 78006
MLS# 1962802Listed by: KELLER WILLIAMS CITY-VIEW $639,900Active5 beds 3 baths3,435 sq. ft.
228 Leather Leaf, Boerne, TX 78006
MLS# 1962772Listed by: PHYLLIS BROWNING COMPANY $449,150Active4 beds 3 baths2,284 sq. ft.
228 Jersey Lane, Boerne, TX 78006
MLS# 1962657Listed by: MOVE UP AMERICA $611,000Active2 beds 3 baths2,107 sq. ft.
420 Terrazas, Boerne, TX 78006
MLS# 1962683Listed by: HOMESUSA.COM $625,000Active4 beds 3 baths2,710 sq. ft.
107 Valencia, Boerne, TX 78006
MLS# 1962547Listed by: JWR REALTY, LLC $499,000Active2 beds 2 baths1,625 sq. ft.
218 Miraval, Boerne, TX 78006
MLS# 1961985Listed by: HOMESUSA.COM $847,000Active3 beds 4 baths3,058 sq. ft.
226 Miraval, Boerne, TX 78006
MLS# 1961992Listed by: HOMESUSA.COM $702,000Active3 beds 3 baths2,425 sq. ft.
369 Sentido, Boerne, TX 78006
MLS# 1961998Listed by: HOMESUSA.COM $657,990Pending5 beds 5 baths3,403 sq. ft.
100 Rainwater Creek, Boerne, TX 78006
MLS# 1961942Listed by: DINA VERTERAMO, BROKER $489,000Active4 beds 3 baths3,089 sq. ft.
109 Clear Water, Boerne, TX 78006
MLS# 1961933Listed by: HAMMER REAL ESTATE COMPANY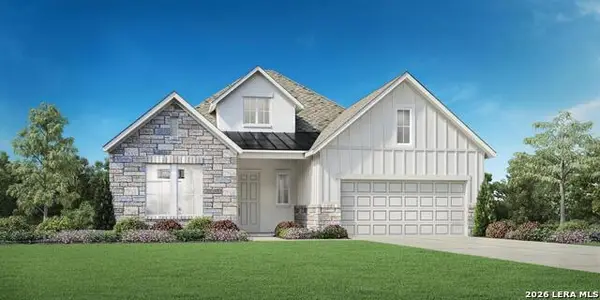 $649,000Active2 beds 3 baths1,954 sq. ft.
340 Sentido, Boerne, TX 78006
MLS# 1961968Listed by: HOMESUSA.COM $749,900Active4 beds 4 baths2,942 sq. ft.
208 Boulder Crk, Boerne, TX 78006
MLS# 1961891Listed by: PERRY HOMES REALTY, LLC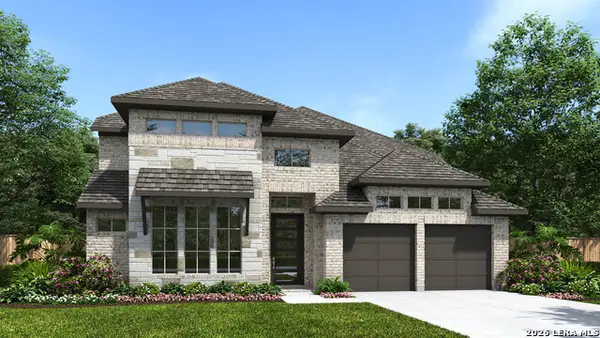 $785,900Active4 beds 4 baths3,346 sq. ft.
325 Sanders Crk, Boerne, TX 78006
MLS# 1961887Listed by: PERRY HOMES REALTY, LLC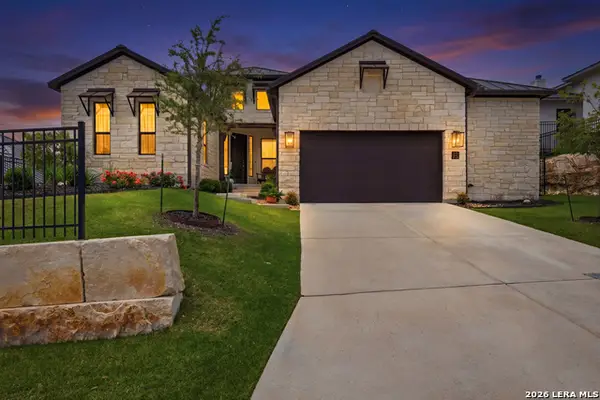 $719,000Active3 beds 4 baths2,483 sq. ft.
74 Monarca Blvd, Boerne, TX 78006
MLS# 1961808Listed by: KELLER WILLIAMS BOERNE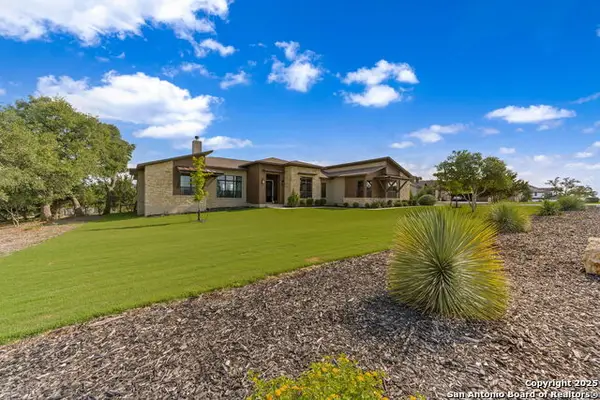 $989,000Active4 beds 4 baths3,611 sq. ft.
150 Madrone Trail, Boerne, TX 78006
MLS# 1961841Listed by: KELLER WILLIAMS BOERNE $671,900Active4 beds 3 baths2,663 sq. ft.
309 Sasparilla, Boerne, TX 78006
MLS# 1961482Listed by: PERRY HOMES REALTY, LLC $550,000Active0.46 Acres
TBD Ogrady, Boerne, TX 78006
MLS# 1961520Listed by: REAL BROKER, LLC $674,900Pending4 beds 4 baths2,942 sq. ft.
202 Sasparilla, Boerne, TX 78006
MLS# 1961342Listed by: PERRY HOMES REALTY, LLC $743,900Pending4 beds 4 baths3,187 sq. ft.
401 Fandango, Boerne, TX 78006
MLS# 1961339Listed by: PERRY HOMES REALTY, LLC $725,000Active-- beds -- baths4,710 sq. ft.
1000 Diamond Dr, Boerne, TX 78006
MLS# 1961310Listed by: REAL BROKER, LLC $679,999Active4 beds 3 baths2,988 sq. ft.
107 Coleto Crk, Boerne, TX 78006
MLS# 1960904Listed by: BOERNE REAL ESTATE $364,000Active2 beds 3 baths1,399 sq. ft.
1143 Paniolo Dr, Boerne, TX 78006
MLS# 1960586Listed by: HILL COUNTRY FLAT FEE REALTY $364,000Active2 beds 3 baths1,399 sq. ft.
1145 Paniolo Dr, Boerne, TX 78006
MLS# 1960607Listed by: HILL COUNTRY FLAT FEE REALTY $823,900Pending4 beds 4 baths3,396 sq. ft.
314 Barton Crk, Boerne, TX 78006
MLS# 1960517Listed by: PERRY HOMES REALTY, LLC $379,000Active2 beds 3 baths
1141 Paniolo, Boerne, TX 78006
MLS# 1960541Listed by: HILL COUNTRY FLAT FEE REALTY $379,000Active2 beds 3 baths1,554 sq. ft.
1147 Paniolo Dr, Boerne, TX 78006
MLS# 1960550Listed by: HILL COUNTRY FLAT FEE REALTY $895,000Active4 beds 3 baths2,526 sq. ft.
212 Kendall Oaks Dr, Boerne, TX 78006
MLS# 1960298Listed by: UNITED REAL ESTATE DFW PROPERTIES $525,000Active4 beds 3 baths2,276 sq. ft.
183 Cimarron Creek, Boerne, TX 78006
MLS# 611531Listed by: WOLTER REAL ESTATE $1,145,000Active4 beds 3 baths2,631 sq. ft.
193 Autumn Rdg, Boerne, TX 78006
MLS# 1960170Listed by: TR REAL CO, LLC $1,173,900Active5 beds 6 baths5,016 sq. ft.
220 Alonzo, Boerne, TX 78006
MLS# 1960111Listed by: PERRY HOMES REALTY, LLC $360,000Active3.8 Acres
0 Rockwall Pt, Boerne, TX 78006
MLS# 1960120Listed by: KELLER WILLIAMS HERITAGE $274,500Active1.12 Acres
4 & 5 Tapatio Dr W, Boerne, TX 78006
MLS# 1960034Listed by: JB GOODWIN, REALTORS $535,000Active5 beds 4 baths2,932 sq. ft.
26067 Scenic Crest Blvd, Boerne, TX 78006
MLS# 1959933Listed by: CENTRAL METRO REALTY $675,000Active3 beds 3 baths2,317 sq. ft.
155 Miraval, Boerne, TX 78006
MLS# 1959826Listed by: LPT REALTY, LLC $520,000Pending4 beds 3 baths2,122 sq. ft.
125 Cimarron Crk, Boerne, TX 78006
MLS# 1959727Listed by: SAN ANTONIO PORTFOLIO KW RE $344,900Pending3 beds 2 baths1,512 sq. ft.
140 Katie Ct, Boerne, TX 78006
MLS# 124191Listed by: EXP REALTY LLC $763,900Active4 beds 4 baths2,995 sq. ft.
430 Fandango, Boerne, TX 78006
MLS# 1959385Listed by: PERRY HOMES REALTY, LLC $1,299,900Pending4 beds 5 baths3,992 sq. ft.
100 Dang Pretty, Boerne, TX 78006
MLS# 1959377Listed by: PERRY HOMES REALTY, LLC $651,090Active4 beds 5 baths2,593 sq. ft.
132 Rainwater Creek, Boerne, TX 78006
MLS# 1959113Listed by: DINA VERTERAMO, BROKER $850,000Active0 Acres
10205 #2 Johns Road, Boerne, TX 78006
MLS# 1958927Listed by: PHYLLIS BROWNING COMPANY $259,000Active2 beds 2 baths960 sq. ft.
121 S Plant #302, Boerne, TX 78006
MLS# 1958760Listed by: REAL BROKER, LLC $467,400Active4 beds 3 baths2,917 sq. ft.
149 Inverness, Boerne, TX 78015
MLS# 1958771Listed by: DALTON WADE, INC $564,900Pending3 beds 3 baths2,457 sq. ft.
429 English Oaks Cir, Boerne, TX 78006
MLS# 1958529Listed by: EXP REALTY $425,000Active4 beds 3 baths1,544 sq. ft.
514 E Bandera Rd, Boerne, TX 78006
MLS# 1958161Listed by: PHYLLIS BROWNING COMPANY $584,900Active3 beds 2 baths2,127 sq. ft.
226 Hidalgo, Boerne, TX 78006
MLS# 1958198Listed by: PERRY HOMES REALTY, LLC $424,310Pending4 beds 2 baths1,951 sq. ft.
308 Jersey Lane, Boerne, TX 78006
MLS# 1958125Listed by: MOVE UP AMERICA $384,270Active3 beds 2 baths1,501 sq. ft.
305 Jersey Lane, Boerne, TX 78006
MLS# 1958127Listed by: MOVE UP AMERICA $409,790Pending4 beds 3 baths2,218 sq. ft.
229 Jersey Lane, Boerne, TX 78006
MLS# 1958128Listed by: MOVE UP AMERICA $399,470Active4 beds 3 baths1,837 sq. ft.
304 Jersey Lane, Boerne, TX 78006
MLS# 1958129Listed by: MOVE UP AMERICA $750,000Pending3 beds 2 baths2,112 sq. ft.
414 Schryver St, Boerne, TX 78006
MLS# 1957866Listed by: PHYLLIS BROWNING COMPANY $949,950Active5 beds 4 baths3,774 sq. ft.
226 Vizcaya, Boerne, TX 78006
MLS# 1957664Listed by: EXP REALTY $859,000Active4 beds 4 baths2,670 sq. ft.
129 Aermotor Ln, Boerne, TX 78006
MLS# 1957375Listed by: JOSEPH WALTER REALTY, LLC $499,900Pending3 beds 3 baths2,588 sq. ft.
116 Stonegate S, Boerne, TX 78006
MLS# 609882Listed by: KELLER WILLIAMS HERITAGE $397,400Pending4 beds 2 baths1,889 sq. ft.
235 W Granite Shores Dr, Boerne, TX 78006
MLS# 1956619Listed by: KELLER WILLIAMS HERITAGE $2,200,000Pending3 beds 4 baths2,988 sq. ft.
830 Camino Cantera, Boerne, TX 78006
MLS# 1956307Listed by: S H BENNETT PROPERTIES LLC $1,297,000Active4 beds 5 baths4,208 sq. ft.
101 Western Justice, Boerne, TX 78006
MLS# 610009Listed by: HOMESUSA.COM $659,000Active4 beds 4 baths2,969 sq. ft.
162 Cimarron Creek, Boerne, TX 78006
MLS# 1955871Listed by: PHYLLIS BROWNING COMPANY $414,600Pending4 beds 3 baths2,079 sq. ft.
309 Jersey Lane, Boerne, TX 78006
MLS# 1955360Listed by: MOVE UP AMERICA $1,539,900Active5 beds 6 baths4,509 sq. ft.
113 Dang Pretty, Boerne, TX 78006
MLS# 1954885Listed by: PERRY HOMES REALTY, LLC $1,099,900Active5 beds 7 baths4,347 sq. ft.
119 Alonzo, Boerne, TX 78006
MLS# 1954754Listed by: PERRY HOMES REALTY, LLC $350,000Pending3 beds 2 baths1,506 sq. ft.
113 E View Point, Boerne, TX 78006
MLS# 1954856Listed by: KUPER SOTHEBY'S INT'L REALTY $1,325,000Pending4 beds 4 baths2,934 sq. ft.
312 Frey St, Boerne, TX 78006
MLS# 1954519Listed by: REAL BROKER, LLC $595,000Active4 beds 3 baths2,927 sq. ft.
120 Escalera Cir, Boerne, TX 78006
MLS# 1949264Listed by: KELLER WILLIAMS HERITAGE $545,000Active3 beds 2 baths1,548 sq. ft.
114 Turner, Boerne, TX 78006
MLS# 1954351Listed by: LEGACY BROKER GROUP $549,000Active10.68 Acres
132 Fm 474, Boerne, TX 78006
MLS# 1954421Listed by: ALL CITY REAL ESTATE $899,000Active5 beds 5 baths4,130 sq. ft.
129 Milagro, Boerne, TX 78006
MLS# 1954188Listed by: CLOVER PROPERTIES, LLC $727,900Pending4 beds 3 baths2,695 sq. ft.
317 Sanders Creek, Boerne, TX 78006
MLS# 1954124Listed by: PERRY HOMES REALTY, LLC $525,000Active4 beds 3 baths2,276 sq. ft.
183 Cimarron Creek, Boerne, TX 78006
MLS# 1954021Listed by: WOLTER REAL ESTATE $900,000Active2 beds 1 baths1,414 sq. ft.
608 River Rd, Boerne, TX 78006
MLS# 1954067Listed by: KELLER WILLIAMS BOERNE $829,000Active3 beds 3 baths2,891 sq. ft.
320 Miraval, Boerne, TX 78006
MLS# 1953371Listed by: HOMESUSA.COM $299,500Active0.33 Acres
222 3rd, Boerne, TX 78006
MLS# 1953052Listed by: MANGUS REALTY GROUP $279,500Active0.33 Acres
314 E Bandera, Boerne, TX 78006
MLS# 1953057Listed by: MANGUS REALTY GROUP $529,000Active3 beds 2 baths1,680 sq. ft.
215 Oak Park, Boerne, TX 78006
MLS# 1953039Listed by: TR REAL CO, LLC $535,000Pending3 beds 3 baths2,552 sq. ft.
118 Escondido, Boerne, TX 78006
MLS# 1952402Listed by: VORTEX REALTY $699,000Pending4 beds 4 baths3,028 sq. ft.
117 Wildrose Hill, Boerne, TX 78006
MLS# 1952029Listed by: COMPASS RE TEXAS, LLC - SA $318,000Active2 beds 3 baths1,400 sq. ft.
1113 Paniolo Dr, Boerne, TX 78006
MLS# 1951868Listed by: TROPHY PROPERTIES, LLC $390,370Pending4 beds 3 baths1,837 sq. ft.
324 Jersey Lane, Boerne, TX 78006
MLS# 1951893Listed by: MOVE UP AMERICA $449,780Pending4 beds 3 baths2,601 sq. ft.
320 Jersey Lane, Boerne, TX 78006
MLS# 1951905Listed by: MOVE UP AMERICA $1,650,000Active4 beds 4 baths3,200 sq. ft.
115 & 113 E Evergreen, Boerne, TX 78006
MLS# 1951737Listed by: REAL BROKER, LLC $424,500Active4 beds 2 baths2,000 sq. ft.
131 Dovetail, Boerne, TX 78006
MLS# 1950847Listed by: EXP REALTY $609,900Active4 beds 3 baths2,663 sq. ft.
113 Sasparilla, Boerne, TX 78006
MLS# 1950675Listed by: PERRY HOMES REALTY, LLC $985,900Active4 beds 4 baths3,300 sq. ft.
106 Cascada, Boerne, TX 78006
MLS# 1950679Listed by: PERRY HOMES REALTY, LLC $360,000Active3 beds 2 baths1,382 sq. ft.
210 Cibolo Branch, Boerne, TX 78006
MLS# 1950508Listed by: RE/MAX PREFERRED, REALTORS $650,000Active3 beds 2 baths1,616 sq. ft.
313 Roosevelt, Boerne, TX 78006
MLS# 1949020Listed by: COLDWELL BANKER D'ANN HARPER $500,000Active2.67 Acres
LOT 12 Hawkeye Ln, Boerne, TX 78006
MLS# 1950479Listed by: TROY REALTORS, INC. $550,000Active0.46 Acres
TBD Ogrady St, Boerne, TX 78006
MLS# 6439117Listed by: REAL BROKER, LLC $1,175,000Active4 beds 4 baths2,300 sq. ft.
109 W Evergreen St, Boerne, TX 78006
MLS# 1949959Listed by: KELLER WILLIAMS LEGACY $749,900Active4 beds 4 baths3,203 sq. ft.
212 Boulder Creek, Boerne, TX 78006
MLS# 1949938Listed by: PERRY HOMES REALTY, LLC $435,000Active4 beds 3 baths2,305 sq. ft.
107 Dovetail, Boerne, TX 78006
MLS# 1949378Listed by: WELCOME HOME REAL ESTATE $619,800Pending4 beds 4 baths2,649 sq. ft.
109 La Jara, Boerne, TX 78006
MLS# 1949322Listed by: CHESMAR HOMES $515,000Active3 beds 2 baths2,371 sq. ft.
167 Hidden Haven Dr, Boerne, TX 78006
MLS# 1949257Listed by: KUPER SOTHEBY'S INT'L REALTY $712,900Pending5 beds 5 baths3,507 sq. ft.
121 Brown Swiss Ridge, Boerne, TX 78006
MLS# 1949127Listed by: PERRY HOMES REALTY, LLC $624,900Active4 beds 3 baths2,608 sq. ft.
112 Brown Swiss Ridge, Boerne, TX 78006
MLS# 1949106Listed by: PERRY HOMES REALTY, LLC $549,900Pending4 beds 4 baths2,668 sq. ft.
108 Brown Swiss Ridge, Boerne, TX 78006
MLS# 1949110Listed by: PERRY HOMES REALTY, LLC $549,900Pending4 beds 3 baths2,358 sq. ft.
105 Brown Swiss Ridge, Boerne, TX 78006
MLS# 1949115Listed by: PERRY HOMES REALTY, LLC $769,000Active4 beds 3 baths2,745 sq. ft.
143 Sonrisa, Boerne, TX 78006
MLS# 1949005Listed by: SAN ANTONIO PORTFOLIO KW RE $899,000Active2 beds 2 baths1,998 sq. ft.
101 Landa, Boerne, TX 78006
MLS# 1949021Listed by: HILL COUNTRY HOME AND LAND LLC $560,000Active4 beds 3 baths2,503 sq. ft.
106 Branson Falls, Boerne, TX 78006
MLS# 1948893Listed by: M. STAGERS REALTY PARTNERS $599,999Active5 beds 3 baths2,755 sq. ft.
133 Cool Rock, Boerne, TX 78006
MLS# 1948905Listed by: EVOKE REALTY $699,900Pending4 beds 3 baths2,493 sq. ft.
321 Sanders Creek, Boerne, TX 78006
MLS# 1948851Listed by: PERRY HOMES REALTY, LLC $380,000Pending4 beds 2 baths2,265 sq. ft.
221 Lone Star, Boerne, TX 78006
MLS# 1948715Listed by: FELLOWSHIP REAL ESTATE, LLC $430,000Active4 beds 3 baths2,736 sq. ft.
26056 Scenic Crest Blvd, Boerne, TX 78006
MLS# 1948733Listed by: BEN GONZALES, BROKER $399,000Pending4 beds 3 baths2,037 sq. ft.
104 Prairie Falcon, Boerne, TX 78006
MLS# 1948543Listed by: AE REALTY $599,231Active3 beds 3 baths2,300 sq. ft.
133 Rainwater Creek, Boerne, TX 78006
MLS# 1948423Listed by: DINA VERTERAMO, BROKER $599,900Pending4 beds 3 baths2,458 sq. ft.
214 Hidalgo, Boerne, TX 78006
MLS# 1948470Listed by: PERRY HOMES REALTY, LLC $525,000Active3 beds 2 baths1,564 sq. ft.
325 Hickman, Boerne, TX 78006
MLS# 1948254Listed by: TR REAL CO, LLC $124,900Active0.22 Acres
120R Hannah Ln, Boerne, TX 78006
MLS# 1947796Listed by: FIVE STAR LOCATING, LLC $124,900Active0.22 Acres
121R Hannah Ln, Boerne, TX 78006
MLS# 1947800Listed by: FIVE STAR LOCATING, LLC $395,000Active4 beds 3 baths2,920 sq. ft.
208 Cold River, Boerne, TX 78006
MLS# 1945851Listed by: PHYLLIS BROWNING COMPANY $598,990Pending4 beds 3 baths3,134 sq. ft.
10027 Grandview Rd, Boerne, TX 78006
MLS# 1947555Listed by: DAVID WEEKLEY HOMES, INC. $574,900Active4 beds 3 baths2,647 sq. ft.
105 Vallejo, Boerne, TX 78006
MLS# 1947386Listed by: HIRP ENTERPRISES LLC $575,000Active4 beds 3 baths3,994 sq. ft.
105 Clear Water, Boerne, TX 78006
MLS# 1947336Listed by: REAL BROKER, LLC $524,900Active4 beds 3 baths2,383 sq. ft.
116 Ocotillo, Boerne, TX 78006
MLS# 1947253Listed by: JB GOODWIN, REALTORS $659,000Active4 beds 3 baths2,645 sq. ft.
110 Sonrisa, Boerne, TX 78006
MLS# 1946930Listed by: KELLER WILLIAMS BOERNE $349,000Active3.95 Acres
LOT 28 Rio Cordillera, Boerne, TX 78006
MLS# 1946986Listed by: EXP REALTY $875,000Active3 beds 3 baths2,459 sq. ft.
119 B Mountain Top Trl, Boerne, TX 78006
MLS# 1944936Listed by: PHYLLIS BROWNING COMPANY $599,000Pending4 beds 4 baths3,094 sq. ft.
178 Cimarron Creek, Boerne, TX 78006
MLS# 1946745Listed by: KELLER WILLIAMS BOERNE $795,000Active-- beds -- baths4,710 sq. ft.
1000 Diamond Dr (unit 3201-3204), Boerne, TX 78006
MLS# 1946111Listed by: ALL CITY REAL ESTATE LTD. CO $1,295,000Active2.99 Acres
1025 Blanco, Boerne, TX 78006
MLS# 1945941Listed by: TR REAL CO, LLC $716,800Pending5 beds 6 baths3,468 sq. ft.
120 Oso Creek, Boerne, TX 78006
MLS# 1945811Listed by: DINA VERTERAMO, BROKER $94,950Active0.06 Acres
314 S Plant Ave, Boerne, TX 78006
MLS# 1945667Listed by: KELLER WILLIAMS HERITAGE $825,000Active4 beds 4 baths3,170 sq. ft.
101 El Cielo, Boerne, TX 78006
MLS# 1945619Listed by: KUPER SOTHEBY'S INT'L REALTY $832,124Active4 beds 5 baths3,050 sq. ft.
325 Dulce Vista, Boerne, TX 78006
MLS# 1945326Listed by: DINA VERTERAMO, BROKER $374,149Active4 beds 2 baths1,675 sq. ft.
142 Crow Cove, Boerne, TX 78006
MLS# 1944725Listed by: SATEX PROPERTIES, INC.- Open Sat, 10am to 7pm
 $529,900Active3 beds 2 baths2,127 sq. ft.
218 Hidalgo, Boerne, TX 78006
MLS# 1944690Listed by: PERRY HOMES REALTY, LLC  $724,900Active4 beds 4 baths3,445 sq. ft.
232 Boulder Creek, Boerne, TX 78006
MLS# 1944702Listed by: PERRY HOMES REALTY, LLC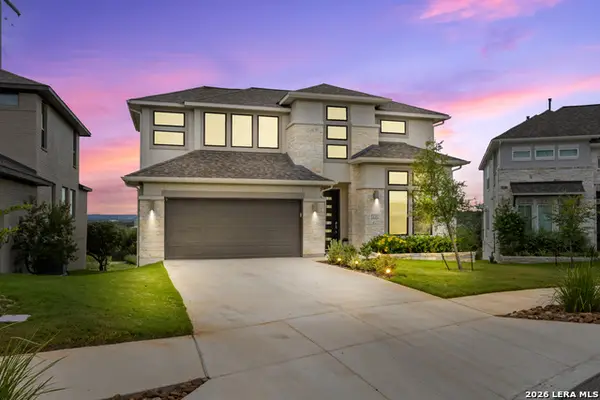 $535,000Active4 beds 3 baths2,498 sq. ft.
250 Navarro, Boerne, TX 78006
MLS# 1944451Listed by: KELLER WILLIAMS CITY-VIEW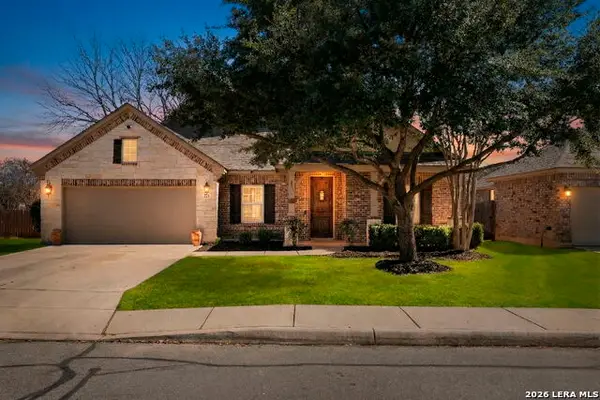 $587,000Active4 beds 3 baths3,395 sq. ft.
221 Ludwig Dr, Boerne, TX 78006
MLS# 1944241Listed by: COLDWELL BANKER D'ANN HARPER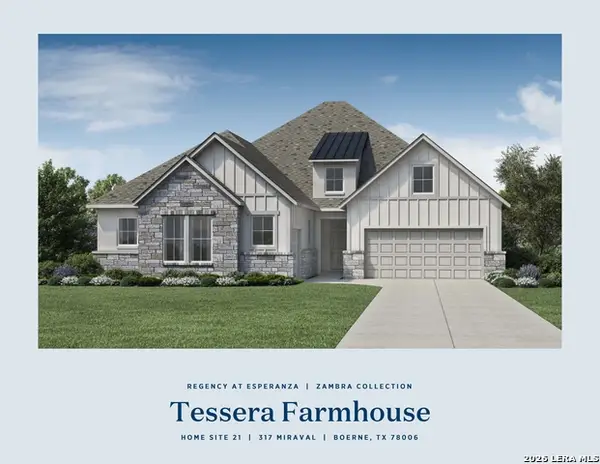 $887,000Active3 beds 4 baths3,068 sq. ft.
317 Miraval, Boerne, TX 78006
MLS# 1944017Listed by: HOMESUSA.COM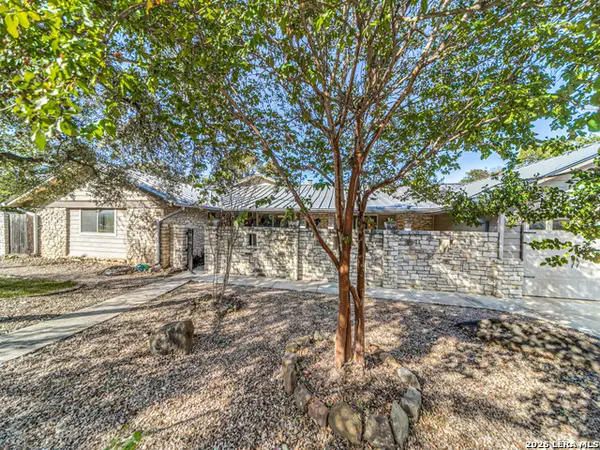 $989,500Active4 beds 4 baths3,082 sq. ft.
310 Oak Park, Boerne, TX 78006
MLS# 1943673Listed by: KELLER WILLIAMS BOERNE $793,900Pending4 beds 5 baths3,413 sq. ft.
309 Fandango, Boerne, TX 78006
MLS# 1943058Listed by: PERRY HOMES REALTY, LLC $724,900Pending4 beds 4 baths2,995 sq. ft.
121 La Jara, Boerne, TX 78006
MLS# 1943084Listed by: PERRY HOMES REALTY, LLC $750,000Active4 beds 4 baths2,926 sq. ft.
313 James St, Boerne, TX 78006
MLS# 1937727Listed by: KELLER WILLIAMS BOERNE $537,000Active3 beds 3 baths2,486 sq. ft.
250 English Oaks Circle, Boerne, TX 78006
MLS# 1942569Listed by: PHYLLIS BROWNING COMPANY $699,990Pending5 beds 5 baths3,244 sq. ft.
305 Sanders Creek, Boerne, TX 78006
MLS# 1942555Listed by: DINA VERTERAMO, BROKER $615,000Active5 beds 4 baths3,398 sq. ft.
112 Hagen Dr, Boerne, TX 78006
MLS# 1938039Listed by: EXP REALTY $535,000Active4 beds 3 baths2,732 sq. ft.
209 Ludwig, Boerne, TX 78006
MLS# 1942324Listed by: RE/MAX PREFERRED, REALTORS $459,000Active3 beds 3 baths2,383 sq. ft.
216 Aspen, Boerne, TX 78006
MLS# 1941212Listed by: KELLER WILLIAMS HERITAGE $599,990Active4 beds 3 baths2,282 sq. ft.
305 Fandango, Boerne, TX 78006
MLS# 1941064Listed by: DETAILS COMMUNITIES, LTD. $199,975Active3 beds 2 baths1,225 sq. ft.
605 Oak Park #605, Boerne, TX 78006
MLS# 1940935Listed by: KUPER SOTHEBY'S INT'L REALTY $399,900Active2.22 Acres
140 Hawkeye Lane, Boerne, TX 78006
MLS# 1940425Listed by: CR REALTY, LLC $1,476,900Pending5 beds 7 baths4,536 sq. ft.
109 Dang Pretty, Boerne, TX 78006
MLS# 1939731Listed by: PERRY HOMES REALTY, LLC $699,000Active3 beds 4 baths2,507 sq. ft.
106 Cinnamon Creek, Boerne, TX 78006
MLS# 1939342Listed by: LONESTAR PROPERTIES $597,803Active4 beds 3 baths2,677 sq. ft.
237 Boulder Creek, Boerne, TX 78006
MLS# 1939037Listed by: DINA VERTERAMO, BROKER $579,800Pending3 beds 3 baths2,526 sq. ft.
417 Fandango, Boerne, TX 78006
MLS# 1939051Listed by: CHESMAR HOMES $529,999Active3 beds 3 baths2,294 sq. ft.
109 Valencia, Boerne, TX 78006
MLS# 1938775Listed by: KELLER WILLIAMS BOERNE $425,000Active3 beds 3 baths2,508 sq. ft.
408 Sambar Bay Drive, Boerne, TX 78006
MLS# 1938670Listed by: KERRVILLE REAL ESTATE COMPANY $198,500Active0.29 Acres
LOT 20 Paradise Point, Boerne, TX 78006
MLS# 1938464Listed by: TROPHY PROPERTIES, LLC $485,000Active3 beds 2 baths1,818 sq. ft.
329 E Bandera, Boerne, TX 78006
MLS# 1938209Listed by: WELCOME HOME REAL ESTATE $878,000Active3 beds 3 baths2,365 sq. ft.
222 3rd St, Boerne, TX 78006
MLS# 1938350Listed by: MANGUS REALTY GROUP $599,990Pending3 beds 4 baths2,449 sq. ft.
309 Sanders Creek, Boerne, TX 78006
MLS# 1937826Listed by: DINA VERTERAMO, BROKER $235,000Active0.32 Acres
Lot 3 Chaparral Creek Dr, Boerne, TX 78006
MLS# 121361Listed by: LEGACY PARTNERS $460,000Active4 beds 3 baths2,099 sq. ft.
10726 Yellowtail, Boerne, TX 78006
MLS# 1937098Listed by: ZION REALTY TEAM, LLC $853,120Pending4 beds 6 baths3,346 sq. ft.
306 Dulce Vista, Boerne, TX 78006
MLS# 602892Listed by: HIGHLAND HOMES REALTY $579,900Active2 beds 3 baths2,465 sq. ft.
150 Cinnamon Creek, Boerne, TX 78006
MLS# 1935368Listed by: PHYLLIS BROWNING COMPANY $714,900Pending4 beds 4 baths3,095 sq. ft.
113 Rainwater Creek, Boerne, TX 78006
MLS# 1936459Listed by: PERRY HOMES REALTY, LLC $774,900Pending4 beds 4 baths3,187 sq. ft.
125 La Jara, Boerne, TX 78006
MLS# 1936464Listed by: PERRY HOMES REALTY, LLC $309,500Pending3 beds 1 baths1,043 sq. ft.
401 Deer Creek, Boerne, TX 78006
MLS# 1936413Listed by: REAL PROPERTY MANAGEMENT HILL COUNTRY $749,900Pending4 beds 3 baths2,647 sq. ft.
217 Dulce Vista, Boerne, TX 78006
MLS# 1936363Listed by: HOMESUSA.COM $975,000Active3 beds 3 baths2,891 sq. ft.
333 Miraval, Boerne, TX 78006
MLS# 1936364Listed by: HOMESUSA.COM $813,000Active3 beds 3 baths2,496 sq. ft.
313 Miraval, Boerne, TX 78006
MLS# 1936368Listed by: HOMESUSA.COM
Local realty services provided by:CENTURY 21 North East, CENTURY 21 Lucky Money Real Estate, CENTURY 21 Scott Myers Realtors, CENTURY 21 Premier Realtors
Copyright 2026, Houston Realtors Information Service, Inc. All information provided is deemed reliable but is not guaranteed and should be independently verified. IDX information is provided exclusively for consumers' personal, non-commercial use, it may not be used for any purpose other than to identify prospective properties consumers may be interested in purchasing, and the data is deemed reliable but is not guaranteed accurate by the MLS.
Some properties that appear for sale on this web site may subsequently have been sold and may no longer be available. The data relating to real estate for sale on this web site comes in part from the FHAAR IDX INFO SHARE PROGRAM. Real estate listings held by brokerage firms other than CENTURY 21 Premier Realtors include the name of the listing agent. Copyright 2026 FHAAR IDX INFO SHARE PROGRAM. Last Updated June 18, 2026 TX_FRAR Member Broker: Robert Herrings
Neighborhoods near Boerne, TX
Zip codes near Boerne, TX
- 78004 homes for sale
- 78006 homes for sale
- 78010 homes for sale
- 78013 homes for sale
- 78015 homes for sale
- 78023 homes for sale
- 78027 homes for sale
- 78063 homes for sale
- 78163 homes for sale
- 78231 homes for sale
- 78240 homes for sale
- 78248 homes for sale
- 78249 homes for sale
- 78250 homes for sale
- 78254 homes for sale
- 78255 homes for sale
- 78256 homes for sale
- 78257 homes for sale
- 78258 homes for sale
- 78260 homes for sale
Popular searches near Boerne, TX
- Bergheim homes for sale
- Bulverde homes for sale
- Center Point homes for sale
- Comfort homes for sale
- Cross Mountain homes for sale
- Fair Oaks Ranch homes for sale
- Grey Forest homes for sale
- Helotes homes for sale
- Hill Country Village homes for sale
- Hollywood Park homes for sale
- Kendalia homes for sale
- Lake Medina Shores homes for sale
- Lakehills homes for sale
- Pipe Creek homes for sale
- San Antonio North homes for sale
- San Antonio Northwest homes for sale
- Scenic Oaks homes for sale
- Shavano Park homes for sale
- Spring Branch homes for sale
- Timberwood Park homes for sale
Protect your home and budget from life's surprises with an Assurant Home Warranty, backed by a partner that supports you through every step of homeownership. Explore Plans.
©2026 Century 21 Real Estate LLC. All rights reserved. CENTURY 21®, the CENTURY 21 Logo and C21® are service marks owned by Century 21 Real Estate LLC. Century 21 Real Estate LLC fully supports the principles of the Fair Housing Act and the Equal Opportunity Act. Each office is independently owned and operated. Listing information is deemed reliable but not guaranteed accurate.