- Amerige Heights, Fullerton homes for sale
- Anaheim Colony, Anaheim homes for sale
- Anaheim Hills, Anaheim homes for sale
- Atwood, Placentia homes for sale
- Coyote Hills Estates, Fullerton homes for sale
- East Lake Village, Yorba Linda homes for sale
- Hidden Hills, Yorba Linda homes for sale
- Kerrigan Ranch, Yorba Linda homes for sale
- North Anaheim, Anaheim homes for sale
- North Central Industrial Area, Anaheim homes for sale
- Olinda Ranch, Brea homes for sale
- Orange Foothills, Orange homes for sale
- Riverbend, Orange homes for sale
- The Platinum Triangle, Anaheim homes for sale
- Villa Park, Villa Park homes for sale
- Village Oaks, Chino Hills homes for sale
- Vista del Verde, Yorba Linda homes for sale
- West Coyote Hills, Fullerton homes for sale
- Westridge, La Habra homes for sale
- Windmill Creek, Chino Hills homes for sale
Brea, CA - homes for sale
110 of 110 results displayed
- New
 $474,000Active1 beds 1 baths604 sq. ft.
145 S Poplar #20, Brea, CA 92821
MLS# DW26122693Listed by: CENTERPOINTE REAL ESTATE - New
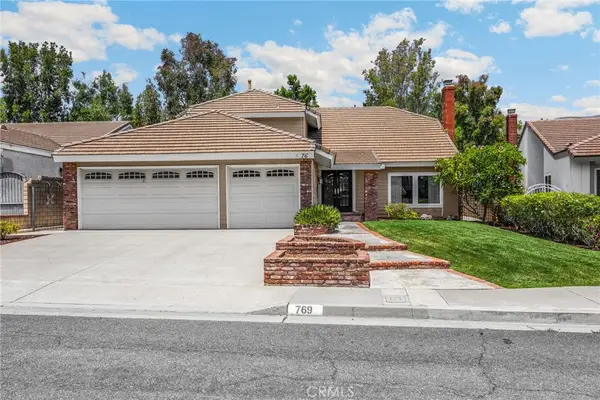 $1,250,000Active3 beds 3 baths2,211 sq. ft.
769 Oak Knoll Street, Brea, CA 92821
MLS# PW26121940Listed by: T.N.G. REAL ESTATE CONSULTANTS - New
 $799,000Active3 beds 3 baths1,287 sq. ft.
503 S Brea Boulevard #18, Brea, CA 92821
MLS# TR26122597Listed by: ELEVATE REAL ESTATE AGENCY - New
 $1,299,000Active4 beds 3 baths3,100 sq. ft.
1029 Wardman Drive, Brea, CA 92821
MLS# PW26120651Listed by: ERA NORTH ORANGE COUNTY - Coming Soon
 $389,000Coming Soon3 beds 2 baths
1051 Site #283, Brea, CA 92821
MLS# OC26122516Listed by: REAL BROKER - New
 $245,000Active3 beds 2 baths
1051 Site #209, Brea, CA 92821
MLS# SW26122561Listed by: DRIVE REAL ESTATE, INC. - New
 $170,000Active2 beds 2 baths1,344 sq. ft.
1051 Site Dr #61, Brea, CA 92821
MLS# DW26122102Listed by: MISSION GROUP - Coming Soon
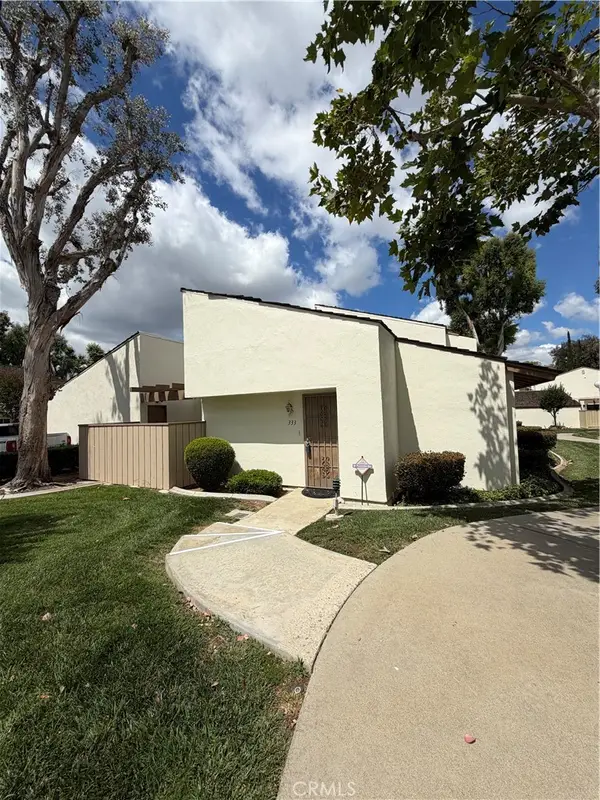 $559,900Coming Soon2 beds 1 baths
333 Surry Court, Brea, CA 92821
MLS# PW26119829Listed by: EXP REALTY OF SOUTHERN CA, INC - Coming SoonOpen Sat, 1 to 3pm
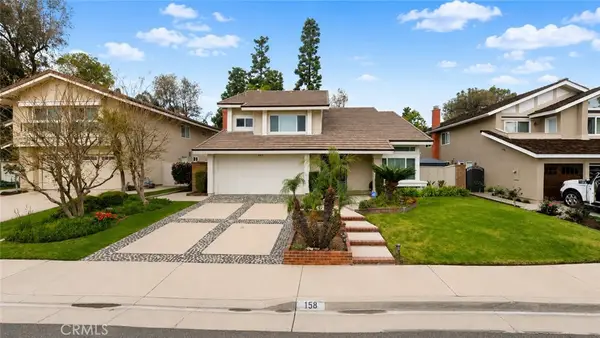 $1,628,000Coming Soon4 beds 3 baths
158 N Thistle, Brea, CA 92821
MLS# TR26119754Listed by: RE/MAX GALAXY - New
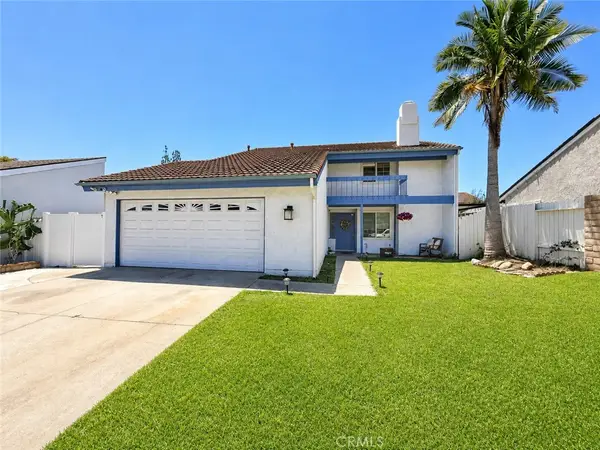
 $940,000Active3 beds 2 baths1,578 sq. ft.
2377 Sommerset Dr, Brea, CA 92821
MLS# AR26117841Listed by: THE REAL ESTATE COMPANY JGK INC. - Coming Soon
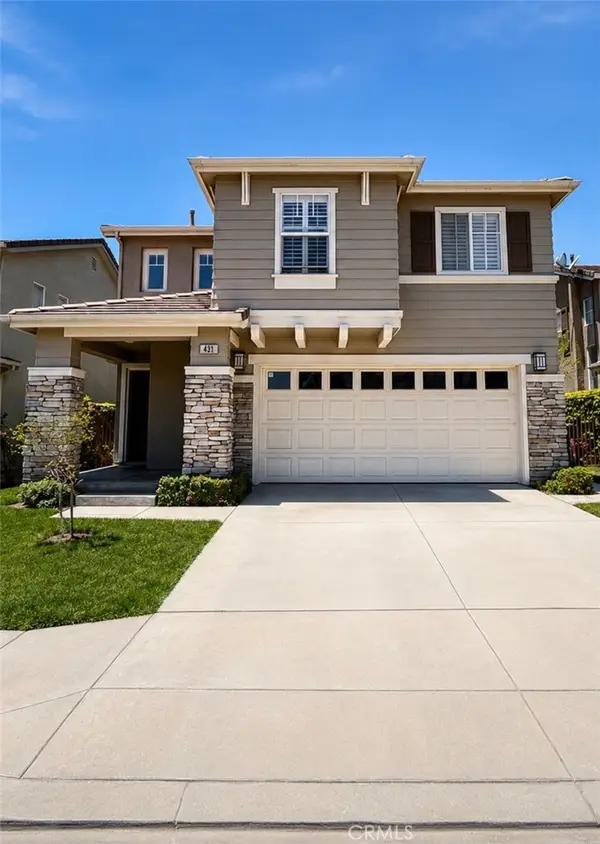 $998,800Coming Soon3 beds 3 baths
431 Blue Jay Drive, Brea, CA 92823
MLS# PW26119383Listed by: CIRCA PROPERTIES, INC. - Coming Soon
 $1,099,000Coming Soon4 beds 3 baths
640 W Imperial, Brea, CA 92821
MLS# PW26118760Listed by: CIRCA PROPERTIES, INC. - New
 $1,599,000Active5 beds 4 baths2,748 sq. ft.
137 S Thistle, Brea, CA 92821
MLS# OC26118511Listed by: COPLEY REALTY - New
 $940,000Active3 beds 2 baths1,578 sq. ft.
2377 Sommerset Dr, Brea, CA 92821
MLS# AR26117841Listed by: THE REAL ESTATE COMPANY JGK INC. - New
 $1,455,000Active4 beds 3 baths2,251 sq. ft.
198 Sunflower Street, Brea, CA 92821
MLS# PW26118187Listed by: WHITE HOUSE INVESTMENT, INC - New
 $1,480,000Active4 beds 4 baths2,272 sq. ft.
562 Condor Avenue, Brea, CA 92823
MLS# PW26116152Listed by: SUPERIOR REAL ESTATE GROUP - New
 $199,900Active3 beds 2 baths1,300 sq. ft.
1051 Site #251, Brea, CA 92821
MLS# DW26115827Listed by: REALTY ONE GROUP UNITED - New
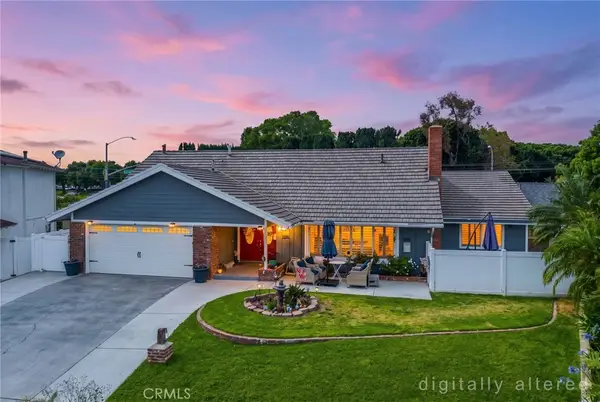 $1,400,000Active5 beds 4 baths2,854 sq. ft.
325 Delphia Avenue, Brea, CA 92821
MLS# PW26114681Listed by: ERA NORTH ORANGE COUNTY - Open Sat, 12 to 3pmNew
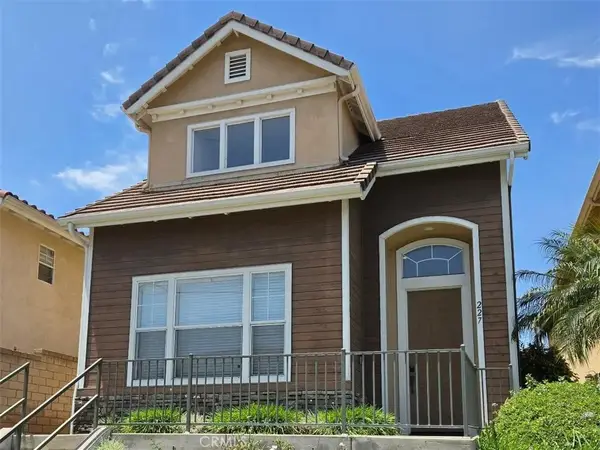 $999,888Active5 beds 4 baths2,532 sq. ft.
227 S Poplar, Brea, CA 92821
MLS# OC26115341Listed by: REALTY OC INC 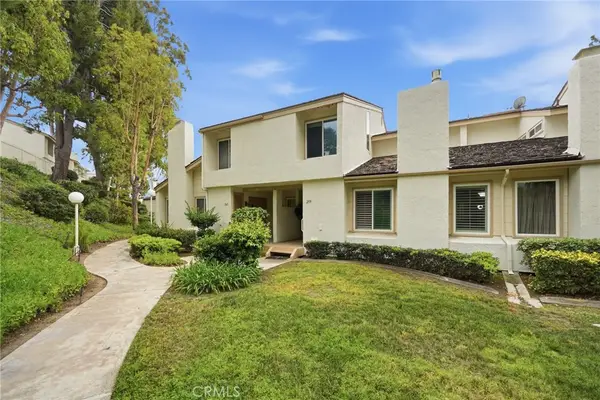 $850,000Active3 beds 3 baths1,780 sq. ft.
259 Scenic, Brea, CA 92821
MLS# PW26113032Listed by: BD INVESTMENT COMPANY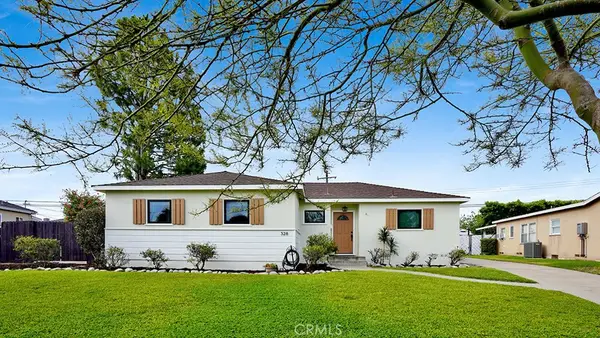 $1,128,000Active4 beds 2 baths1,785 sq. ft.
328 Cherry Street, Brea, CA 92821
MLS# PW26112483Listed by: ETHOS REAL ESTATE GROUP $995,000Pending3 beds 2 baths1,673 sq. ft.
125 Clove, Brea, CA 92821
MLS# NP26112353Listed by: WEST COAST REALTY SERVICES INC $1,350,000Active4 beds 3 baths2,327 sq. ft.
109 Cinnamon Ridge, Brea, CA 92821
MLS# OC26097442Listed by: PK REAL ESTATE & INVESTMENTS $1,349,990Active3 beds 3 baths1,978 sq. ft.
3336 Adelante, Brea, CA 92823
MLS# TR26110213Listed by: REAL BROKER $1,139,999Pending4 beds 3 baths1,692 sq. ft.
335 Nutwood Street, Brea, CA 92821
MLS# PW26109125Listed by: EXP REALTY OF SOUTHERN CA, INC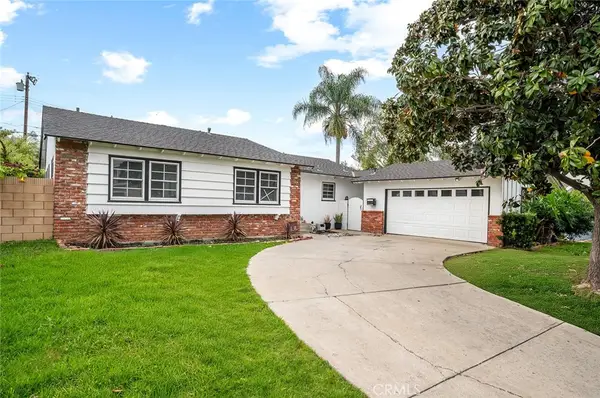 $1,050,000Pending4 beds 2 baths1,480 sq. ft.
375 Cedar, Brea, CA 92821
MLS# CV26109803Listed by: REAL ESTATE HOUND $749,900Active3 beds 3 baths1,407 sq. ft.
735 Leafwood Court, Brea, CA 92821
MLS# OC26106926Listed by: COLDWELL BANKER REALTY $1,050,000Active4 beds 3 baths1,563 sq. ft.
339 E Alder Street, Brea, CA 92821
MLS# IV26107300Listed by: BE REAL ESTATE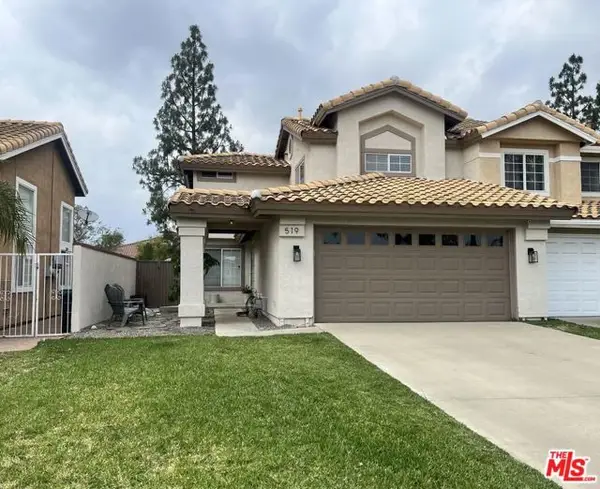 $989,000Active2 beds 3 baths1,547 sq. ft.
519 E Ash Street, Brea, CA 92821
MLS# CL26836155Listed by: BEYCOME BROKERAGE REALTY INC.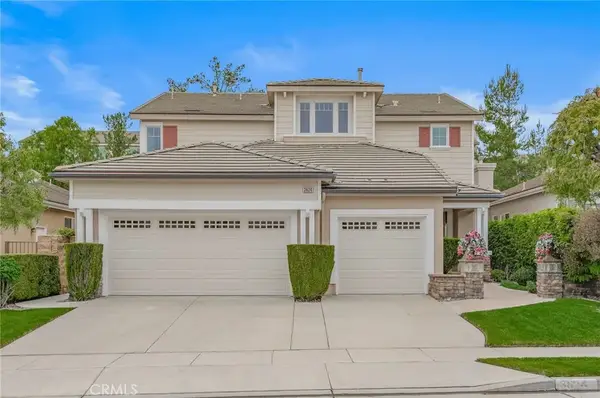 $1,450,000Active5 beds 3 baths2,830 sq. ft.
3624 Skylark, Brea, CA 92823
MLS# TR26096286Listed by: ENCORE REALTY & FINANCIAL $1,198,000Active3 beds 3 baths2,130 sq. ft.
2282 Shadetree, Brea, CA 92821
MLS# GD26106794Listed by: RE/MAX TRI-CITY REALTY $215,000Active3 beds 2 baths1,120 sq. ft.
1051 Site Drive #78, Brea, CA 92821
MLS# SW26106701Listed by: DRIVE REAL ESTATE, INC. $1,390,000Active4 beds 3 baths2,257 sq. ft.
2998 Primrose Avenue, Brea, CA 92821
MLS# PW26105768Listed by: CIRCA PROPERTIES, INC. $610,000Active2 beds 2 baths1,090 sq. ft.
620 N Brea Boulevard #56, Brea, CA 92821
MLS# OC26102642Listed by: COMPASS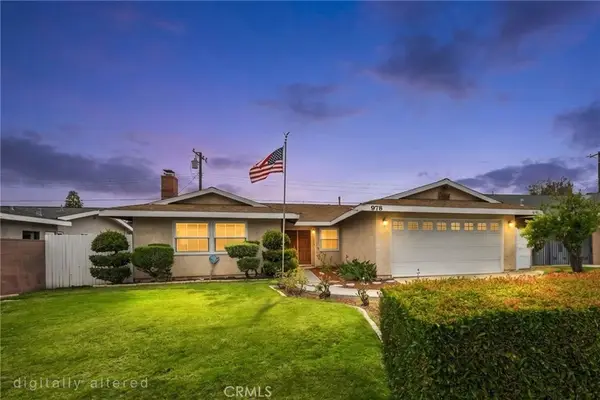 $875,000Pending4 beds 2 baths1,434 sq. ft.
978 Orangewood Drive, Brea, CA 92821
MLS# PW26104633Listed by: ERA NORTH ORANGE COUNTY $599,900Active2 beds 2 baths1,104 sq. ft.
636 East Birch Street #D, Brea, CA 92821
MLS# PW26103507Listed by: EXP REALTY OF CALIFORNIA INC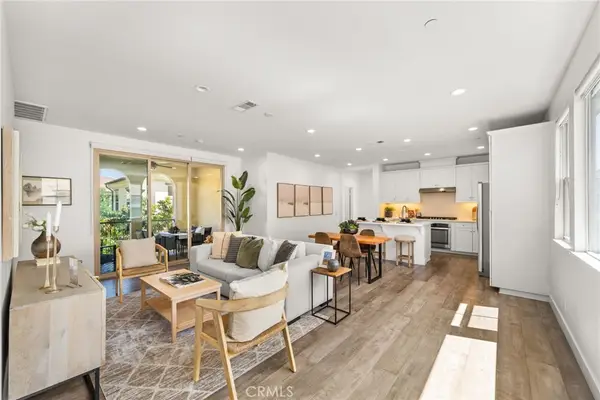 $978,888Active3 beds 3 baths1,534 sq. ft.
421 Maravilla, Brea, CA 92823
MLS# OC26104265Listed by: COLDWELL BANKER REALTY $1,325,000Active4 beds 3 baths2,230 sq. ft.
534 Aria, Brea, CA 92821
MLS# IV26103968Listed by: INNOVATE REALTY, INC. $1,419,000Active4 beds 3 baths2,262 sq. ft.
2976 E Coalinga Dr., Brea, CA 92821
MLS# RS26103055Listed by: PARADISE REALTY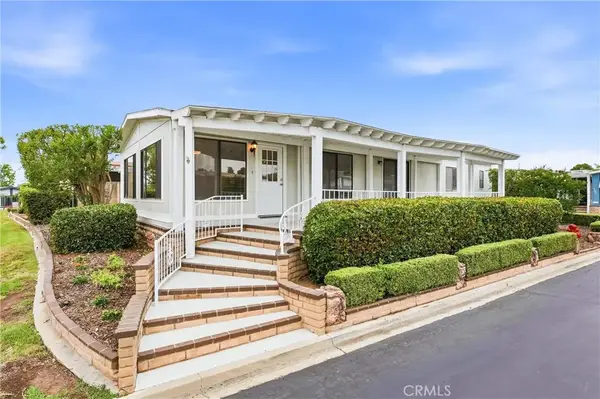 $335,000Active2 beds 2 baths1,440 sq. ft.
1266 Harbor Lake #160, Brea, CA 92821
MLS# PW26062853Listed by: KELLER WILLIAMS REALTY $1,150,000Pending3 beds 2 baths2,203 sq. ft.
1705 Shelly Court, Brea, CA 92821
MLS# PW26101976Listed by: ERA NORTH ORANGE COUNTY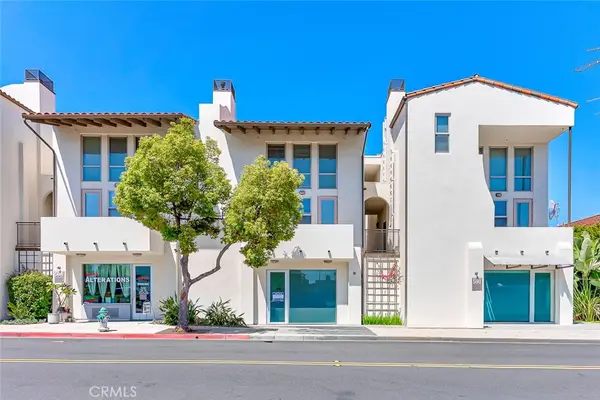 $979,000Active2 beds 2 baths2,064 sq. ft.
596 S Brea Boulevard, Brea, CA 92821
MLS# PW26101894Listed by: TERRA YANG, BROKER $700,000Pending3 beds 3 baths1,780 sq. ft.
249 Mountain Court, Brea, CA 92821
MLS# PW26097357Listed by: COLDWELL BANKER DIAMOND $135,000Pending2 beds 2 baths1,080 sq. ft.
5700 Carbon Canyon #46, Brea, CA 92823
MLS# OC26101201Listed by: REALTY EXECUTIVES ALL CITIES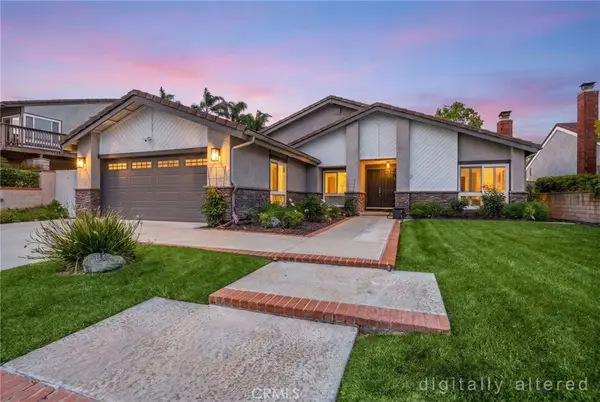 $1,100,000Active4 beds 2 baths2,000 sq. ft.
1224 Fawnridge Drive, Brea, CA 92821
MLS# PW26100103Listed by: ERA NORTH ORANGE COUNTY $799,000Active3 beds 2 baths1,395 sq. ft.
506 S Brea, Brea, CA 92821
MLS# PW26100441Listed by: COLDWELL BANKER REALTY $1,348,000Active4 beds 3 baths2,020 sq. ft.
2407 Branch, Brea, CA 92821
MLS# OC26100156Listed by: ALTA REALTY GROUP CA, INC $2,380,000Pending4 beds 5 baths3,990 sq. ft.
2425 E Kern River, Brea, CA 92821
MLS# WS26098288Listed by: WETRUST REALTY $1,300,000Active4 beds 3 baths2,155 sq. ft.
1414 Las Lomas, Brea, CA 92821
MLS# OC26098159Listed by: ASPERO REALTY, INC $1,500,000Active4 beds 3 baths2,414 sq. ft.
659 Brookwood Street, Brea, CA 92821
MLS# PW26090547Listed by: COLDWELL BANKER DIAMOND $1,150,000Pending4 beds 3 baths1,893 sq. ft.
1902 Arts Avenue, Brea, CA 92821
MLS# IG26091762Listed by: SELL MY HOME REAL ESTATE $1,700,000Active5 beds 2 baths2,784 sq. ft.
1146 N Puente, Brea, CA 92821
MLS# PW26083368Listed by: KELLER WILLIAMS REALTY $1,348,000Active5 beds 3 baths2,302 sq. ft.
184 Eastwood, Brea, CA 92821
MLS# CV26091546Listed by: K.W. EXECUTIVE $1,375,000Active4 beds 3 baths2,507 sq. ft.
1081 Oak Canyon Way, Brea, CA 92821
MLS# PW26089707Listed by: REAL ESTATE PROF'S ALLSTATE $780,000Active2 beds 3 baths1,173 sq. ft.
156 N Orange, Brea, CA 92821
MLS# PW26088665Listed by: COLDWELL BANKER BEST REALTY $1,098,000Pending3 beds 2 baths1,662 sq. ft.
415 W Acacia, Brea, CA 92821
MLS# PW26089268Listed by: T.N.G. REAL ESTATE CONSULTANTS $1,098,000Pending3 beds 2 baths1,662 sq. ft.
415 W Acacia, Brea, CA 92821
MLS# PW26089268Listed by: T.N.G. REAL ESTATE CONSULTANTS $1,489,000Pending5 beds 3 baths2,517 sq. ft.
938 Oakcrest, Brea, CA 92821
MLS# RS26088826Listed by: ELEVATE REAL ESTATE AGENCY $1,399,000Active4 beds 3 baths2,752 sq. ft.
1204 Birchcrest Avenue, Brea, CA 92821
MLS# WS26060627Listed by: RE/MAX 2000 REALTY $270,000Pending3 beds 2 baths1,140 sq. ft.
1414 W Central Avenue #98, Brea, CA 92821
MLS# DW26083640Listed by: KELLER WILLIAMS PREMIER PROPERTIES $115,000Active3 beds 2 baths1,140 sq. ft.
5700 Carbon Canyon Road #62, Brea, CA 92823
MLS# PW26081358Listed by: ANGELA BLACK, BROKER $1,350,000Pending5 beds 3 baths3,025 sq. ft.
536 Silver Canyon Way, Brea, CA 92821
MLS# PW26082124Listed by: T.N.G. REAL ESTATE CONSULTANTS $1,699,000Pending4 beds 3 baths2,800 sq. ft.
320 La Floresta Drive, Brea, CA 92823
MLS# CRPW26076307Listed by: CIRCA PROPERTIES, INC. $275,000Active2 beds 2 baths1,956 sq. ft.
1351 Silver Lake #92, Brea, CA 92821
MLS# OC26080657Listed by: EVA RALEIGH, BROKER $359,000Active2 beds 2 baths1,816 sq. ft.
581 Forest Lake #098, Brea, CA 92821
MLS# PW26080104Listed by: T.N.G. REAL ESTATE CONSULTANTS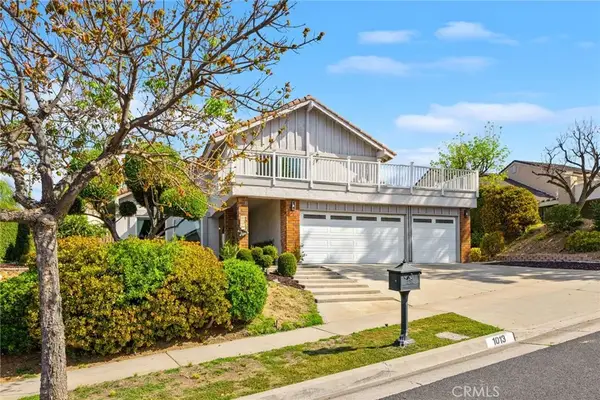 $1,395,000Active4 beds 3 baths2,529 sq. ft.
1013 Woodcrest, Brea, CA 92821
MLS# PW26076165Listed by: SONIA SHAH, BROKER $268,000Active4 beds 2 baths1,296 sq. ft.
1051 Site #38, Brea, CA 92821
MLS# PW26073685Listed by: T.N.G. REAL ESTATE CONSULTANTS $1,700,000Pending5 beds 4 baths3,274 sq. ft.
1001 W Dorothy Drive, Brea, CA 92821
MLS# PW26074653Listed by: T.N.G. REAL ESTATE CONSULTANTS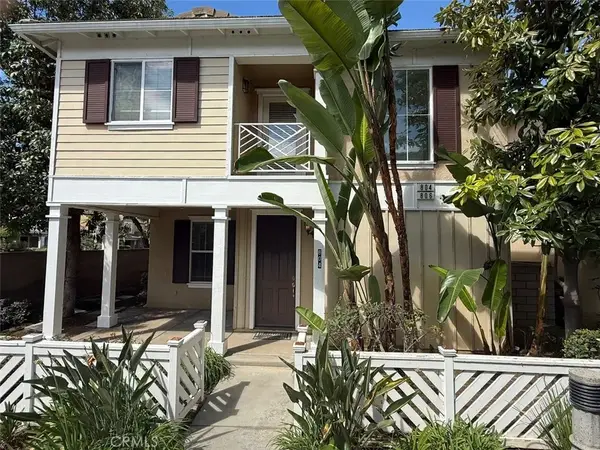 $1,295,000Active4 beds 4 baths2,288 sq. ft.
804 Atkins Lane, Brea, CA 92821
MLS# PW26075783Listed by: PELLEGO, INC $2,300,000Active5 beds 5 baths3,775 sq. ft.
436 Tangerine Place, Brea, CA 92823
MLS# PW26068272Listed by: CIRCA PROPERTIES, INC. $2,300,000Active5 beds 5 baths3,775 sq. ft.
436 Tangerine Place, Brea, CA 92823
MLS# PW26068272Listed by: CIRCA PROPERTIES, INC. $2,080,000Active4 beds 4 baths3,048 sq. ft.
1400 N Puente, Brea, CA 92821
MLS# PW26070874Listed by: MAJOR LEAGUE PROPERTIES $439,000Active3 beds 2 baths2,480 sq. ft.
1051 Site #281, Brea, CA 92821
MLS# PW26070975Listed by: NEXTMOVE REAL ESTATE $239,000Active3 beds 2 baths1,560 sq. ft.
1051 Site Drive #26, Brea, CA 92821
MLS# PW26071479Listed by: COMPASS $239,900Active2 beds 1 baths1,155 sq. ft.
736 Terrace Lake Drive #324, Brea, CA 92821
MLS# OC26071320Listed by: EVA RALEIGH, BROKER $899,000Pending2 beds 2 baths1,304 sq. ft.
421 Sycamore Avenue, Brea, CA 92821
MLS# PW26070560Listed by: ADVANCED REALTY $1,385,000Pending4 beds 3 baths2,466 sq. ft.
2257 Shadetree, Brea, CA 92821
MLS# OC26067368Listed by: RADIUS AGENT REALTY $1,300,000Pending5 beds 3 baths2,538 sq. ft.
321 Blossom, Brea, CA 92821
MLS# PW26069696Listed by: COMPASS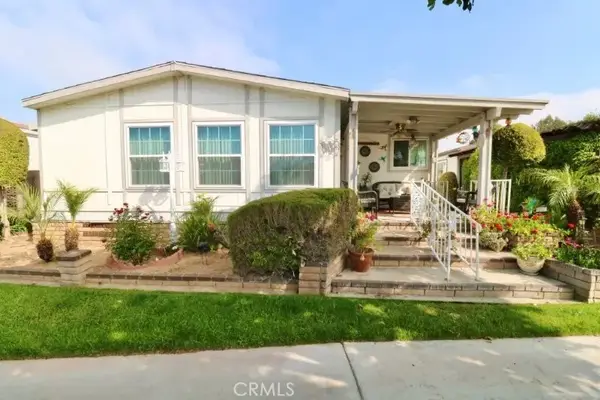 $305,000Active2 beds 2 baths1,856 sq. ft.
1346 Clear Lake #70, Brea, CA 92821
MLS# OC26069491Listed by: EVA RALEIGH, BROKER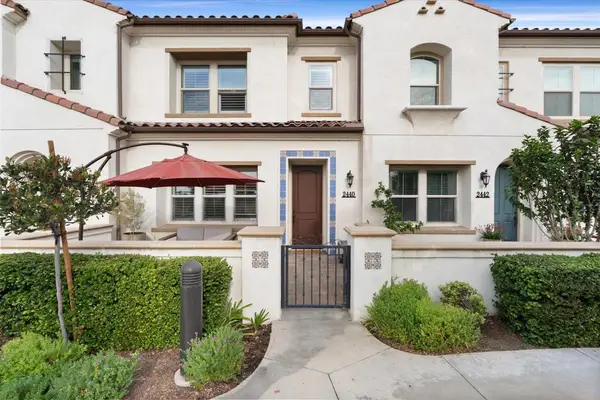 $999,000Pending3 beds 3 baths1,561 sq. ft.
2440 Sanabria Lane, Brea, CA 92821
MLS# 219145518DAListed by: EQUITY UNION $2,748,880Pending5 beds 6 baths4,258 sq. ft.
520 N Bardsdale Place, Brea, CA 92821
MLS# CRPW26055944Listed by: CIRCA PROPERTIES, INC.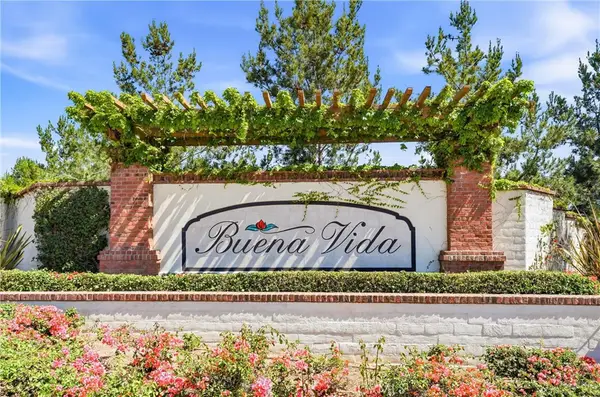 $929,000Active2 beds 2 baths1,553 sq. ft.
220 Buena Vida Drive #308, Brea, CA 92823
MLS# PW26060317Listed by: SEVEN GABLES REAL ESTATE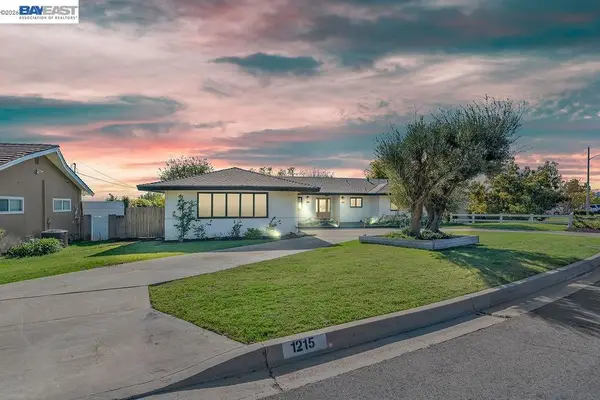 $1,449,000Pending4 beds 2 baths2,019 sq. ft.
1215 Wardman Dr, Brea, CA 92821
MLS# 41126333Listed by: KELLER WILLIAMS TRI-VALLEY $245,000Active4 beds 2 baths1,440 sq. ft.
1414 W Central #19, Brea, CA 92821
MLS# PW26057076Listed by: REALTY ONE GROUP UNITED $1,385,000Active4 beds 3 baths2,252 sq. ft.
3292 Greenleaf Drive, Brea, CA 92823
MLS# 219144684DAListed by: HOMESMART $1,380,000Active3 beds 3 baths2,059 sq. ft.
3174 E Piru, Brea, CA 92821
MLS# TR26051030Listed by: SHARON S. BUTLER $1,877,000Active3 beds 4 baths3,166 sq. ft.
3702 Mercado Drive, Brea, CA 92823
MLS# CV26043458Listed by: UNIVERSAL ELITE REALTY $1,260,000Active3 beds 3 baths2,101 sq. ft.
500 Silver Canyon, Brea, CA 92821
MLS# OC26041513Listed by: CALIFORNIA REALTY PROPERTY $789,000Active3 beds 2 baths1,580 sq. ft.
522 S Brea, Brea, CA 92821
MLS# TR26042589Listed by: GRAND LUX REALTY & FINANCIAL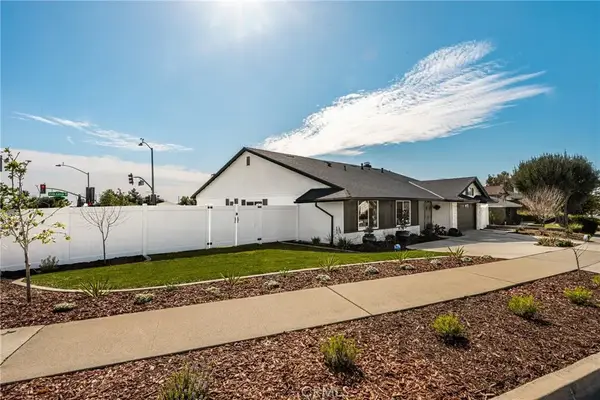 $1,250,000Pending4 beds 2 baths2,175 sq. ft.
688 Buttonwood, Brea, CA 92821
MLS# PW26041465Listed by: SEVEN GABLES REAL ESTATE $289,000Active3 beds 2 baths1,248 sq. ft.
1414 W Central # 81, Brea, CA 92821
MLS# PW26036700Listed by: REALTY ONE GROUP UNITED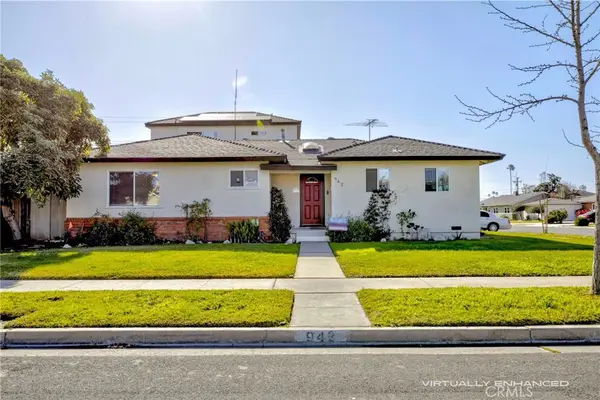 $1,150,000Active5 beds 4 baths2,527 sq. ft.
942 Oleander Street, Brea, CA 92821
MLS# GD26026795Listed by: COLDWELL BANKER HALLMARK $195,000Active3 beds 2 baths1,344 sq. ft.
1051 Site #25, Brea, CA 92821
MLS# PW26020520Listed by: T.N.G. REAL ESTATE CONSULTANTS $239,000Active3 beds 2 baths1,440 sq. ft.
1051 Site #236, Brea, CA 92821
MLS# SW26015590Listed by: DRIVE REAL ESTATE, INC.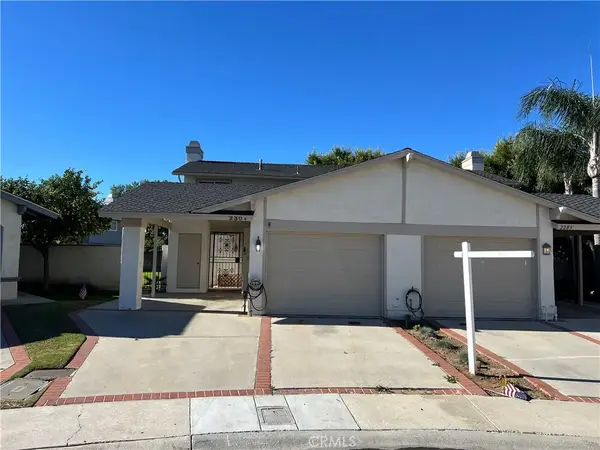 $805,000Active2 beds 2 baths1,168 sq. ft.
2304 Carrotwood, Brea, CA 92821
MLS# PW26007199Listed by: LINDA ETHIER, BROKER $619,000Active2 beds 2 baths1,162 sq. ft.
360 Meadow Court, Brea, CA 92821
MLS# CV26002587Listed by: THE R.R. NETWORK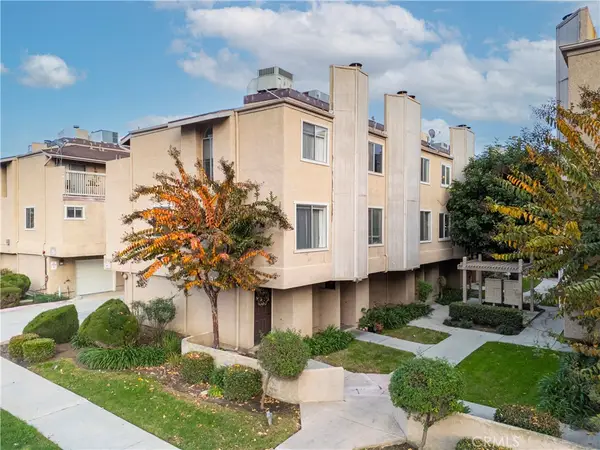 $625,000Active2 beds 2 baths904 sq. ft.
334 S Walnut Avenue, Brea, CA 92821
MLS# DW25279079Listed by: SYNERGY REAL ESTATE $195,000Active2 beds 2 baths800 sq. ft.
1414 W Central #34, Brea, CA 92821
MLS# HD25278050Listed by: EXP REALTY OF SOUTHERN CA INC. $225,000Active3 beds 2 baths1,280 sq. ft.
1051 Site #255, Brea, CA 92821
MLS# WS25270457Listed by: KARBURY'S, INC.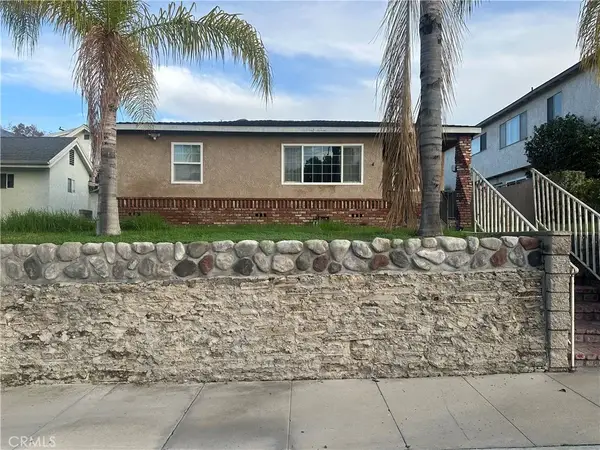 $849,000Pending2 beds 1 baths904 sq. ft.
404 S Sievers, Brea, CA 92821
MLS# CV26047992Listed by: COLDWELL BANKER LEADERS $359,900Active2 beds 2 baths1,911 sq. ft.
655 Wood Lake Drive #190, Brea, CA 92821
MLS# PW25261416Listed by: NEXTMOVE REAL ESTATE $224,888Active2 beds 2 baths1,220 sq. ft.
736 Knoll Lake #266, Brea, CA 92821
MLS# PW25255726Listed by: NEXTMOVE REAL ESTATE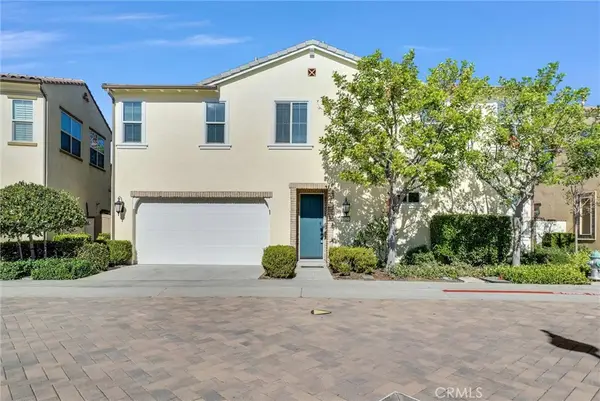 $1,680,000Pending4 beds 4 baths2,678 sq. ft.
3515 Gardenia, Brea, CA 92823
MLS# TR25255057Listed by: PINNACLE REAL ESTATE GROUP $980,000Pending3 beds 4 baths2,247 sq. ft.
448 W Central Ave, Brea, CA 92821
MLS# CROC26048252Listed by: PACIFIC STERLING REALTY $690,000Pending4 beds 2 baths1,158 sq. ft.
648 Pepperwood Drive, Brea, CA 92821
MLS# PW20016946Listed by: THE BOUTIQUE REAL ESTATE GROUP $840,000Active3 beds 2 baths1,578 sq. ft.
2583 Sandpebble Lane, Brea, CA 92821
MLS# PW25196573Listed by: KELLER WILLIAMS PACIFIC ESTATE $26,000Active0 Acres
0 Holly St #4, Phelan, CA 92371
MLS# HD25035589Listed by: KELLER WILLIAMS VICTOR VALLEY $2,150,000Active5 beds 3 baths3,495 sq. ft.
235 Verbena Lane, Brea, CA 92823
MLS# TR26001468Listed by: UNIVERSAL ELITE INC. $344,900Pending3 beds 2 baths2,040 sq. ft.
1051 Site Drive #289, Brea, CA 92821
MLS# CRPW24017149Listed by: ALBAYATI REALTY & MORTGAGE GROUP $875,000Pending3 beds 1 baths1,112 sq. ft.
517 Laurel Avenue, Brea, CA 92821
MLS# CRPW23220819Listed by: CALIBER REAL ESTATE GROUP
Local realty services provided by:CENTURY 21 Valley Properties, CENTURY 21 Affiliated, CENTURY 21 Sierra Properties
The information being provided by California Regional MLS (Southern California) is for the consumer's personal, non-commercial use and may not be used for any purpose other than to identify prospective properties consumer may be interested in purchasing. Any information relating to real estate for sale referenced on this web site comes from the Internet Data Exchange (IDX) program of the California Regional MLS (Southern California). CENTURY 21 Valley Properties is not a Multiple Listing Service (MLS), nor does it offer MLS access. This website is a service of CENTURY 21 Valley Properties, a broker participant of California Regional MLS (Southern California). This web site may reference real estate listing(s) held by a brokerage firm other than the broker and/or agent who owns this web site.
The accuracy of all information, regardless of source, including but not limited to open house information, square footages and lot sizes, is deemed reliable but not guaranteed and should be personally verified through personal inspection by and/or with the appropriate professionals. The data contained herein is copyrighted by California Regional MLS (Southern California) and is protected by all applicable copyright laws. Any unauthorized dissemination of this information is in violation of copyright laws and is strictly prohibited.
Copyright 2021 California Regional MLS (Southern California). All rights reserved. CRMLS Member Broker: Anthony Guetzoian
This information is deemed reliable but not guaranteed. You should rely on this information only to decide whether or not to further investigate a particular property. BEFORE MAKING ANY OTHER DECISION, YOU SHOULD PERSONALLY INVESTIGATE THE FACTS (e.g. square footage and lot size) with the assistance of an appropriate professional. You may use this information only to identify properties you may be interested in investigating further. All uses except for personal, non-commercial use in accordance with the foregoing purpose are prohibited. Redistribution or copying of this information, any photographs or video tours is strictly prohibited. This information is derived from the Internet Data Exchange (IDX) service provided by San Diego MLS®. Displayed property listings may be held by a brokerage firm other than the broker and/or agent responsible for this display. The information and any photographs and video tours and the compilation from which they are derived is protected by copyright. Compilation © 2020 San Diego MLS®, Inc. SANDICOR Member Broker: Nikki Coppa
Neighborhoods near Brea, CA
Zip codes near Brea, CA
- 90603 homes for sale
- 90631 homes for sale
- 91745 homes for sale
- 91748 homes for sale
- 91765 homes for sale
- 91789 homes for sale
- 91792 homes for sale
- 92801 homes for sale
- 92805 homes for sale
- 92806 homes for sale
- 92807 homes for sale
- 92821 homes for sale
- 92823 homes for sale
- 92831 homes for sale
- 92832 homes for sale
- 92833 homes for sale
- 92835 homes for sale
- 92865 homes for sale
- 92870 homes for sale
- 92886 homes for sale
Popular searches near Brea, CA
- Anaheim homes for sale
- Anaheim-Santa Ana-Garden Grove homes for sale
- Chino Hills homes for sale
- Diamond Bar homes for sale
- East Whittier homes for sale
- Fullerton homes for sale
- Hacienda Heights homes for sale
- La Habra homes for sale
- La Habra Heights homes for sale
- La Mirada homes for sale
- Orange homes for sale
- Placentia homes for sale
- Rowland Heights homes for sale
- South San Jose Hills homes for sale
- Valinda homes for sale
- Villa Park homes for sale
- Walnut homes for sale
- West Covina homes for sale
- Whittier homes for sale
- Yorba Linda homes for sale
Protect your home and budget from life's surprises with an Assurant Home Warranty, backed by a partner that supports you through every step of homeownership. Explore Plans.
©2026 Century 21 Real Estate LLC. All rights reserved. CENTURY 21®, the CENTURY 21 Logo and C21® are service marks owned by Century 21 Real Estate LLC. Century 21 Real Estate LLC fully supports the principles of the Fair Housing Act and the Equal Opportunity Act. Each office is independently owned and operated. Listing information is deemed reliable but not guaranteed accurate.