- Boston Avenue, Bridgeport homes for sale
- Boston Avenue, Bridgeport homes for sale
- Brooklawn/St. Vincent, Bridgeport homes for sale
- Brooklawn/St. Vincent, Bridgeport homes for sale
- Central Bridgeport, Bridgeport homes for sale
- Central Bridgeport, Bridgeport homes for sale
- Central Business District, Bridgeport homes for sale
- Central Business District, Bridgeport homes for sale
- East Bridgeport, Bridgeport homes for sale
- East Bridgeport, Bridgeport homes for sale
- East End, Bridgeport homes for sale
- East End, Bridgeport homes for sale
- East Side, Bridgeport homes for sale
- East Side, Bridgeport homes for sale
- The Hollow, Bridgeport homes for sale
- The Hollow, Bridgeport homes for sale
- West Bridgeport, Bridgeport homes for sale
- West Bridgeport, Bridgeport homes for sale
- West End/West Side, Bridgeport homes for sale
- West End/West Side, Bridgeport homes for sale
Bridgeport, CT - homes for sale
300 of 378 results displayed
- New
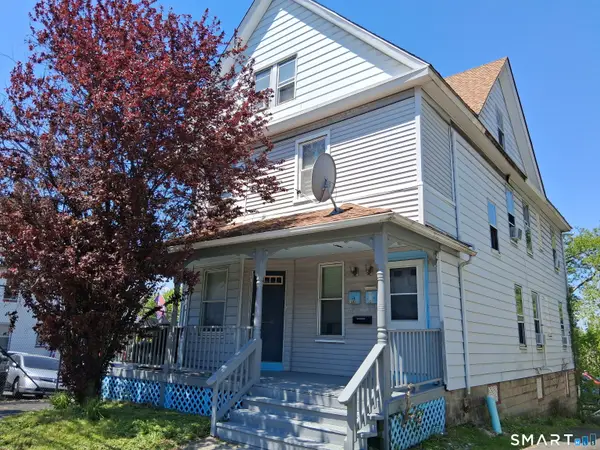
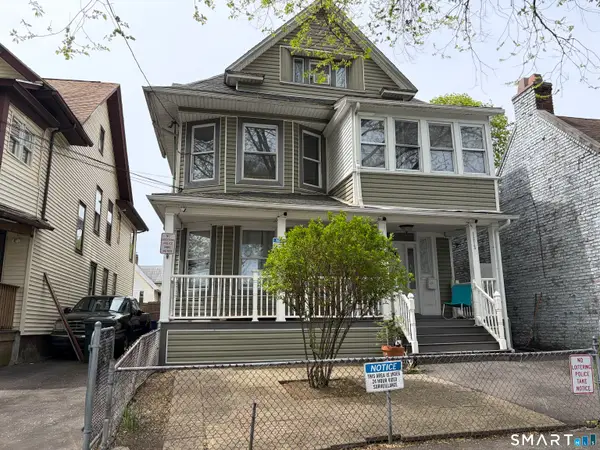
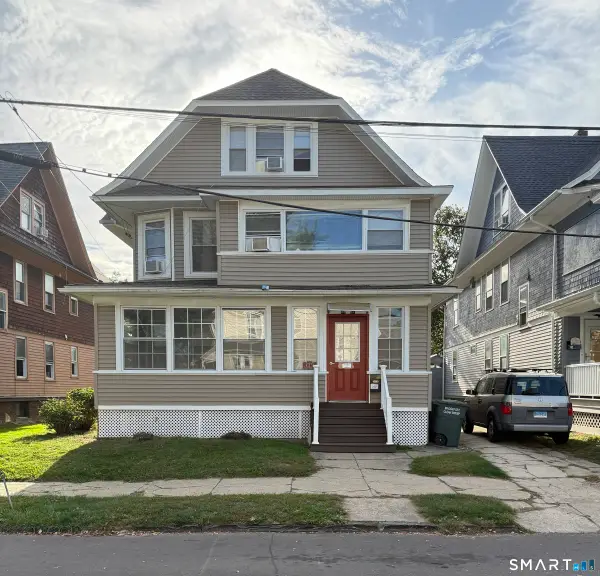
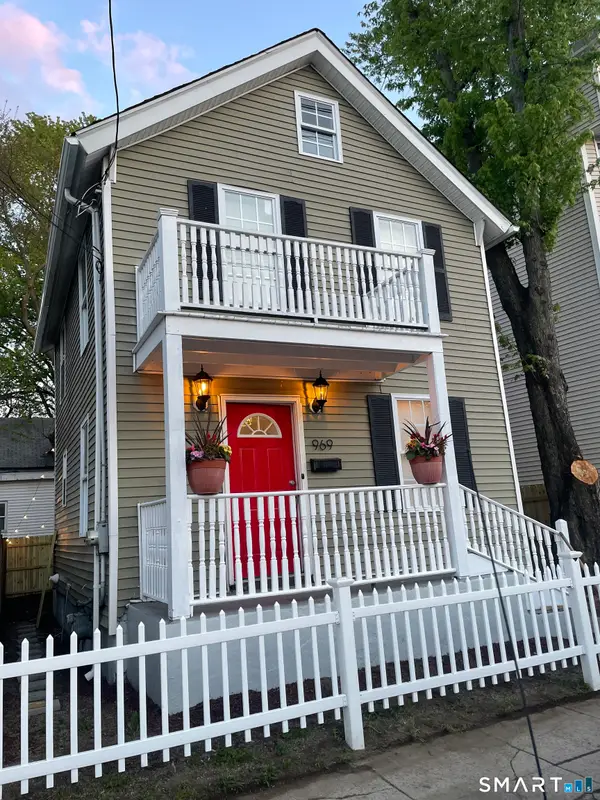 $329,000Active3 beds 1 baths864 sq. ft.
969 Maplewood Avenue, Bridgeport, CT 06605
MLS# 24170214Listed by: Carrena Property Mgmt & Realty - Open Sat, 12 to 2pmNew
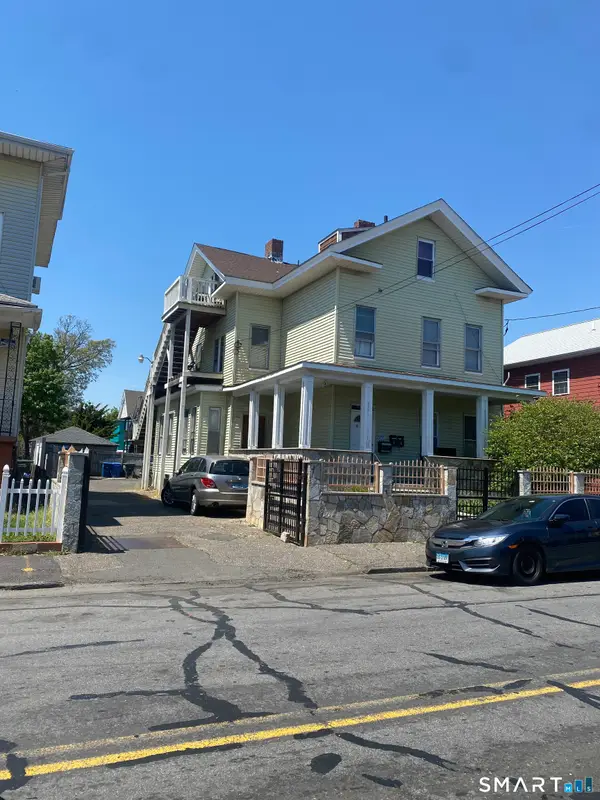
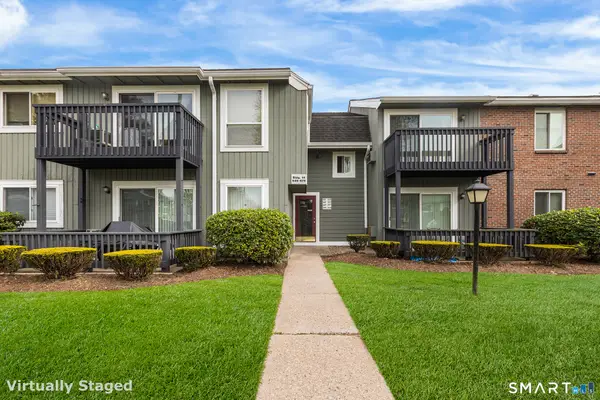
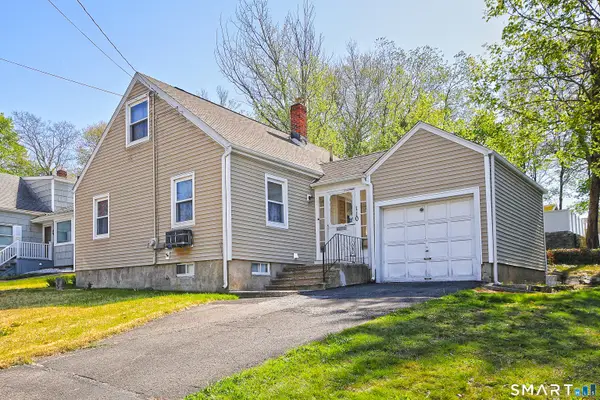
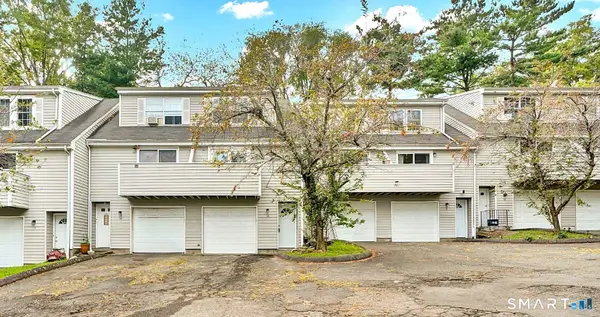
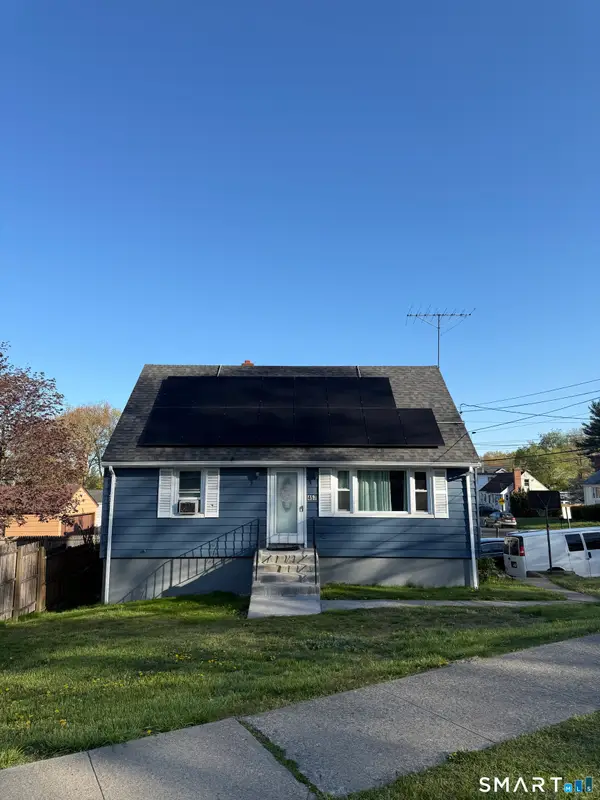 $479,900Active4 beds 3 baths1,188 sq. ft.
457 Vincellette Street, Bridgeport, CT 06606
MLS# 24171463Listed by: eRealty Advisors, Inc. - Open Sat, 12 to 3pmNew
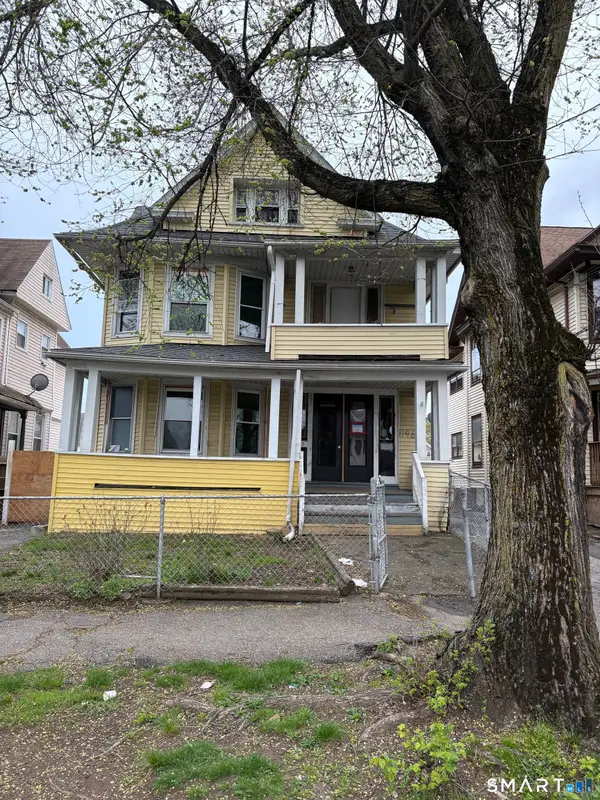
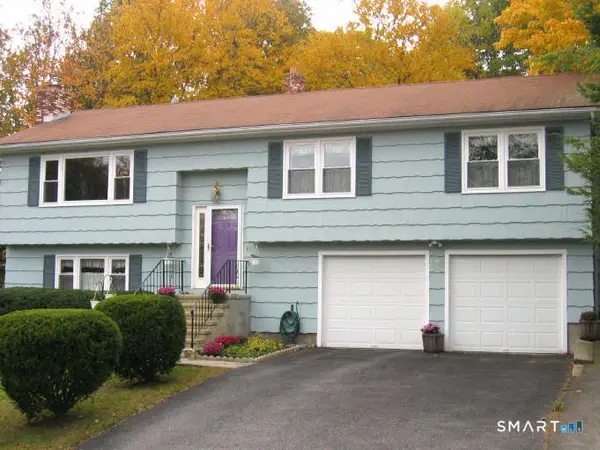
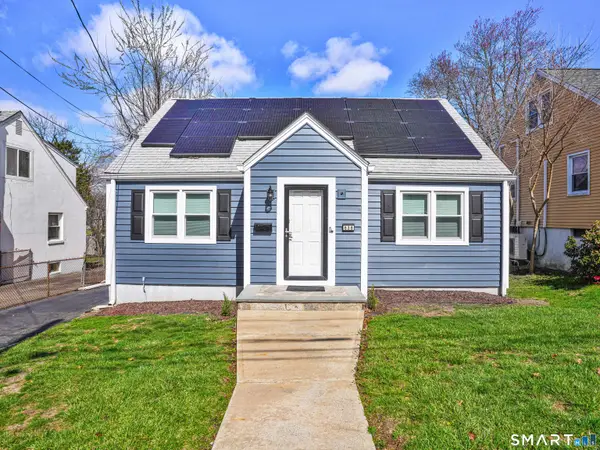 $399,000Active4 beds 1 baths1,326 sq. ft.
838 Ruth Street, Bridgeport, CT 06606
MLS# 24173823Listed by: William Raveis Real Estate - New
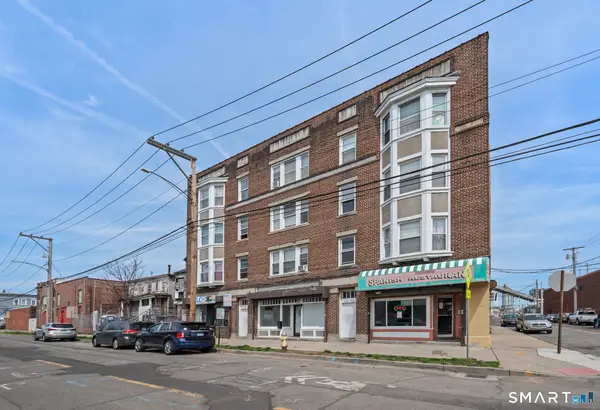
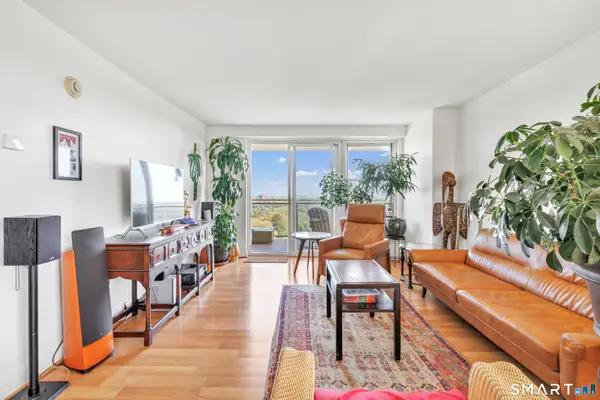 $259,900Active1 beds 1 baths917 sq. ft.
2625 Park Avenue #PHD, Bridgeport, CT 06604
MLS# 24172863Listed by: RE/MAX Heritage - New
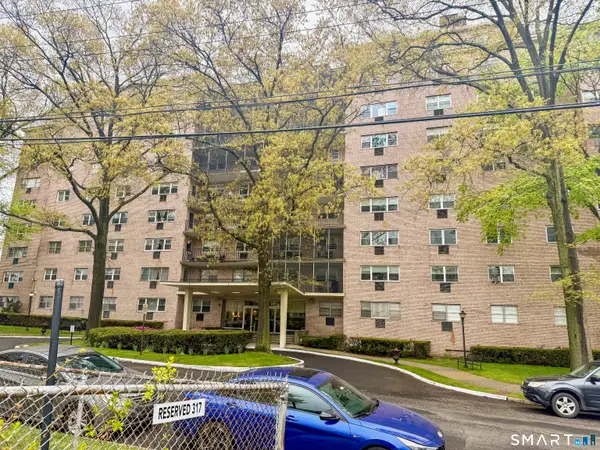
 $214,999Active1 beds 1 baths910 sq. ft.
881 Lafayette Boulevard #4N, Bridgeport, CT 06604
MLS# 24173770Listed by: BHGRE Gaetano Marra Homes - New
 $575,000Active8 beds 3 baths2,679 sq. ft.
18-20 Clinton Avenue, Bridgeport, CT 06605
MLS# 24170041Listed by: Century 21 Scala Group - New
 $68,500Active2 beds 1 baths700 sq. ft.
610 Wilmot Avenue #6, Bridgeport, CT 06607
MLS# 24173148Listed by: Howard Hanna Rand Realty - New
 $469,000Active3 beds 1 baths1,125 sq. ft.
11 Marcy Road, Bridgeport, CT 06606
MLS# 24172149Listed by: Keller Williams Prestige Prop. - New
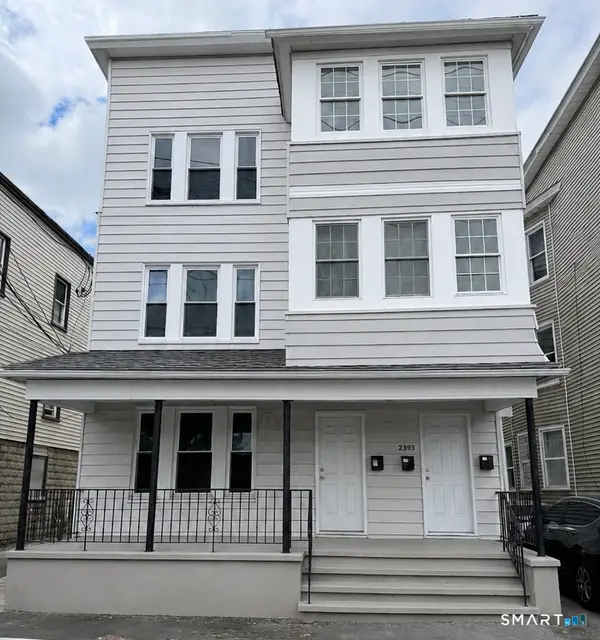 $699,900Active9 beds 3 baths3,786 sq. ft.
2391 Main Street, Bridgeport, CT 06606
MLS# 24172986Listed by: Century 21 Scala Group - New
 $679,900Active6 beds 4 baths2,750 sq. ft.
149 Ashton Street, Bridgeport, CT 06606
MLS# 24173408Listed by: RE/MAX Right Choice - New
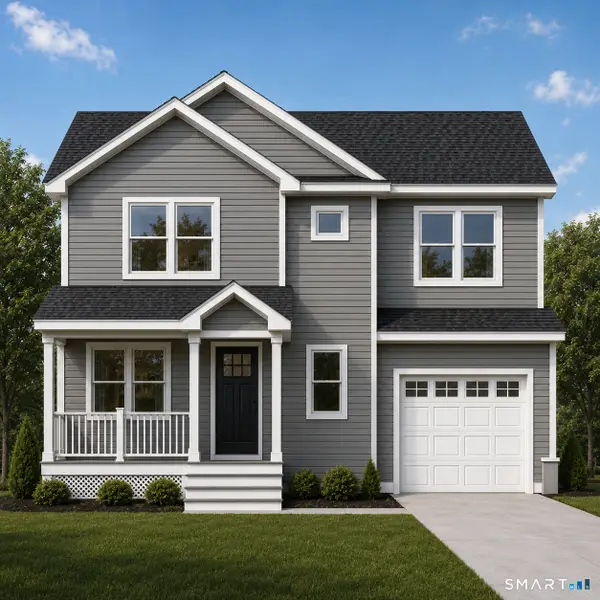
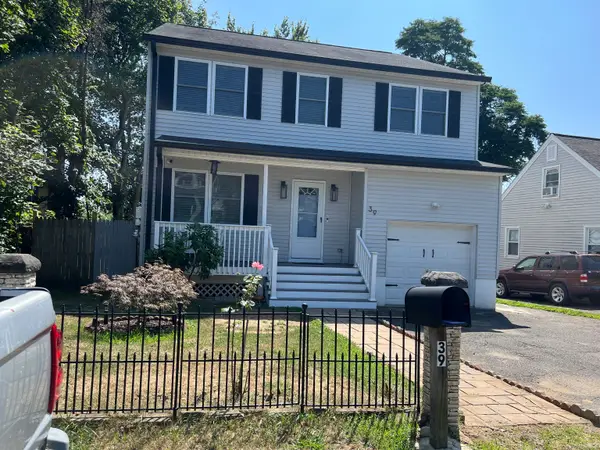 $515,000Active4 beds 3 baths2,624 sq. ft.
39 Moffitt Street #39, Bridgeport, CT 06606
MLS# 24172033Listed by: BHGRE Shore & Country - New
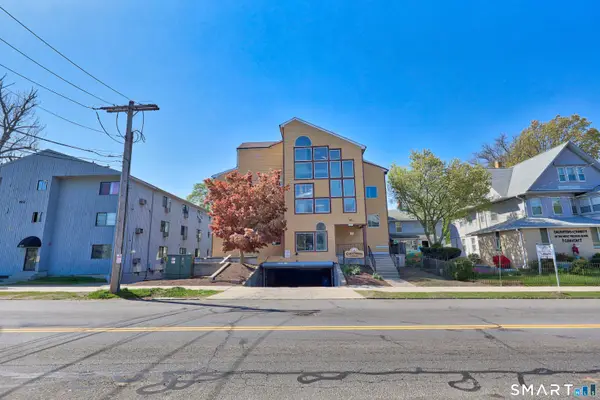 $225,000Active2 beds 2 baths829 sq. ft.
1492 North Avenue #204, Bridgeport, CT 06604
MLS# 24172729Listed by: Rosana Melo Realty - New
 $249,999Active2 beds 2 baths1,363 sq. ft.
25 Cartright Street #7E, Bridgeport, CT 06604
MLS# 24172437Listed by: ERIS, LLC - New
 $420,000Active6 beds 3 baths3,434 sq. ft.
1193 Park Avenue, Bridgeport, CT 06606
MLS# 24169838Listed by: Connecticut Choice Realty - Coming Soon
 $680,000Coming Soon9 beds 3 baths
667 Noble Avenue, Bridgeport, CT 06608
MLS# 24172353Listed by: Jose Miguel Soto - New
 $269,000Active4 beds 1 baths1,152 sq. ft.
75 Brookside Avenue, Bridgeport, CT 06606
MLS# 24172910Listed by: Lakeshore Realty - New
 $595,000Active8 beds 3 baths2,888 sq. ft.
Address Withheld By Seller, Bridgeport, CT 06608
MLS# 24172010Listed by: GT Properties - New
 $239,900Active1 beds 2 baths1,131 sq. ft.
2625 Park Avenue #14J, Bridgeport, CT 06604
MLS# 24172866Listed by: RE/MAX Heritage - New
 $419,900Active4 beds 2 baths2,369 sq. ft.
112 Benham Avenue, Bridgeport, CT 06604
MLS# 24172294Listed by: Pearce Real Estate - New
 $279,000Active3 beds 1 baths1,031 sq. ft.
1735 Central Avenue, Bridgeport, CT 06610
MLS# 24172235Listed by: RE/MAX Right Choice - New
 $499,000Active6 beds 6 baths4,554 sq. ft.
339 Pearl Street, Bridgeport, CT 06608
MLS# 24171550Listed by: Keller Williams Realty - New
 $399,000Active6 beds 4 baths2,400 sq. ft.
44-46 Grenelle Street, Bridgeport, CT 06606
MLS# 24171604Listed by: Keller Williams Realty - New
 $40,000Active0.09 Acres
34 Grenelle Street, Bridgeport, CT 06606
MLS# 24171641Listed by: Keller Williams Realty  $400,000Pending3 beds 2 baths1,633 sq. ft.
3850 Old Town Road, Bridgeport, CT 06606
MLS# 24171922Listed by: RE/MAX Right Choice- New
 $424,900Active3 beds 2 baths1,512 sq. ft.
310 Douglas Street, Bridgeport, CT 06606
MLS# 24172547Listed by: Coldwell Banker Realty - New
 $79,900Active1 beds 1 baths700 sq. ft.
610 Wilmot Avenue #4, Bridgeport, CT 06607
MLS# 24171240Listed by: FIV REALTY CO. CONNECTICUT,LLC - Open Sat, 12 to 2pmNew
 $515,000Active4 beds 2 baths1,309 sq. ft.
113 Clark Street, Bridgeport, CT 06606
MLS# 24171651Listed by: BHGRE Gaetano Marra Homes - New
 $480,000Active5 beds 2 baths2,226 sq. ft.
133 East Eaton Street, Bridgeport, CT 06604
MLS# 24172358Listed by: One 11 Realty - New
 $259,000Active2 beds 1 baths950 sq. ft.
49 Mencel Circle #B, Bridgeport, CT 06610
MLS# 24172018Listed by: Top Tier Realty Group, LLC  $349,900Pending4 beds 2 baths1,712 sq. ft.
270-Bond Bond Street, Bridgeport, CT 06610
MLS# 24171490Listed by: RE/MAX Right Choice- New
 $699,000Active6 beds 3 baths2,833 sq. ft.
885 Grand Street, Bridgeport, CT 06604
MLS# 24171785Listed by: Coldwell Banker Realty - New
 $350,000Active3 beds 2 baths1,373 sq. ft.
403 Clark Street, Bridgeport, CT 06606
MLS# 24171987Listed by: RE/MAX Right Choice - New
 $599,900Active8 beds 3 baths4,348 sq. ft.
1211 Park Avenue, Bridgeport, CT 06604
MLS# 24171583Listed by: Houlihan Lawrence WD - New
 $345,900Active2 beds 2 baths1,145 sq. ft.
3250 Fairfield Avenue #206, Bridgeport, CT 06605
MLS# 24171676Listed by: Laufer Real Estate - New
 $220,000Active1 beds 1 baths1,007 sq. ft.
557 Glendale Avenue #557, Bridgeport, CT 06606
MLS# 24171664Listed by: Redfin Corporation - New
 $459,900Active2 beds 2 baths1,212 sq. ft.
891 Evers St Extension, Bridgeport, CT 06610
MLS# 24171791Listed by: US Asset Realty - Coming Soon
 $520,000Coming Soon3 beds 3 baths
55 Beauvue Terrace, Bridgeport, CT 06606
MLS# 24171786Listed by: BHGRE Gaetano Marra Homes - New
 $295,000Active3 beds 3 baths1,239 sq. ft.
366 Dover Street, Bridgeport, CT 06610
MLS# 24171719Listed by: JW Real Estate, LLC - New
 $579,900Active3 beds 3 baths1,992 sq. ft.
273 Brooklawn Avenue, Bridgeport, CT 06604
MLS# 24170971Listed by: ASJ Realty Partners 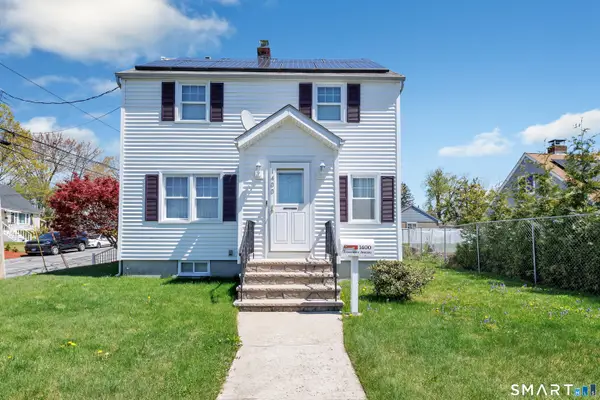 $395,000Pending3 beds 2 baths1,360 sq. ft.
1400 Reservoir Avenue, Bridgeport, CT 06606
MLS# 24170940Listed by: Keller Williams Realty Prtnrs.- New
 $575,000Active4 beds 2 baths3,635 sq. ft.
664-666 Iranistan Avenue, Bridgeport, CT 06604
MLS# 24170733Listed by: US Asset Realty - New
 $169,900Active1 beds 1 baths621 sq. ft.
850 Atlantic Street #212, Bridgeport, CT 06604
MLS# 24171242Listed by: RE/MAX Heritage - Open Sat, 12:15 to 2:15pmNew
 $339,000Active3 beds 1 baths1,001 sq. ft.
182 Trumbull Avenue, Bridgeport, CT 06606
MLS# 24170429Listed by: Rosana Melo Realty  $425,000Pending3 beds 2 baths1,200 sq. ft.
105 Bear Paw Road, Bridgeport, CT 06606
MLS# 24170945Listed by: BHGRE Gaetano Marra Homes- New
 $125,000Active2 beds 1 baths1,000 sq. ft.
1040 Connecticut Avenue, Bridgeport, CT 06607
MLS# 24171451Listed by: Keller Williams Realty - New
 $1,550,000Active12 beds 4 baths13,776 sq. ft.
1368-1370 East Main Street, Bridgeport, CT 06608
MLS# 24171252Listed by: BHGRE Shore & Country  $27,000Pending1 beds 1 baths401 sq. ft.
395-Bld 3 Granfield Avenue #D, Bridgeport, CT 06610
MLS# 24171092Listed by: Global Real Estate Services, LLC- New
 $575,000Active6 beds 2 baths3,113 sq. ft.
196 Park Street, Bridgeport, CT 06608
MLS# 24171352Listed by: Weichert, Realtors-On The Mark - Open Sat, 2:15 to 4:15pmNew
 $639,900Active4 beds 3 baths2,131 sq. ft.
420 Greenwood Street, Bridgeport, CT 06606
MLS# 24171286Listed by: Rosana Melo Realty - New
 $2,150,000Active12 beds 12 baths7,614 sq. ft.
390 Carroll Avenue, Bridgeport, CT 06607
MLS# 24171181Listed by: eXp Realty 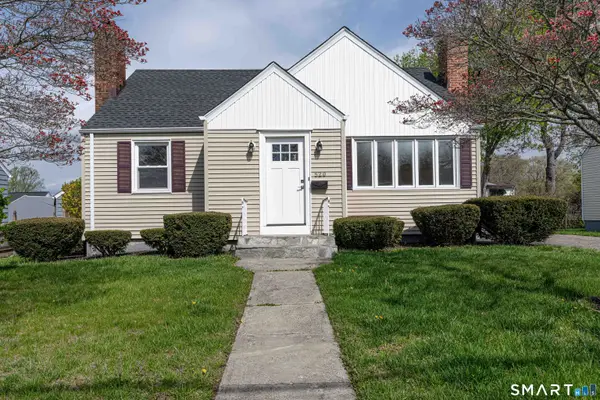 $450,000Pending4 beds 1 baths1,278 sq. ft.
520 Goldenrod Avenue, Bridgeport, CT 06606
MLS# 24170734Listed by: Coldwell Banker Realty- New
 $324,900Active3 beds 2 baths1,124 sq. ft.
302 Dover Street, Bridgeport, CT 06610
MLS# 24171033Listed by: Faustin Realty Group - New
 $650,000Active8 beds 4 baths3,056 sq. ft.
118-120 Pequonnock Street, Bridgeport, CT 06604
MLS# 24170987Listed by: Century 21 Scala Group - New
 $258,000Active2 beds 1 baths1,023 sq. ft.
177 Kennedy Drive #177, Bridgeport, CT 06606
MLS# 24170609Listed by: William Raveis Real Estate - Open Sat, 10am to 12pmNew
 $789,900Active13 beds 4 baths3,457 sq. ft.
59-61 Myrtle Avenue, Bridgeport, CT 06604
MLS# 24170116Listed by: Rosana Melo Realty - New
 $279,900Active2 beds 1 baths768 sq. ft.
110 Greystone Road, Bridgeport, CT 06610
MLS# 24168524Listed by: Coldwell Banker Realty 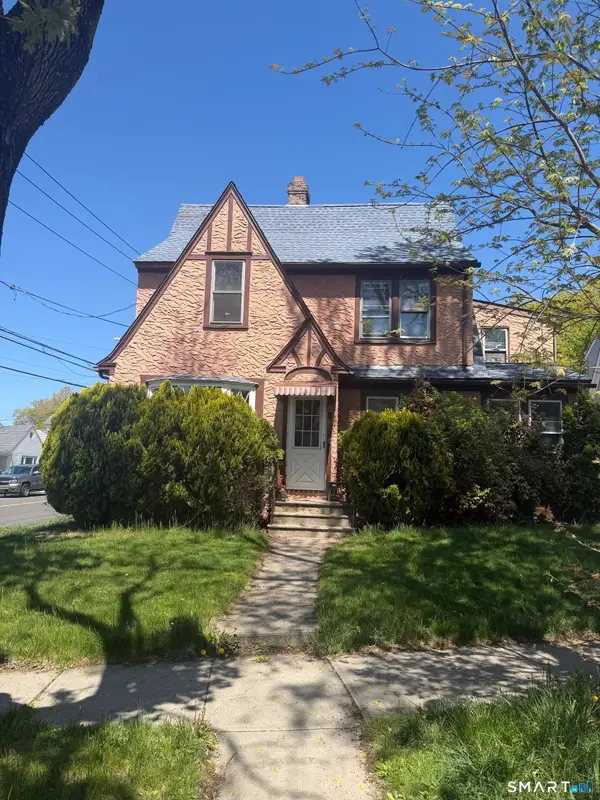 $224,990Pending3 beds 2 baths2,324 sq. ft.
228 Westfield Avenue, Bridgeport, CT 06606
MLS# 24170628Listed by: Sailpoint Property Group- New
 $1,950,000Active18 beds 9 baths16,832 sq. ft.
340 Main Street, Bridgeport, CT 06604
MLS# 24170473Listed by: Baldwin Pearson & Co., Inc  $389,900Active3 beds 2 baths1,426 sq. ft.
56 Peet Street, Bridgeport, CT 06606
MLS# 24165221Listed by: Town & Country Investments $749,000Active6 beds 3 baths2,968 sq. ft.
610 Hawley Avenue, Bridgeport, CT 06606
MLS# 24169021Listed by: ARG Advisors $499,900Active5 beds 3 baths1,740 sq. ft.
242 Pearl Harbor Street, Bridgeport, CT 06610
MLS# 24170312Listed by: Vylla Home (CT) LLC $599,900Active6 beds 5 baths4,399 sq. ft.
110 Coleman Street, Bridgeport, CT 06604
MLS# 24169973Listed by: Silver and Oak Realty $415,000Active2 beds 2 baths1,144 sq. ft.
900 Merritt Street, Bridgeport, CT 06606
MLS# 24169985Listed by: Century 21 Scala Group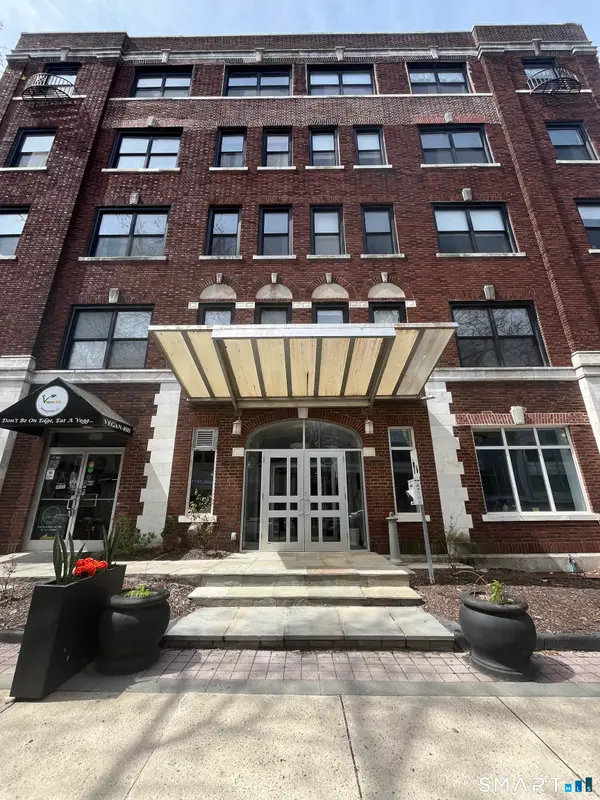 $315,000Active2 beds 2 baths1,452 sq. ft.
881 Lafayette Boulevard #1A, Bridgeport, CT 06604
MLS# 24167688Listed by: KNG Realty LLC $459,000Active4 beds 2 baths1,876 sq. ft.
3460 Main Street, Bridgeport, CT 06606
MLS# 24169748Listed by: William Raveis Real Estate $565,000Pending6 beds 6 baths3,120 sq. ft.
32-34 Yale Street, Bridgeport, CT 06605
MLS# 24169817Listed by: A to Z Realty $375,000Pending3 beds 1 baths1,076 sq. ft.
81 Dodd Avenue, Bridgeport, CT 06606
MLS# 24169844Listed by: eXp Realty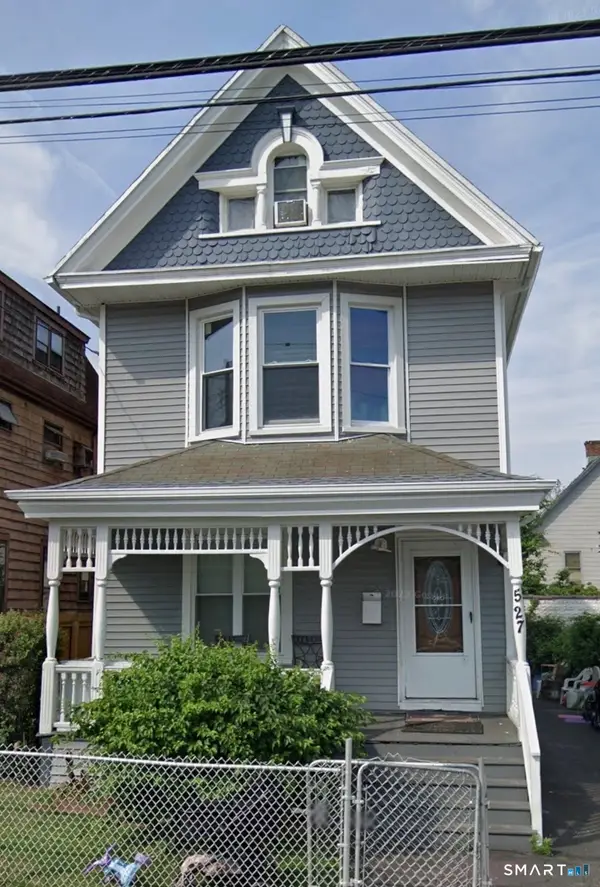 $400,000Active3 beds 1 baths1,751 sq. ft.
527 Colorado Avenue, Bridgeport, CT 06605
MLS# 24169831Listed by: Coldwell Banker Realty $650,000Pending5 beds 2 baths2,708 sq. ft.
372 Summit Street, Bridgeport, CT 06606
MLS# 24169597Listed by: William Raveis Real Estate $699,900Pending12 beds 3 baths4,877 sq. ft.
40-44 Vine Street, Bridgeport, CT 06604
MLS# 24169478Listed by: RE/MAX Right Choice $225,000Active2 beds 2 baths829 sq. ft.
1492 North Avenue #202, Bridgeport, CT 06604
MLS# 24169559Listed by: Coldwell Banker Bivins Realty $449,900Active6 beds 2 baths2,780 sq. ft.
202-204 James Street, Bridgeport, CT 06604
MLS# 24169454Listed by: Social & Co Realty $449,000Active4 beds 3 baths1,104 sq. ft.
31 Elm Court, Bridgeport, CT 06606
MLS# 24166443Listed by: Rosana Melo Realty $265,000Active3 beds 1 baths1,128 sq. ft.
218 Virginia Avenue #C, Bridgeport, CT 06610
MLS# 24169029Listed by: RE/MAX Precision Realty $30,000Active1 beds 1 baths401 sq. ft.
317 Granfield Avenue #B, Bridgeport, CT 06610
MLS# 24169244Listed by: BHGRE Gaetano Marra Homes- Open Sat, 11am to 1pm
 $629,995Active5 beds 3 baths3,072 sq. ft.
1210 Laurel Avenue, Bridgeport, CT 06604
MLS# 24169312Listed by: eRealty Advisors, Inc.  $325,000Pending4 beds 1 baths1,152 sq. ft.
150 Trumbull Avenue, Bridgeport, CT 06606
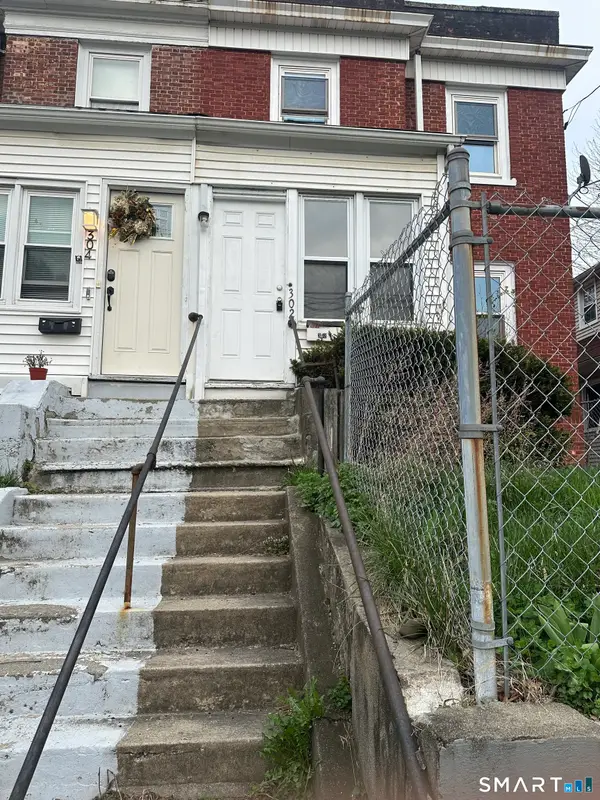
MLS# 24169382Listed by: BHGRE Gaetano Marra Homes $179,900Pending0.1 Acres
304 Pixlee Place, Bridgeport, CT 06610
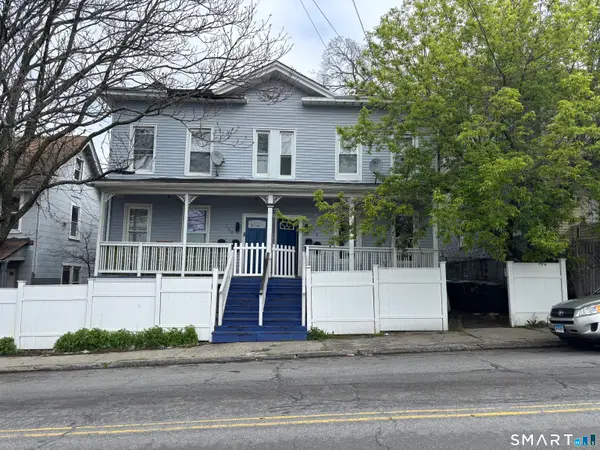
MLS# 24168795Listed by: Smart Realty Services Corp $185,000Active1 beds 2 baths1,032 sq. ft.
183 Livingston Place #3, Bridgeport, CT 06610
MLS# 24168785Listed by: Roundtree Realty LLC $425,000Pending6 beds 3 baths2,585 sq. ft.
1403 Boston Avenue, Bridgeport, CT 06610
MLS# 24169057Listed by: Robert C White & Company LLC $569,900Pending4 beds 2 baths3,003 sq. ft.
525 Westfield Avenue, Bridgeport, CT 06606
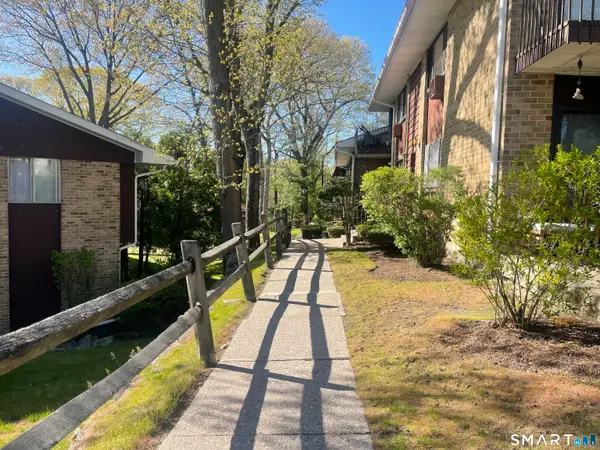
MLS# 24169000Listed by: Social & Co Realty $220,000Active2 beds 2 baths1,297 sq. ft.
50 Greenhouse Road #26B, Bridgeport, CT 06606
MLS# 24166606Listed by: Keller Williams Realty Prtnrs. $345,000Pending3 beds 2 baths1,624 sq. ft.
311 Alba Avenue, Bridgeport, CT 06606
MLS# 24168040Listed by: RE/MAX Right Choice $385,000Active4 beds 2 baths1,411 sq. ft.
265 Greenwood Street, Bridgeport, CT 06606
MLS# 24168453Listed by: Coldwell Banker Realty 2000 $329,000Pending4 beds 2 baths1,712 sq. ft.
307 Dover Street, Bridgeport, CT 06610
MLS# 24168703Listed by: RE/MAX Right Choice $169,000Active1 beds 1 baths604 sq. ft.
2370 North Avenue #4C, Bridgeport, CT 06604
MLS# 24167004Listed by: KW Legacy Partners $524,900Pending3 beds 3 baths2,272 sq. ft.
2776 East Main Street, Bridgeport, CT 06610
MLS# 24167861Listed by: Ghent Realty Advisors $90,000Active2 beds 1 baths800 sq. ft.
347 Iranistan Avenue, Bridgeport, CT 06604
MLS# 24168457Listed by: Coldwell Banker Realty $355,000Pending2 beds 3 baths1,490 sq. ft.
2612 North Avenue #F9, Bridgeport, CT 06604
MLS# 24168302Listed by: William Raveis Real Estate $59,000Active2 beds 1 baths650 sq. ft.
744 Canaan Road Road #23, Bridgeport, CT 06610
MLS# 24167897Listed by: Weichert Realtors MRG $999,000Pending6 beds 4 baths2,876 sq. ft.
245 Sailors Lane, Bridgeport, CT 06605
MLS# 24167444Listed by: Compass Connecticut, LLC $469,900Pending3 beds 3 baths1,980 sq. ft.
625 Evers Street, Bridgeport, CT 06610
MLS# 24167931Listed by: Coldwell Banker Realty $269,000Pending2 beds 1 baths912 sq. ft.
71 Sunshine Circle, Bridgeport, CT 06606
MLS# 24167991Listed by: Dave Jones Realty, LLC $70,000Active0.04 Acres
520 Seaview Avenue, Bridgeport, CT 06607
MLS# 24168020Listed by: Las Americas Real Estate $549,000Pending4 beds 2 baths2,636 sq. ft.
150 Gurdon Street, Bridgeport, CT 06606
MLS# 24161538Listed by: eXp Realty $349,000Pending5 beds 2 baths1,924 sq. ft.
809 Norman Street, Bridgeport, CT 06605
MLS# 24167957Listed by: Houlihan Lawrence $134,000Active1 beds 1 baths681 sq. ft.
45 Stevens Street #1D, Bridgeport, CT 06606
MLS# 24167326Listed by: Spadaccino Realty Team $199,500Pending1 beds 1 baths776 sq. ft.
881 Lafayette Boulevard #3K, Bridgeport, CT 06604
MLS# 24165394Listed by: Coldwell Banker Realty $450,000Pending3 beds 2 baths1,252 sq. ft.
27 Plateau Avenue, Bridgeport, CT 06606
MLS# 24167209Listed by: US Asset Realty $135,000Pending0.43 Acres
115 Silver Street, Bridgeport, CT 06610
MLS# 24167739Listed by: Coldwell Banker Realty $639,900Pending5 beds 3 baths3,044 sq. ft.
41-43 Worth Street, Bridgeport, CT 06604
MLS# 24167741Listed by: RE/MAX Right Choice $119,900Pending-- beds 1 baths384 sq. ft.
25 Ellsworth Street #17, Bridgeport, CT 06605
MLS# 24165791Listed by: Coldwell Banker Realty $399,000Active3 beds 2 baths1,958 sq. ft.
533 Wayne Street, Bridgeport, CT 06606
MLS# 24167122Listed by: Houlihan Lawrence $739,900Pending8 beds 4 baths4,288 sq. ft.
157-163 Sage Avenue, Bridgeport, CT 06610
MLS# 24162117Listed by: RE/MAX Right Choice $1,600,000Active0.96 Acres
437 Huntington Turnpike, Bridgeport, CT 06610
MLS# 24167139Listed by: Property World $425,000Pending4 beds 2 baths1,416 sq. ft.
63 Richfield Road, Bridgeport, CT 06606
MLS# 24166631Listed by: Coldwell Banker Realty $649,500Active2 beds 3 baths1,731 sq. ft.
80 Bywater Lane #80, Bridgeport, CT 06605
MLS# 24163676Listed by: William Raveis Real Estate $520,000Active3 beds 5 baths2,391 sq. ft.
164 Coleman Street, Bridgeport, CT 06605
MLS# 24161563Listed by: Las Americas Real Estate $130,000Pending1 beds 1 baths650 sq. ft.
31 Nob Hill Circle #A, Bridgeport, CT 06610
MLS# 24165753Listed by: Calcagni Real Estate $399,900Pending2 beds 2 baths1,588 sq. ft.
35 Nelson Terrace, Bridgeport, CT 06610
MLS# 24164342Listed by: Coldwell Banker Realty $185,000Active2 beds 1 baths850 sq. ft.
2756 Madison Avenue #1A, Bridgeport, CT 06606
MLS# 24165752Listed by: Coldwell Banker Realty $569,000Active4 beds 2 baths3,271 sq. ft.
727 Iranistan Avenue, Bridgeport, CT 06605
MLS# 24165097Listed by: YellowBrick Real Estate LLC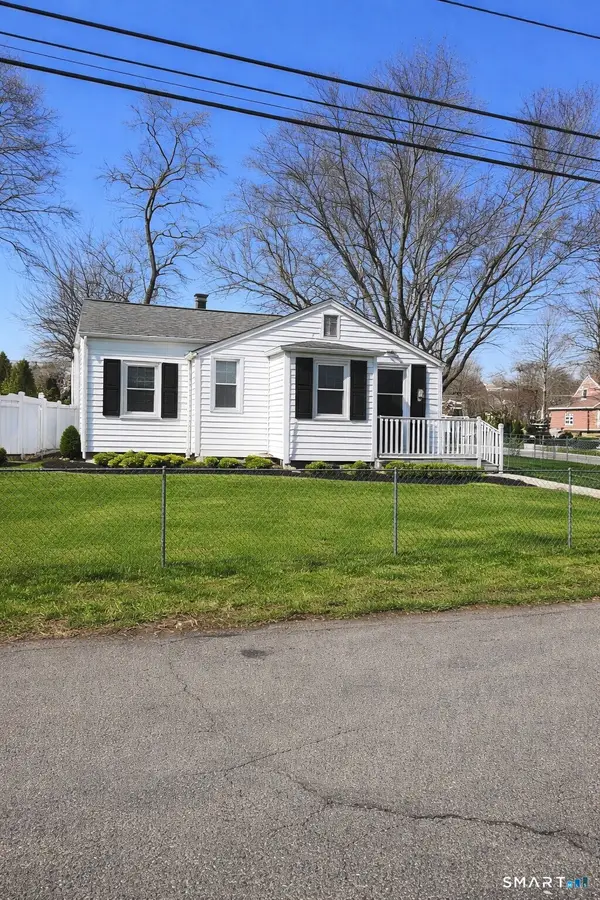 $289,900Pending2 beds 1 baths618 sq. ft.
306 Saunders Avenue, Bridgeport, CT 06606
MLS# 24165449Listed by: Great Estates, CT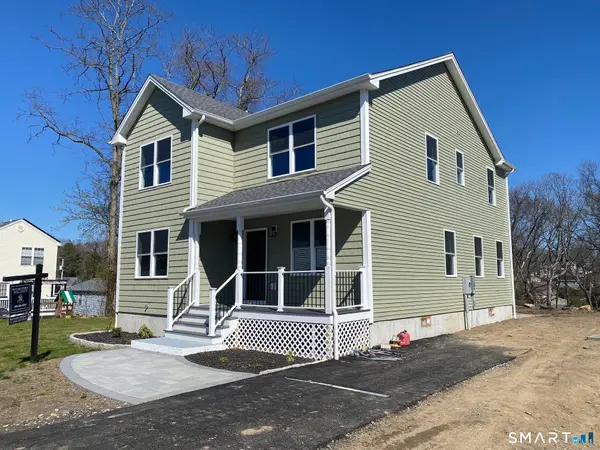 $599,900Active4 beds 3 baths2,200 sq. ft.
277 Alba Avenue, Bridgeport, CT 06606
MLS# 24166270Listed by: Richard Morse Real Estate, LLC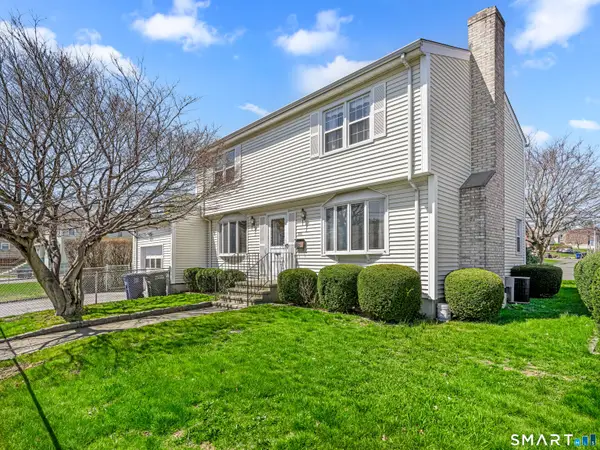 $475,000Pending3 beds 3 baths1,734 sq. ft.
356 Madison Terrace, Bridgeport, CT 06606
MLS# 24165970Listed by: Coldwell Banker Realty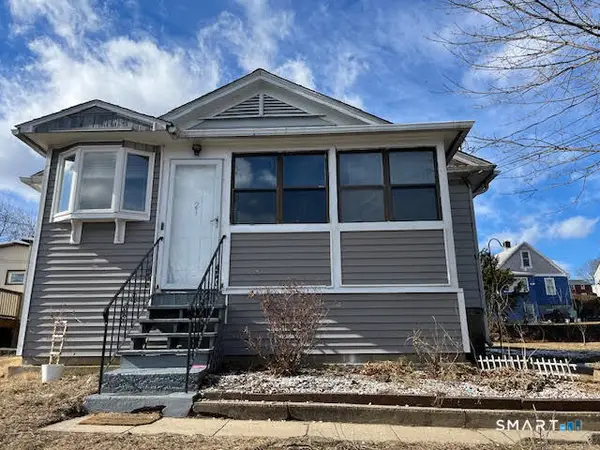 $355,000Pending3 beds 1 baths1,596 sq. ft.
217 Hillcrest Road, Bridgeport, CT 06606
MLS# 24166157Listed by: Century 21 Scala Group $159,000Pending1 beds 1 baths800 sq. ft.
325 Lafayette Street #8302, Bridgeport, CT 06604
MLS# 24161959Listed by: Realty ONE Group Connect $285,000Pending4 beds 2 baths1,680 sq. ft.
11 Beverly Drive, Bridgeport, CT 06610
MLS# 24164820Listed by: Coldwell Banker Realty $545,000Pending7 beds 2 baths4,751 sq. ft.
314-316 Seaview Avenue, Bridgeport, CT 06607
MLS# 24154525Listed by: YellowBrick Real Estate LLC $574,999Pending4 beds 4 baths2,960 sq. ft.
65 Brooklawn Place, Bridgeport, CT 06604
MLS# 24164921Listed by: eXp Realty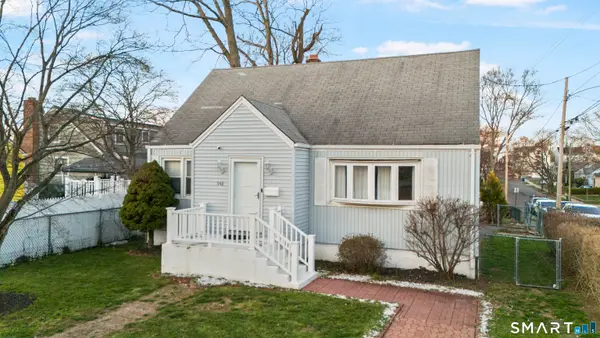 $485,000Active5 beds 2 baths1,327 sq. ft.
948 Wayne Street, Bridgeport, CT 06606
MLS# 24166111Listed by: Keller Williams Prestige Prop. $219,900Active1 beds 1 baths781 sq. ft.
462 Glendale Avenue #11, Bridgeport, CT 06606
MLS# 24166046Listed by: Fairfield County Real Estate $215,000Active1 beds 1 baths918 sq. ft.
333 Vincellette Street #23, Bridgeport, CT 06606
MLS# 24165930Listed by: mygoodagent $599,000Active5 beds 3 baths1,672 sq. ft.
227 Newfield Avenue, Bridgeport, CT 06607
MLS# 24165326Listed by: William Raveis Real Estate $339,900Active2 beds 3 baths1,200 sq. ft.
800 Seaview Avenue #770-2, Bridgeport, CT 06607
MLS# 24162031Listed by: ASJ Realty Partners $489,900Active4 beds 2 baths1,544 sq. ft.
104 Oakdale Street, Bridgeport, CT 06606
MLS# 24164081Listed by: Rainbow Realty $199,900Active2 beds 1 baths850 sq. ft.
185 Cherry Hill Drive #1A, Bridgeport, CT 06606
MLS# 24133981Listed by: RE/MAX Right Choice $59,900Pending2 beds 1 baths700 sq. ft.
Address Withheld By Seller, Bridgeport, CT 06607
MLS# 24164988Listed by: McCray Realty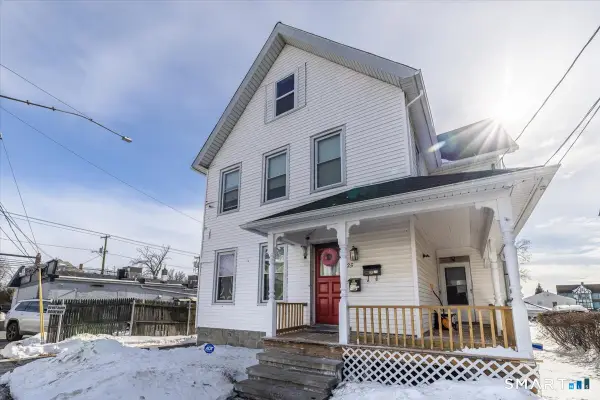 $599,900Active5 beds 3 baths2,953 sq. ft.
25 Westfield Avenue, Bridgeport, CT 06606
MLS# 24165276Listed by: BHGRE Gaetano Marra Homes- Open Sat, 1:30 to 3pm
 $489,000Active3 beds 3 baths1,358 sq. ft.
415 Jewett Avenue, Bridgeport, CT 06066
MLS# 24164818Listed by: Robert C White & Company LLC  $399,900Pending4 beds 2 baths1,812 sq. ft.
593 Wayne Street, Bridgeport, CT 06606
MLS# 24164879Listed by: Berkshire Hathaway NE Prop.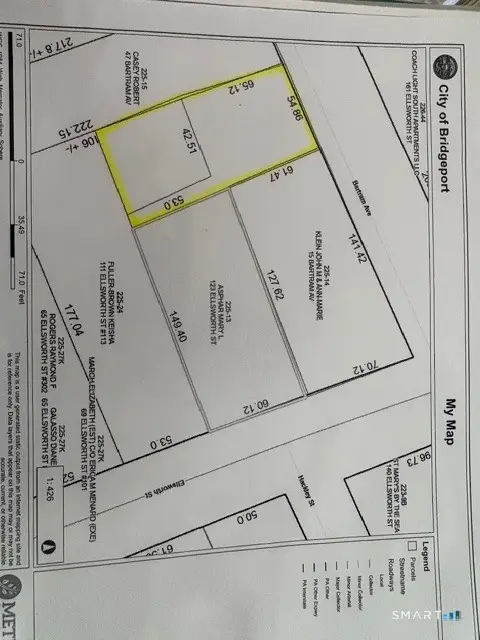 $450,000Active0.16 Acres
37 Bartram Avenue, Bridgeport, CT 06605
MLS# 24164920Listed by: Compass Connecticut, LLC $185,000Pending2 beds 1 baths1,065 sq. ft.
325 Lafayette Street #8309, Bridgeport, CT 06604
MLS# 24164166Listed by: Higgins Group Real Estate $420,000Pending3 beds 2 baths1,532 sq. ft.
40 Sullivan Place, Bridgeport, CT 06610
MLS# 24163048Listed by: Coldwell Banker Realty $217,500Active1 beds 1 baths748 sq. ft.
881 Lafayette Boulevard #4L, Bridgeport, CT 06604
MLS# 24164657Listed by: Criterion Real Estate LLC $60,000Pending2 beds 1 baths700 sq. ft.
566 Wilmont Avenue, Bridgeport, CT 06607
MLS# 24163856Listed by: Coldwell Banker Realty $485,000Active4 beds 3 baths2,564 sq. ft.
111 Elmwood Place, Bridgeport, CT 06605
MLS# 24164456Listed by: Century 21 Scala Group $299,000Pending2 beds 2 baths1,186 sq. ft.
92 Cherry Hill Drive, Bridgeport, CT 06066
MLS# 24164471Listed by: Dorrance Realty $499,000Pending6 beds 2 baths3,108 sq. ft.
185 Grandview Avenue, Bridgeport, CT 06606
MLS# 24164512Listed by: Century 21 Scala Group $349,000Pending2 beds 2 baths1,245 sq. ft.
715 Frenchtown Road #3, Bridgeport, CT 06606
MLS# 24164531Listed by: ListWithFreedom.com $85,000Active2 beds 1 baths622 sq. ft.
12 Court C Court #Bdlg 61, Bridgeport, CT 06610
MLS# 24164305Listed by: Berkshire Hathaway NE Prop. $669,000Active9 beds 3 baths3,236 sq. ft.
43 Elmwood Avenue, Bridgeport, CT 06605
MLS# 24164333Listed by: Coldwell Banker Realty $411,000Pending4 beds 1 baths1,158 sq. ft.
170 Hillside Avenue, Bridgeport, CT 06604
MLS# 24164116Listed by: Coldwell Banker Realty $111,000Active2 beds 1 baths750 sq. ft.
580 Wilmot Avenue #2, Bridgeport, CT 06607
MLS# 24164180Listed by: Century 21 Scala Group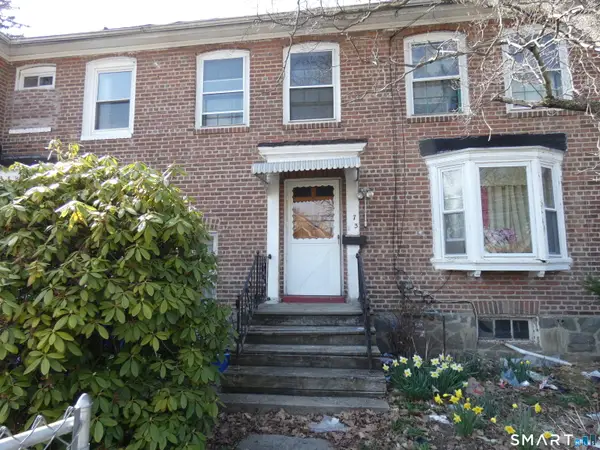 $149,000Pending3 beds 1 baths1,200 sq. ft.
73 Goddard Avenue, Bridgeport, CT 06610
MLS# 24164238Listed by: Coldwell Banker Realty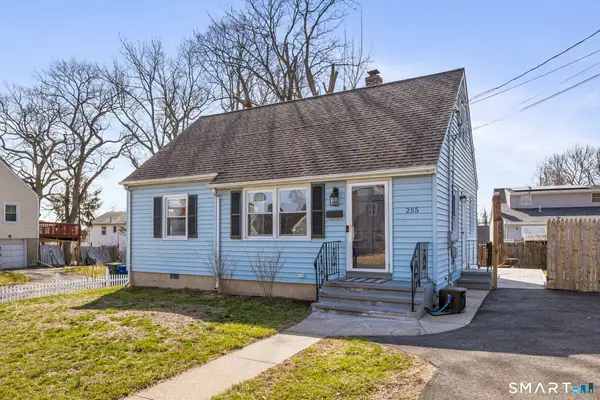 $379,900Pending3 beds 1 baths1,219 sq. ft.
255 Ruth Street, Bridgeport, CT 06606
MLS# 24164179Listed by: Align Realty LLC $500,000Pending7 beds 3 baths2,784 sq. ft.
36 Lee Avenue, Bridgeport, CT 06605
MLS# 24164120Listed by: eXp Realty $199,999Active2 beds 1 baths850 sq. ft.
15 Cherry Hill Drive #2A, Bridgeport, CT 06606
MLS# 24164084Listed by: Larracuente & Johnson Realty, LLC $869,900Pending9 beds 3 baths2,922 sq. ft.
219 Orland Street, Bridgeport, CT 06605
MLS# 24164059Listed by: Vylla Home (CT) LLC $580,000Pending2 beds 2 baths3,575 sq. ft.
47-49 Berkshire Avenue, Bridgeport, CT 06608
MLS# 24162508Listed by: eRealty Advisors, Inc. $474,900Pending3 beds 2 baths1,612 sq. ft.
135 Laurel Place, Bridgeport, CT 06604
MLS# 24163209Listed by: RE/MAX RISE $450,000Active3 beds 2 baths1,604 sq. ft.
472 Anton Street, Bridgeport, CT 06606
MLS# 24163413Listed by: Keller Williams Prestige Prop. $319,900Pending3 beds 2 baths1,224 sq. ft.
105 Pond Street, Bridgeport, CT 06606
MLS# 24163194Listed by: RE/MAX Alliance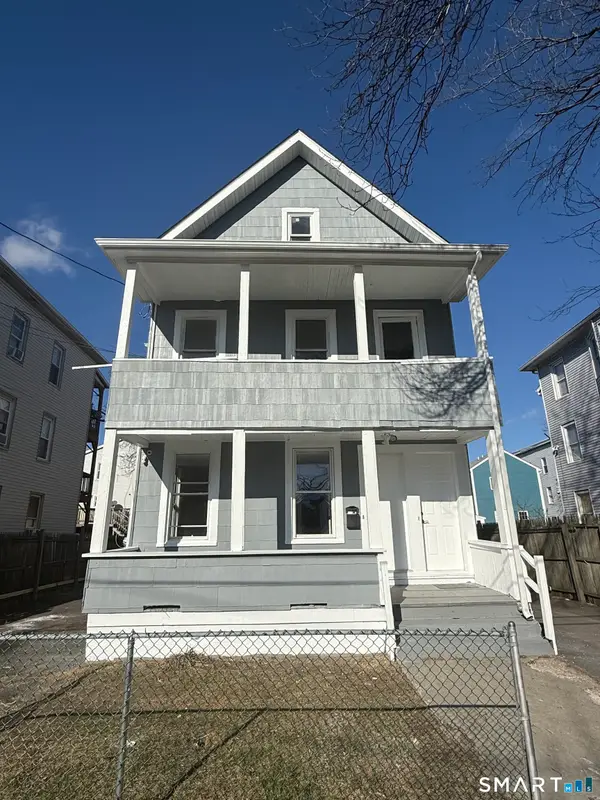 $499,900Pending4 beds 2 baths2,690 sq. ft.
239 Beardsley Street, Bridgeport, CT 06607
MLS# 24163356Listed by: eRealty Advisors, Inc.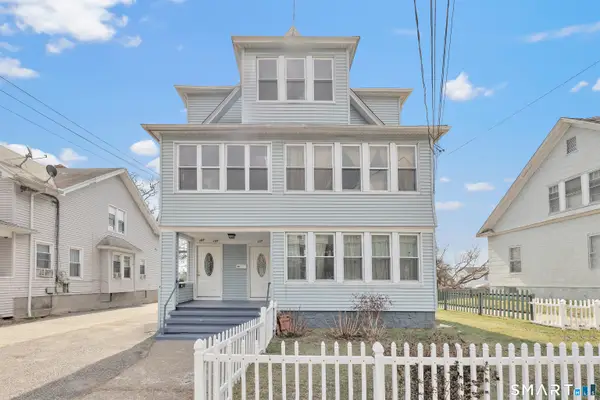 $685,000Pending6 beds 3 baths3,616 sq. ft.
155 Marion Street, Bridgeport, CT 06606
MLS# 24162546Listed by: Preston Gray Real Estate $460,000Pending4 beds 3 baths1,347 sq. ft.
360 Vincellette Street, Bridgeport, CT 06606
MLS# 24162917Listed by: Rosana Melo Realty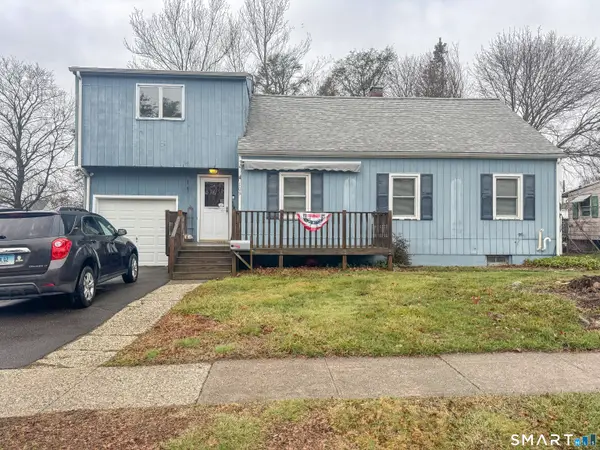 $359,000Pending4 beds 2 baths1,739 sq. ft.
109 Barclay Street, Bridgeport, CT 06610
MLS# 24160854Listed by: Houlihan Lawrence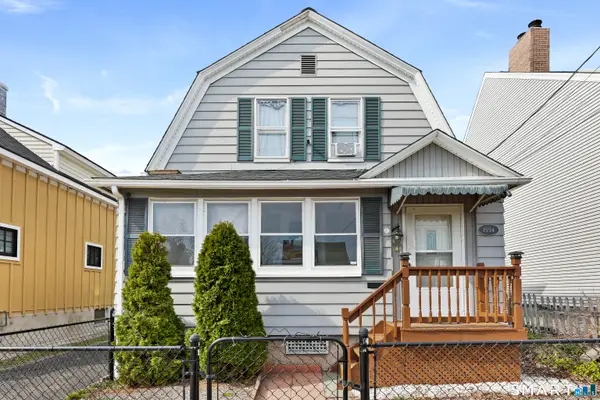 $342,000Pending2 beds 2 baths1,021 sq. ft.
1554 Capitol Avenue, Bridgeport, CT 06604
MLS# 24162772Listed by: Berkshire Hathaway NE Prop. $199,950Pending1 beds 1 baths651 sq. ft.
345 Glendale Avenue #A2, Bridgeport, CT 06606
MLS# 24162244Listed by: Keller Williams Realty Prtnrs. $520,000Active5 beds 3 baths2,580 sq. ft.
839 Laurel Avenue, Bridgeport, CT 06604
MLS# 24162872Listed by: Besmatch Real Estate $475,000Active4 beds 2 baths2,496 sq. ft.
170 Huntington Turnpike, Bridgeport, CT 06610
MLS# 24162799Listed by: Giner Real Estate $54,999Active1 beds 1 baths700 sq. ft.
644 Carroll Avenue #5, Bridgeport, CT 06607
MLS# 24162520Listed by: CLMA Realty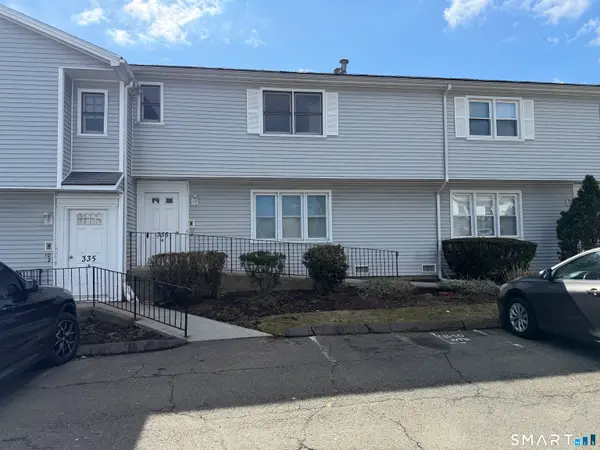 $199,000Pending1 beds 1 baths713 sq. ft.
335 Glendale Avenue #G11, Bridgeport, CT 06606
MLS# 24162358Listed by: Colonial Properties Inc $709,500Pending8 beds 3 baths3,423 sq. ft.
203-207 Wayne Street, Bridgeport, CT 06606
MLS# 24161137Listed by: William Raveis Real Estate $229,900Pending1 beds 1 baths893 sq. ft.
881 Lafayette Boulevard #3M, Bridgeport, CT 06604
MLS# 24161927Listed by: Coldwell Banker Realty $699,900Active8 beds 4 baths3,149 sq. ft.
32-34 Elmwood Avenue, Bridgeport, CT 06605
MLS# 24161988Listed by: Preston Gray Real Estate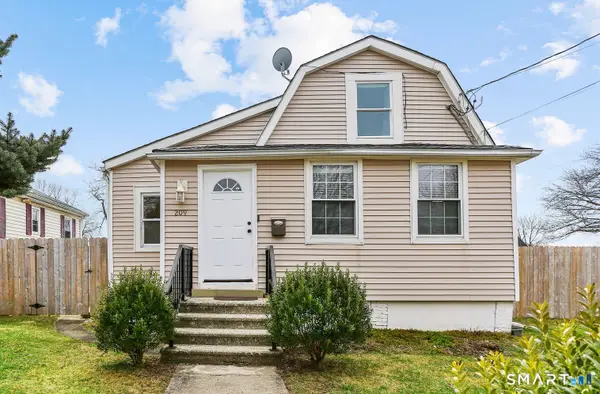 $329,900Pending3 beds 1 baths995 sq. ft.
209 Trumbull Avenue, Bridgeport, CT 06606
MLS# 24161653Listed by: RE/MAX Right Choice $359,000Active4 beds 1 baths1,152 sq. ft.
410 Platt Street, Bridgeport, CT 06606
MLS# 24161229Listed by: Keller Williams Realty $29,900Active0.06 Acres
11 Myron Avenue, Bridgeport, CT 06606
MLS# 24161883Listed by: ERA Treanor Real Estate $410,000Active4 beds 2 baths1,188 sq. ft.
25 Myron Avenue, Bridgeport, CT 06606
MLS# 24162026Listed by: Coldwell Banker Realty $485,000Pending3 beds 3 baths1,288 sq. ft.
33 Trelane Drive, Bridgeport, CT 06606
MLS# 24161326Listed by: Keller Williams Realty $142,900Pending2 beds 1 baths850 sq. ft.
78 Haddon Street #1, Bridgeport, CT 06605
MLS# 24161821Listed by: Debek Real Estate Services LLC $315,000Pending2 beds 1 baths1,004 sq. ft.
130 Holroyd Street, Bridgeport, CT 06606
MLS# 24161116Listed by: BHGRE Gaetano Marra Homes $314,900Pending2 beds 1 baths744 sq. ft.
646 Merritt Street, Bridgeport, CT 06606
MLS# 24161624Listed by: Besmatch Real Estate $498,500Pending4 beds 2 baths1,708 sq. ft.
523 West Jackson Avenue, Bridgeport, CT 06604
MLS# 24160232Listed by: William Raveis Real Estate $100,000Active0.08 Acres
860 Connecticut Avenue, Bridgeport, CT 06607
MLS# 24161591Listed by: Coldwell Banker Realty $274,900Pending3 beds 1 baths1,267 sq. ft.
459 East Avenue, Bridgeport, CT 06610
MLS# 24161455Listed by: D. Thomas Homes $374,900Pending4 beds 2 baths1,800 sq. ft.
1406 Wood Avenue, Bridgeport, CT 06604
MLS# 24160161Listed by: King Realty Group LLC $149,000Pending1 beds 1 baths733 sq. ft.
393 Laurel Avenue #210, Bridgeport, CT 06605
MLS# 24161446Listed by: eXp Realty $194,900Pending1 beds 1 baths817 sq. ft.
132 Bennett Street #302, Bridgeport, CT 06605
MLS# 24161200Listed by: Coldwell Banker Realty $175,000Pending3 beds 1 baths1,460 sq. ft.
500 Dewey Street, Bridgeport, CT 06605
MLS# 24160998Listed by: Silver and Oak Realty $179,900Pending1 beds 1 baths700 sq. ft.
252 Harlem Avenue #C4, Bridgeport, CT 06606
MLS# 24161287Listed by: RE/MAX Right Choice $1,425,000Active14 beds 6 baths6,578 sq. ft.
1389 Pembroke Street, Bridgeport, CT 06608
MLS# 24161128Listed by: Top Tier Realty Group, LLC $400,000Active6 beds 3 baths4,415 sq. ft.
105 Washington Terrace, Bridgeport, CT 06604
MLS# 24161062Listed by: Larracuente & Johnson Realty, LLC $129,900Pending2 beds 1 baths900 sq. ft.
16 Cole Street, Bridgeport, CT 06604
MLS# 24161077Listed by: RE/MAX Right Choice $650,000Active5 beds 3 baths2,446 sq. ft.
73 Orange Street, Bridgeport, CT 06607
MLS# 24149706Listed by: Keller Williams Realty Prtnrs. $569,000Active6 beds 3 baths2,716 sq. ft.
584 Kossuth Street, Bridgeport, CT 06608
MLS# 24159245Listed by: Lamacchia Realty $599,900Pending4 beds 3 baths1,984 sq. ft.
669 Queen Street, Bridgeport, CT 06606
MLS# 24160282Listed by: Preston Gray Real Estate- $370,000Pending6 beds 3 baths3,070 sq. ft.
757-759 Iranistan Avenue, Bridgeport, CT 06605
MLS# 170597328Listed by: Door to Door Real Estate  $535,000Pending-- beds 5 baths1,848 sq. ft.
33-35 Granfield Avenue, Bridgeport, CT 06610
MLS# 24112070Listed by: Top Tier Realty Group, LLC $335,000Active2 beds 2 baths1,008 sq. ft.
37-39 Granfield Avenue, Bridgeport, CT 06610
MLS# 24112072Listed by: Top Tier Realty Group, LLC $435,000Active-- beds 4 baths1,752 sq. ft.
43-45 Granfield Avenue, Bridgeport, CT 06610
MLS# 24112075Listed by: Top Tier Realty Group, LLC $995,000Active15 beds -- baths4,570 sq. ft.
357-359 Norman Street, Bridgeport, CT 06605
MLS# 24128822Listed by: Berkshire Hathaway NE Prop. $425,000Pending3 beds 2 baths1,524 sq. ft.
125-127 Alexander Drive, Bridgeport, CT 06606
MLS# 24130437Listed by: BHGRE Gaetano Marra Homes $465,000Pending4 beds 3 baths2,416 sq. ft.
40-42 5th Street, Bridgeport, CT 06607
MLS# 24132501Listed by: Guy Bocicaut Real Estate $319,900Pending4 beds 2 baths2,468 sq. ft.
363-65 Carroll Avenue, Bridgeport, CT 06607
MLS# 24134552Listed by: Berkshire Hathaway NE Prop. $402,000Active3 beds 1 baths1,470 sq. ft.
30-32 Pacific Street, Bridgeport, CT 06604
MLS# 24146548Listed by: mygoodagent $680,000Pending6 beds 3 baths3,755 sq. ft.
67-69 Kent Avenue, Bridgeport, CT 06610
MLS# 24147207Listed by: Las Americas Real Estate $798,000Pending6 beds 4 baths3,644 sq. ft.
95-97 Savoy Street, Bridgeport, CT 06606
MLS# 24149470Listed by: Alltyme Realty $650,000Active6 beds 3 baths3,183 sq. ft.
98-100 Carroll Avenue, Bridgeport, CT 06608
MLS# 24149749Listed by: Jason Mitchell Real Estate Connecticut LLC $589,900Pending6 beds 3 baths2,941 sq. ft.
2092-2096 East Main Street, Bridgeport, CT 06610
MLS# 24150249Listed by: William Raveis Real Estate $499,900Pending4 beds 2 baths2,789 sq. ft.
2100-2102 East Main Street, Bridgeport, CT 06610
MLS# 24150254Listed by: William Raveis Real Estate $559,900Active5 beds 3 baths2,403 sq. ft.
1036-1038 Maplewood Avenue, Bridgeport, CT 06605
MLS# 24151896Listed by: RE/MAX Right Choice $825,000Pending7 beds 3 baths3,957 sq. ft.
1146-1148 Iranistan Avenue, Bridgeport, CT 06605
MLS# 24152451Listed by: Las Americas Real Estate $99,900Active2 beds 1 baths816 sq. ft.
82-B Yaremich Drive, Bridgeport, CT 06606
MLS# 24152530Listed by: Berkshire Hathaway NE Prop. $385,000Pending5 beds 2 baths1,824 sq. ft.
85-89 Alexander Drive, Bridgeport, CT 06606
MLS# 24152911Listed by: William Raveis Real Estate $559,900Active4 beds 2 baths1,848 sq. ft.
403-405 Indian Avenue, Bridgeport, CT 06606
MLS# 24154328Listed by: Brian Gee Real Estate LLC $600,000Active5 beds 3 baths2,328 sq. ft.
8-10 Jetland Place, Bridgeport, CT 06605
MLS# 24156213Listed by: BHGRE Gaetano Marra Homes $690,000Pending6 beds 3 baths2,680 sq. ft.
614-618 Bishop Avenue, Bridgeport, CT 06610
MLS# 24156219Listed by: William Raveis Real Estate $644,900Active6 beds 3 baths2,582 sq. ft.
23-25 Morgan Avenue, Bridgeport, CT 06606
MLS# 24157911Listed by: William Raveis Real Estate $650,000Pending6 beds 3 baths3,198 sq. ft.
493 West Taft Avenue, Bridgeport, CT 06604
MLS# 24160640Listed by: RE/MAX Right Choice $699,999Pending9 beds 3 baths3,846 sq. ft.
744 Park Street, Bridgeport, CT 06608
MLS# 24160012Listed by: Alpha Capital Realty, LLC $429,900Active6 beds 2 baths2,464 sq. ft.
147 Trumbull Avenue, Bridgeport, CT 06606
MLS# 24160146Listed by: Davis Owen Real Estate $369,900Pending3 beds 1 baths1,152 sq. ft.
75 Fleet Street, Bridgeport, CT 06606
MLS# 24159892Listed by: Preston Gray Real Estate $380,000Active3 beds 2 baths994 sq. ft.
153 Marigold Avenue, Bridgeport, CT 06606
MLS# 24159911Listed by: Las Americas Real Estate $80,000Pending2 beds 1 baths800 sq. ft.
419 Iranistan Avenue, Bridgeport, CT 06604
MLS# 24159884Listed by: YellowBrick Real Estate LLC $193,000Pending1 beds 1 baths825 sq. ft.
50 Greenhouse Road #33D, Bridgeport, CT 06606
MLS# 24159225Listed by: Realty ONE Group Connect $790,000Active3 beds 4 baths3,315 sq. ft.
2078 Park Avenue, Bridgeport, CT 06604
MLS# 24158006Listed by: Keller Williams Prestige Prop. $585,000Active3 beds 3 baths2,016 sq. ft.
156 Dayton Road, Bridgeport, CT 06606
MLS# 24159661Listed by: HomeSmart Homes and Estates $249,999Active2 beds 1 baths1,014 sq. ft.
881 Lafayette Boulevard #2H, Bridgeport, CT 06604
MLS# 24159251Listed by: BHGRE Shore & Country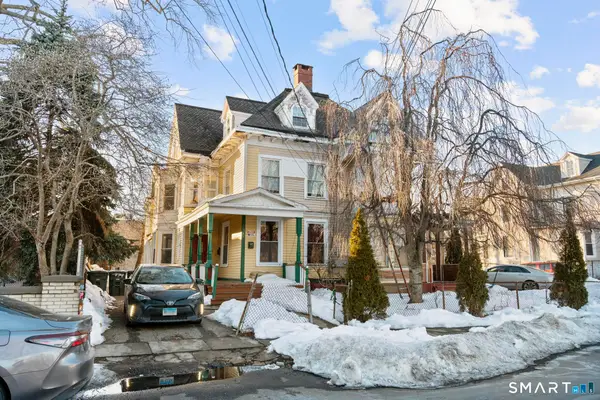 $569,000Pending14 beds 7 baths6,727 sq. ft.
349 Noble Avenue, Bridgeport, CT 06608
MLS# 24155008Listed by: Houlihan Lawrence $215,000Active1 beds 1 baths856 sq. ft.
333 Vincellette Street #27, Bridgeport, CT 06606
MLS# 24158118Listed by: Keller Williams Prestige Prop. $189,900Active2 beds 1 baths850 sq. ft.
239 Cherry Hill Drive #1A, Bridgeport, CT 06606
MLS# 24158921Listed by: Carrena Property Mgmt & Realty $59,900Active2 beds 1 baths540 sq. ft.
340 Success Avenue #Bldg 89 14, Bridgeport, CT 06610
MLS# 24158574Listed by: William Raveis Real Estate $429,000Pending2 beds 3 baths2,289 sq. ft.
2675 Park Avenue #26, Bridgeport, CT 06604
MLS# 24158166Listed by: RE/MAX Heritage $749,900Pending6 beds 3 baths3,283 sq. ft.
201 French Street, Bridgeport, CT 06606
MLS# 24158098Listed by: Coldwell Banker Realty $540,000Pending5 beds 3 baths3,217 sq. ft.
49 Elmwood Place, Bridgeport, CT 06605
MLS# 24158580Listed by: Door to Door Real Estate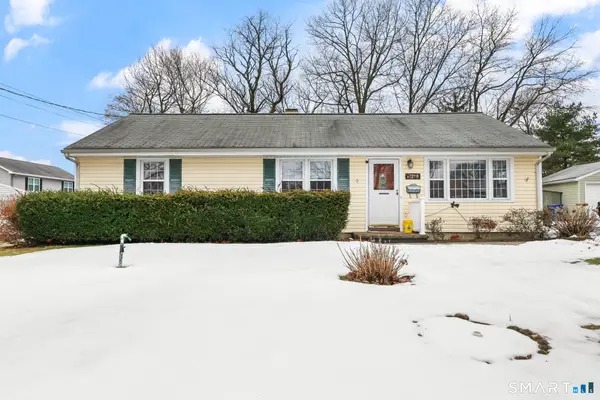 $415,000Pending3 beds 1 baths1,104 sq. ft.
105 Daniel Drive, Bridgeport, CT 06606
MLS# 24158539Listed by: Keller Williams Prestige Prop. $599,000Pending4 beds 2 baths2,940 sq. ft.
201 Lewis Street, Bridgeport, CT 06605
MLS# 24158108Listed by: Ethos Rlty, LLC $780,000Active10 beds 4 baths2,999 sq. ft.
120 Milne Street, Bridgeport, CT 06604
MLS# 24157907Listed by: Roundtree Realty LLC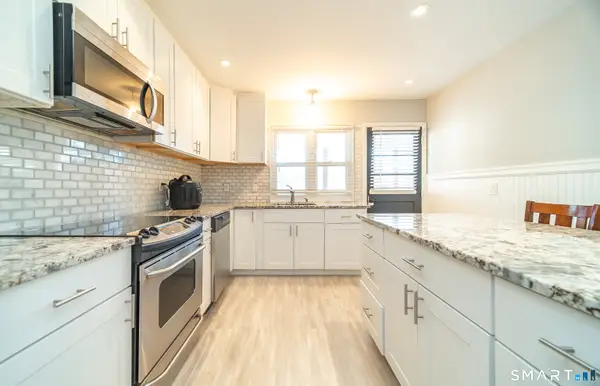 $219,900Active2 beds 1 baths850 sq. ft.
2768 Madison Avenue #2A, Bridgeport, CT 06606
MLS# 24158087Listed by: D. Thomas Homes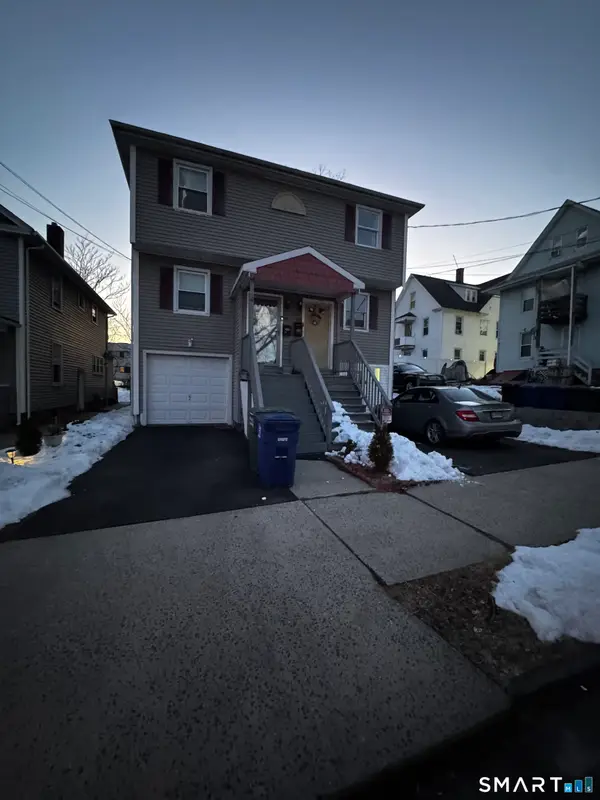 $349,999Pending3 beds 3 baths1,668 sq. ft.
157 Anson Street, Bridgeport, CT 06606
MLS# 24157422Listed by: ERIS, LLC $59,900Pending2 beds 1 baths658 sq. ft.
325 North Bishop Avenue #18, Bridgeport, CT 06610
MLS# 24156060Listed by: Coldwell Banker Realty $700,000Pending8 beds 3 baths3,740 sq. ft.
100-102 Ashley Street, Bridgeport, CT 06610
MLS# 24157363Listed by: BHGRE Shore & Country $415,000Active4 beds 1 baths1,152 sq. ft.
74 Hollywood Avenue, Bridgeport, CT 06606
MLS# 24158129Listed by: Coldwell Banker Realty $223,000Pending2 beds 2 baths960 sq. ft.
261 Pennsylvania Avenue #261, Bridgeport, CT 06610
MLS# 24156598Listed by: Coldwell Banker Realty $525,900Active4 beds 2 baths1,821 sq. ft.
660 West Jackson Avenue, Bridgeport, CT 06604
MLS# 24158057Listed by: Tri-State Realty $359,000Pending3 beds 1 baths1,271 sq. ft.
170 Judson Place, Bridgeport, CT 06610
MLS# 24157997Listed by: RE/MAX Right Choice $350,000Active3 beds 2 baths1,660 sq. ft.
537 Hollister Avenue, Bridgeport, CT 06607
MLS# 24157900Listed by: Rosania Melo Broker $49,999Active1 beds 1 baths600 sq. ft.
10 Ordnance Court #3, Bridgeport, CT 06607
MLS# 24157645Listed by: CLMA Realty $300,000Pending3 beds 2 baths1,320 sq. ft.
200 Woodmont Avenue #130, Bridgeport, CT 06606
MLS# 24126068Listed by: RE/MAX Heritage $259,900Pending2 beds 2 baths1,024 sq. ft.
360 Saunders Avenue, Bridgeport, CT 06606
MLS# 24157085Listed by: Whitestone Real Estate Group $450,000Pending4 beds 1 baths1,287 sq. ft.
69 Seaver Circle, Bridgeport, CT 06606
MLS# 24157643Listed by: Coldwell Banker Realty $359,900Pending3 beds 1 baths1,116 sq. ft.
375 Ruth Street, Bridgeport, CT 06606
MLS# 24156267Listed by: BHGRE Gaetano Marra Homes $375,000Pending2 beds 3 baths1,200 sq. ft.
800 Seaview Avenue #760-4, Bridgeport, CT 06607
MLS# 24156717Listed by: BHGRE Gaetano Marra Homes $304,999Pending2 beds 2 baths991 sq. ft.
495 Vincellette Street #12, Bridgeport, CT 06606
MLS# 24163751Listed by: Coldwell Banker Realty $320,000Pending4 beds 1 baths1,152 sq. ft.
500 Woodlawn Ave Extension, Bridgeport, CT 06606
MLS# 24156788Listed by: Emerald Glen Associates $475,000Active3 beds 2 baths1,978 sq. ft.
405 Westfield Avenue, Bridgeport, CT 06606
MLS# 24156668Listed by: Century 21 Scala Group $260,000Pending3 beds 1 baths1,124 sq. ft.
206 Remington Street, Bridgeport, CT 06610
MLS# 24156604Listed by: Smart Realty Services Corp- $780,000Pending10 beds 4 baths3,940 sq. ft.
384 Connecticut Avenue, Bridgeport, CT 06610
MLS# 24156545Listed by: Premium Realty, LLC  $299,950Pending3 beds 1 baths1,208 sq. ft.
940 Reservoir Avenue, Bridgeport, CT 06606
MLS# 24155490Listed by: Complete Real Estate $549,800Active3 beds 2 baths1,421 sq. ft.
364 Griffin Avenue, Bridgeport, CT 06606
MLS# 24156093Listed by: Tri-State Realty $399,000Active3 beds 1 baths1,104 sq. ft.
170 Marilyn Drive, Bridgeport, CT 06606
MLS# 24155743Listed by: Keller Williams Prestige Prop. $389,900Pending3 beds 1 baths1,370 sq. ft.
35 Marcel Street, Bridgeport, CT 06606
MLS# 24155672Listed by: RE/MAX Heritage $199,900Pending1 beds 1 baths825 sq. ft.
50 Greenhouse Road #49C, Bridgeport, CT 06606
MLS# 24155551Listed by: BHGRE Gaetano Marra Homes $559,999Active3 beds 3 baths2,235 sq. ft.
578 Beechmont Avenue, Bridgeport, CT 06606
MLS# 24155196Listed by: Luxe Realty LLC $469,999Pending5 beds 3 baths1,700 sq. ft.
318 Center Street, Bridgeport, CT 06604
MLS# 24155154Listed by: eXp Realty $425,000Pending3 beds 1 baths1,429 sq. ft.
3432 Old Town Road, Bridgeport, CT 06606
MLS# 24153621Listed by: William Raveis Real Estate $605,000Active8 beds 3 baths5,489 sq. ft.
41-43 Washington Terrace, Bridgeport, CT 06604
MLS# 24154899Listed by: Century 21 Scala Group $1,550,000Active20 beds 6 baths6,762 sq. ft.
1220 Pembroke Street, Bridgeport, CT 06608
MLS# 24153589Listed by: BHGRE Gaetano Marra Homes $525,000Active4 beds 3 baths2,213 sq. ft.
700 Laurel Avenue, Bridgeport, CT 06604
MLS# 24154614Listed by: Alpha Capital Realty, LLC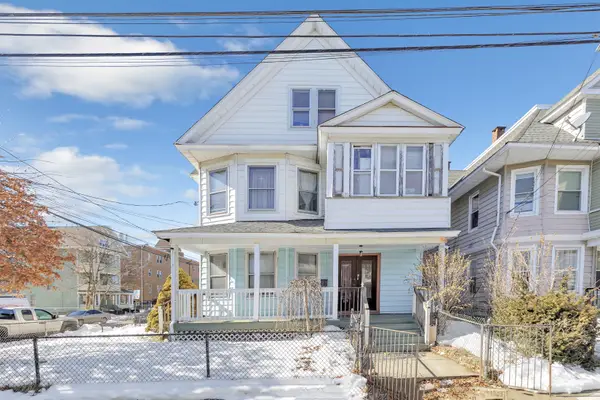 $580,000Pending6 beds 3 baths3,509 sq. ft.
619 Brooks Street, Bridgeport, CT 06608
MLS# 24154400Listed by: Century 21 Scala Group- Open Mon, 12 to 1pm
 $289,900Active2 beds 2 baths1,149 sq. ft.
769 Sylvan Avenue #13, Bridgeport, CT 06606
MLS# 24154304Listed by: Douglas Allen Real Estate 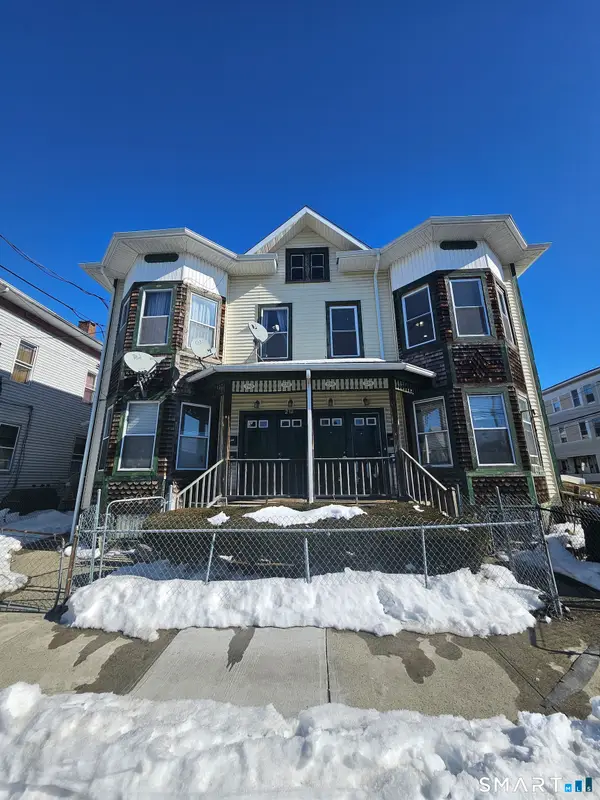 $229,899Active3 beds 1 baths1,000 sq. ft.
236 Brooks Street #236, Bridgeport, CT 06608
MLS# 24154372Listed by: HomeSmart Homes and Estates $555,000Pending4 beds 2 baths3,097 sq. ft.
274 Park Street, Bridgeport, CT 06608
MLS# 24154267Listed by: Century 21 Scala Group $1,000,000Active7 beds 5 baths7,715 sq. ft.
1365 East Main Street, Bridgeport, CT 06608
MLS# 24154080Listed by: J & S Realty Services, LLC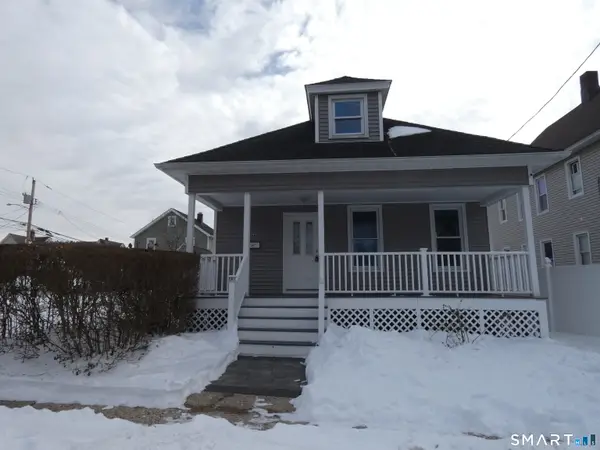 $219,000Pending2 beds 1 baths1,332 sq. ft.
46 York Street, Bridgeport, CT 06610
MLS# 24153947Listed by: Coldwell Banker Realty $230,000Active2 beds 2 baths1,648 sq. ft.
80 Cartright Street #Ph A, Bridgeport, CT 06604
MLS# 24153163Listed by: Higgins Group Real Estate $589,500Pending4 beds 2 baths1,855 sq. ft.
35 Querida Street, Bridgeport, CT 06604
MLS# 24153366Listed by: William Raveis Real Estate $345,000Active3 beds 2 baths1,565 sq. ft.
231 Deforest Avenue, Bridgeport, CT 06607
MLS# 24151604Listed by: William Raveis Real Estate $550,000Active3 beds 3 baths1,736 sq. ft.
1376 Chopsey Hill Road, Bridgeport, CT 06606
MLS# 24153376Listed by: William Raveis Real Estate $485,000Active3 beds 3 baths2,237 sq. ft.
211 Fox St, Bennett, CO 80102
MLS# 7059500Listed by: Novella Real Estate $775,000Pending5 beds 3 baths2,692 sq. ft.
148 Alfred Street, Bridgeport, CT 06605
MLS# 24152448Listed by: Coldwell Banker Realty $475,000Pending3 beds 1 baths1,312 sq. ft.
240 Valley Avenue, Bridgeport, CT 06606
MLS# 24152655Listed by: Century 21 Scala Group $329,900Pending3 beds 2 baths1,110 sq. ft.
30 Kent Avenue, Bridgeport, CT 06610
MLS# 24152502Listed by: Coldwell Banker Realty $765,000Active8 beds 3 baths3,938 sq. ft.
1440 Wood Avenue, Bridgeport, CT 06604
MLS# 24150787Listed by: Keller Williams Realty Prtnrs. $499,999Active4 beds 2 baths1,825 sq. ft.
3461 Main Street, Bridgeport, CT 06606
MLS# 24154979Listed by: Rosania Melo Broker $479,900Active3 beds 2 baths1,494 sq. ft.
123 Harlem Avenue, Bridgeport, CT 06606
MLS# 24151840Listed by: RE/MAX Right Choice $159,000Pending3 beds 2 baths1,460 sq. ft.
41 Hanover Street #41, Bridgeport, CT 06604
MLS# 24150840Listed by: The Rossignol Real Estate Grp $375,000Active4 beds 1 baths1,386 sq. ft.
110 Wilkins Avenue, Bridgeport, CT 06606
MLS# 24148920Listed by: New Roots Realty $519,000Pending7 beds 2 baths3,159 sq. ft.
137 Poplar Street, Bridgeport, CT 06605
MLS# 24149378Listed by: Dorrance Realty $132,500Pending1 beds 1 baths750 sq. ft.
78 Rowsley Street #4, Bridgeport, CT 06605
MLS# 24149363Listed by: William Pitt Sotheby's Int'l $424,900Pending4 beds 2 baths1,912 sq. ft.
248 Salem Street, Bridgeport, CT 06606
MLS# 24149563Listed by: Spadaccino Realty Team $205,000Active1 beds 2 baths837 sq. ft.
3370 Madison Avenue #10B, Bridgeport, CT 06606
MLS# 24149326Listed by: Coldwell Banker Realty $169,900Active2 beds 1 baths1,100 sq. ft.
60 Gilmore Street #21, Bridgeport, CT 06608
MLS# 24149475Listed by: Debek Real Estate Services LLC $429,900Pending3 beds 3 baths1,653 sq. ft.
92 Lincoln Avenue, Bridgeport, CT 06606
MLS# 24149461Listed by: RE/MAX Right Choice $249,900Pending1 beds 1 baths755 sq. ft.
27 Nash Lane #5, Bridgeport, CT 06605
MLS# 24148513Listed by: William Raveis Real Estate $950,000Active8 beds 4 baths2,830 sq. ft.
391 Coleman Street, Bridgeport, CT 06604
MLS# 24148902Listed by: US Asset Realty $1,200,000Active4 beds 3 baths1,406 sq. ft.
97 Fayerweather Terrace, Bridgeport, CT 06605
MLS# 24148858Listed by: Beycome of Connecticut $459,900Pending4 beds 1 baths1,189 sq. ft.
252 Bear Paw Road, Bridgeport, CT 06606
MLS# 24146728Listed by: RE/MAX Right Choice $810,000Pending12 beds 4 baths4,668 sq. ft.
108 Lindley Street, Bridgeport, CT 06606
MLS# 24148529Listed by: Top Tier Realty Group, LLC $95,000Pending2 beds 2 baths686 sq. ft.
272 Court D, Bld 54 Court, Bridgeport, CT 06610
MLS# 24148351Listed by: Global Real Estate Services, LLC $689,500Pending8 beds 3 baths3,423 sq. ft.
203 Wayne Street, Bridgeport, CT 06606
MLS# 24147641Listed by: William Raveis Real Estate $499,900Active4 beds 3 baths2,014 sq. ft.
316 Goldenrod Avenue, Bridgeport, CT 06606
MLS# 24143878Listed by: Property Choices Real Estate $520,000Active3 beds 2 baths2,030 sq. ft.
26 Marsdale Avenue, Bridgeport, CT 06606
MLS# 24146999Listed by: Century 21 AllPoints Realty $275,000Pending2 beds 1 baths999 sq. ft.
180 Read Street, Bridgeport, CT 06607
MLS# 24146462Listed by: Berkshire Hathaway NE Prop. $450,000Pending4 beds 3 baths1,170 sq. ft.
855 Burnsford Avenue, Bridgeport, CT 06606
MLS# 24146037Listed by: William Raveis Real Estate $644,000Pending6 beds 3 baths3,534 sq. ft.
26 Victory Street, Bridgeport, CT 06606
MLS# 24146325Listed by: Dorrance Realty $45,000Active2 beds 1 baths513 sq. ft.
340 Success Avenue #Building 89, Apt 11, Bridgeport, CT 06610
MLS# 24146248Listed by: TEJ Realty Group $725,000Active7 beds 3 baths2,387 sq. ft.
695 Shelton Street, Bridgeport, CT 06608
MLS# 24145125Listed by: Las Americas Real Estate
Local realty services provided by:CENTURY 21 Clemens Group, CENTURY 21 CapRock Real Estate
The data relating to real estate for sale on this website appears in part through the SMARTMLS Internet Data Exchange program, a voluntary cooperative exchange of property listing data between licensed real estate brokerage firms, and is provided by SMARTMLS through a licensing agreement. Listing information is from various brokers who participate in the SMARTMLS IDX program and not all listings may be visible on the site. The property information being provided on or through the website is for the personal, non-commercial use of consumers and such information may not be used for any purpose other than to identify prospective properties consumers may be interested in purchasing. Some properties which appear for sale on the website may no longer be available because they are for instance, under contract, sold or are no longer being offered for sale. Property information displayed is deemed reliable but is not guaranteed. Copyright 2026 SmartMLS, Inc.
The real estate listing information and related content displayed on this site is provided exclusively for consumer's personal, non-commercial use and may not be used for any purpose other than to identify prospective properties consumers may be interested in purchasing. This information and related content is deemed reliable but is not guaranteed accurate by Information and Real Estate Services, LLC.
Information source: Information and Real Estate Services, LLC. Provided for limited non-commercial use only under IRES Rules © Copyright IRES. The information being provided by Information and Real Estate Services is for the consumer's personal, non-commercial use and may not be used for any purpose other than to identify prospective properties consumer may be interested in purchasing. Any information relating to real estate for sale referenced on this web site comes from the Internet Data Exchange (IDX) program of the Information and Real Estate Services. This web site may reference real estate listing(s) held by a brokerage firm other than the broker and/or agent who owns this web site.
The accuracy of all information, regardless of source, including but not limited to open house information, square footages and lot sizes, is deemed reliable but not guaranteed and should be personally verified through personal inspection by and/or with the appropriate professionals. The data contained herein is copyrighted by Information and Real Estate Services and is protected by all applicable copyright laws. Any unauthorized dissemination of this information is in violation of copyright laws and is strictly prohibited.
Neighborhoods near Bridgeport, CT
Zip codes near Bridgeport, CT
- 06418 homes for sale
- 06460 homes for sale
- 06461 homes for sale
- 06477 homes for sale
- 06484 homes for sale
- 06604 homes for sale
- 06605 homes for sale
- 06606 homes for sale
- 06607 homes for sale
- 06608 homes for sale
- 06610 homes for sale
- 06611 homes for sale
- 06612 homes for sale
- 06614 homes for sale
- 06615 homes for sale
- 06824 homes for sale
- 06825 homes for sale
- 06880 homes for sale
- 06883 homes for sale
- 06890 homes for sale
Popular searches near Bridgeport, CT
- Bridgeport homes for sale
- Daniels Farm homes for sale
- Fairfield homes for sale
- Fairfield homes for sale
- Long Hill homes for sale
- Lordship homes for sale
- Milford homes for sale
- Milford homes for sale
- Milford city (balance) homes for sale
- Oronoque homes for sale
- Plattsville homes for sale
- Southport homes for sale
- Southport homes for sale
- Stratford homes for sale
- Stratford homes for sale
- Stratford Downtown homes for sale
- Tashua homes for sale
- Trumbull homes for sale
- Trumbull homes for sale
- Trumbull Center homes for sale
Protect your home and budget from life's surprises with an Assurant Home Warranty, backed by a partner that supports you through every step of homeownership. Explore Plans.
©2026 Century 21 Real Estate LLC. All rights reserved. CENTURY 21®, the CENTURY 21 Logo and C21® are service marks owned by Century 21 Real Estate LLC. Century 21 Real Estate LLC fully supports the principles of the Fair Housing Act and the Equal Opportunity Act. Each office is independently owned and operated. Listing information is deemed reliable but not guaranteed accurate.