- Big Sky, Lake In The Hills homes for sale
- Cambridge Lakes, Pingree Grove homes for sale
- Cobblers Crossing, Elgin homes for sale
- Coventry, Crystal Lake homes for sale
- Del Webb's Sun City, Huntley homes for sale
- Dundee, Carpentersville homes for sale
- Forest Ridge, Streamwood homes for sale
- Four Colonies, Crystal Lake homes for sale
- Fox River Valley Gardens, Port Barrington homes for sale
- Greenfields, Cary homes for sale
- High Hill Farms, Algonquin homes for sale
- Lake in the Hills Estates, Lake In The Hills homes for sale
- Meadowbrook, Lake In The Hills homes for sale
- Oak Knoll Farms, Streamwood homes for sale
- Park Place, Crystal Lake homes for sale
- Providence, Elgin homes for sale
- Spring Lake Farms, Lake In The Hills homes for sale
- Talamore, Huntley homes for sale
- Turnberry, Lakewood homes for sale
- Wing Pointe, Huntley homes for sale
Carpentersville, IL - homes for sale
63 of 63 results displayed
- New
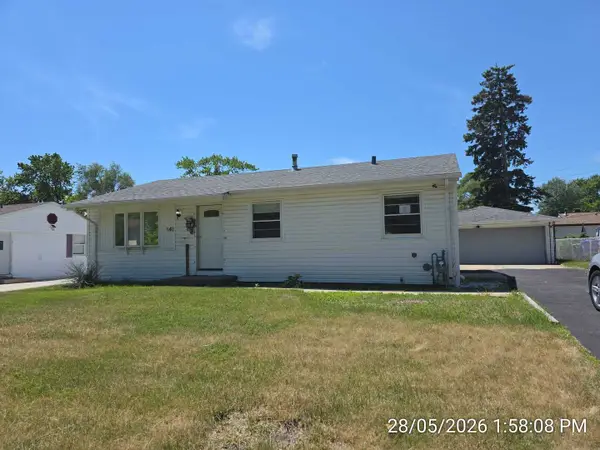 $187,500Active3 beds 2 baths
148 Pecos Circle, Carpentersville, IL 60110
MLS# 12670486Listed by: BROKEROCITY INC
- New
 $113,604Active0.4 Acres
Lot 11 Oak Ridge Road, Carpentersville, IL 60110
MLS# 12666560Listed by: COMPASS - New
 $113,604Active0.4 Acres
Lot 12 Oak Ridge Road, Carpentersville, IL 60110
MLS# 12666586Listed by: COMPASS - New
 $113,604Active0.4 Acres
Lot 13 Oak Ridge Road, Carpentersville, IL 60110
MLS# 12666707Listed by: COMPASS - New
 $113,604Active0.4 Acres
Lot 14 Oak Ridge Road, Carpentersville, IL 60110
MLS# 12666723Listed by: COMPASS - New
 $295,372Active1.4 Acres
Lot 15 Oak Ridge Road, Carpentersville, IL 60110
MLS# 12666745Listed by: COMPASS - New
 $38,115Active0.24 Acres
Lot 16 Ravine Lane, Carpentersville, IL 60110
MLS# 12666219Listed by: COMPASS - New
 $38,115Active0.25 Acres
Lot 15 Route 25, Carpentersville, IL 60110
MLS# 12666487Listed by: COMPASS - New
 $38,115Active0.25 Acres
Lot 14 Route 25, Carpentersville, IL 60110
MLS# 12666500Listed by: COMPASS - New
 $38,115Active0.25 Acres
Lot 13 Route 25, Carpentersville, IL 60110
MLS# 12666514Listed by: COMPASS - New
 $36,590Active0.25 Acres
Lot 12 Route 25, Carpentersville, IL 60110
MLS# 12666521Listed by: COMPASS - New
 $335,410Active3.08 Acres
Lot 21 Route 31, Carpentersville, IL 60110
MLS# 12666852Listed by: COMPASS 
 $409,900Pending3 beds 3 baths2,225 sq. ft.
5718 Breezeland Road, Carpentersville, IL 60110
MLS# 12669003Listed by: CENTURY 21 NEW HERITAGE $275,000Pending2 beds 2 baths1,256 sq. ft.
2010 Orchard Lane, Carpentersville, IL 60110
MLS# 12613615Listed by: BAIRD & WARNER REAL ESTATE - ALGONQUIN- New
 $269,900Active3 beds 1 baths1,000 sq. ft.
533 Gentle Breeze Terrace, Carpentersville, IL 60110
MLS# 12667681Listed by: SIGNATURE REALTY GROUP LLC - New
 $265,000Active2 beds 2 baths1,096 sq. ft.
2231 Flagstone Lane, Carpentersville, IL 60110
MLS# 12667950Listed by: BROKEROCITY - New
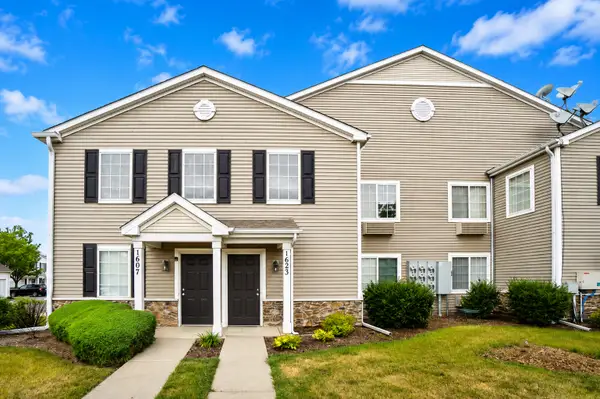 $250,000Active2 beds 2 baths1,150 sq. ft.
1623 Silverstone Drive #1623, Carpentersville, IL 60110
MLS# 12663481Listed by: COLDWELL BANKER REALTY  $350,000Pending3 beds 2 baths1,579 sq. ft.
315 E 1st Street, East Dundee, IL 60118
MLS# 12663827Listed by: RE/MAX PLAZA $219,900Pending3 beds 2 baths2,088 sq. ft.
18 Birch Street, Carpentersville, IL 60110
MLS# 12665072Listed by: NEW MARKET REALTY INC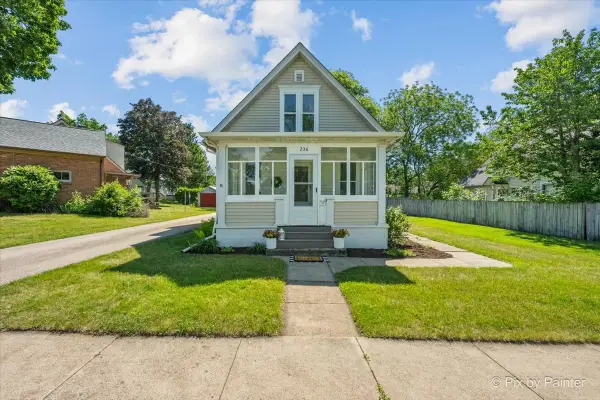 $325,000Pending2 beds 1 baths1,501 sq. ft.
236 Short Street, East Dundee, IL 60118
MLS# 12662236Listed by: KELLER WILLIAMS SUCCESS REALTY $325,000Pending3 beds 3 baths1,550 sq. ft.
6566 Marble Lane, Carpentersville, IL 60110
MLS# 12648595Listed by: COLDWELL BANKER REALTY $399,000Pending3 beds 3 baths2,934 sq. ft.
1646 Gleneagle Drive, Carpentersville, IL 60110
MLS# 12659621Listed by: COLDWELL BANKER REALTY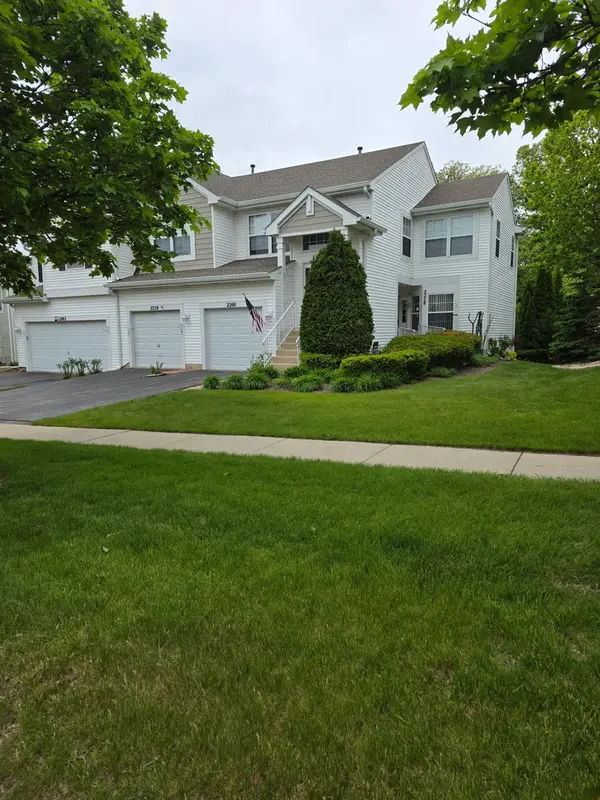 $289,000Active2 beds 2 baths1,600 sq. ft.
2260 Woodside Drive, Carpentersville, IL 60110
MLS# 12654709Listed by: CHARLES RUTENBERG REALTY OF IL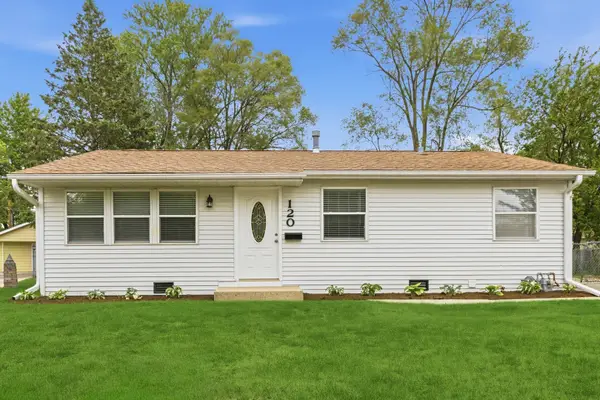 $269,000Pending3 beds 1 baths975 sq. ft.
120 Adobe Circle, Carpentersville, IL 60110
MLS# 12656728Listed by: GRID 7 PROPERTIES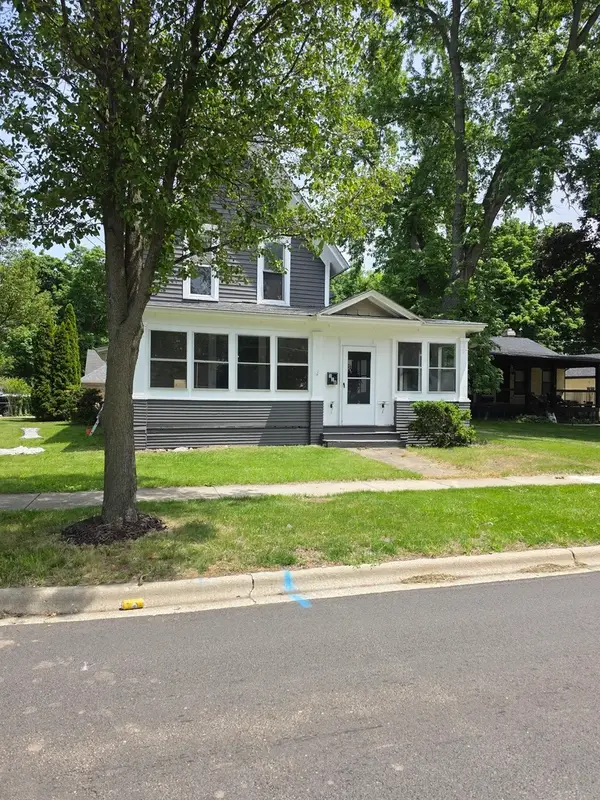 $345,000Active3 beds 2 baths1,702 sq. ft.
118 N Washington Street, Carpentersville, IL 60110
MLS# 12625772Listed by: RE/MAX HORIZON $300,000Pending3 beds 3 baths1,760 sq. ft.
414 Spring Court W, Carpentersville, IL 60110
MLS# 12647924Listed by: ONLINE BROKERS INC. $375,000Pending5 beds 3 baths2,832 sq. ft.
137 Birchwood Road, Carpentersville, IL 60110
MLS# 12627756Listed by: RE/MAX LIBERTY $365,000Active3 beds 2 baths1,700 sq. ft.
1008 Adams Court, Carpentersville, IL 60110
MLS# 12646306Listed by: HOME REALTY GROUP, INC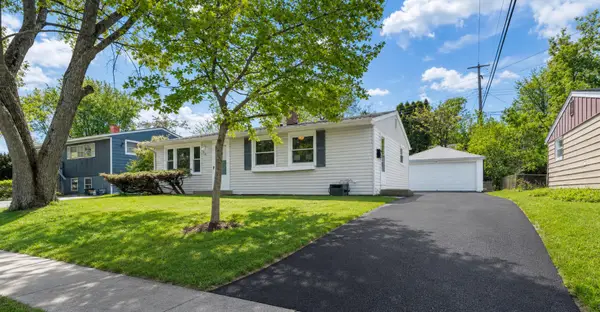 $317,900Pending3 beds 2 baths1,335 sq. ft.
502 Tyler Drive, Carpentersville, IL 60110
MLS# 12645017Listed by: HOME SELLERS REALTY INC.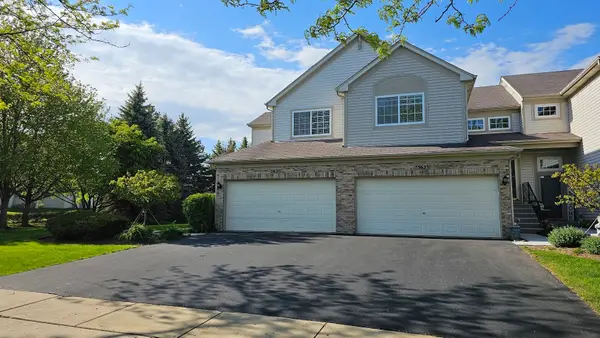 $312,500Pending3 beds 2 baths1,501 sq. ft.
3623 Roanoke Avenue, Carpentersville, IL 60110
MLS# 12642203Listed by: HOMESMART CONNECT LLC $300,000Pending2 beds 2 baths1,348 sq. ft.
3414 Blue Ridge Drive, Carpentersville, IL 60110
MLS# 12626982Listed by: BAIRD & WARNER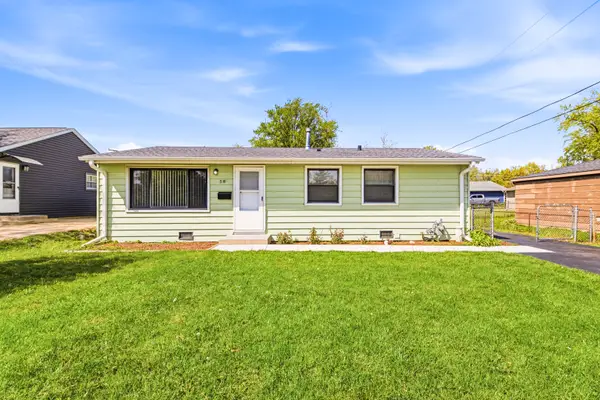 $279,900Pending3 beds 1 baths975 sq. ft.
58 Golfview Lane, Carpentersville, IL 60110
MLS# 12637722Listed by: GRID 7 PROPERTIES $339,000Pending3 beds 2 baths1,600 sq. ft.
152 Skyline Drive, Carpentersville, IL 60110
MLS# 12636237Listed by: COLDWELL BANKER REALTY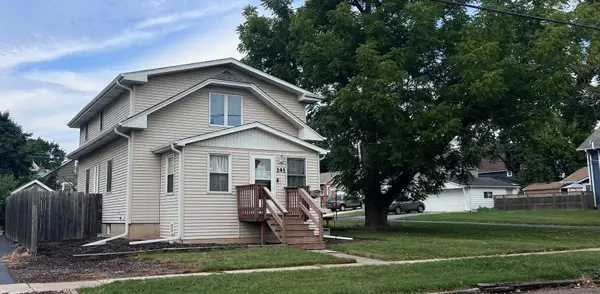 $345,000Pending5 beds 3 baths1,750 sq. ft.
141 N Lord Avenue, Carpentersville, IL 60110
MLS# 12634170Listed by: FIVE STAR REALTY, INC $420,000Pending4 beds 3 baths2,020 sq. ft.
1310 York Drive, Carpentersville, IL 60110
MLS# 12630133Listed by: EPIQUE REALTY INC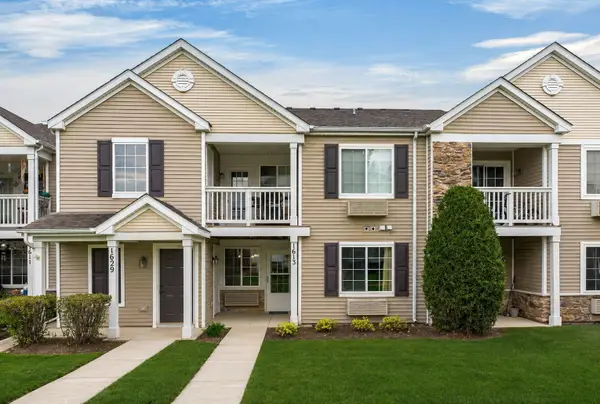 $198,000Pending1 beds 1 baths730 sq. ft.
1613 Silverstone Drive #1613, Carpentersville, IL 60110
MLS# 12630101Listed by: COMPASS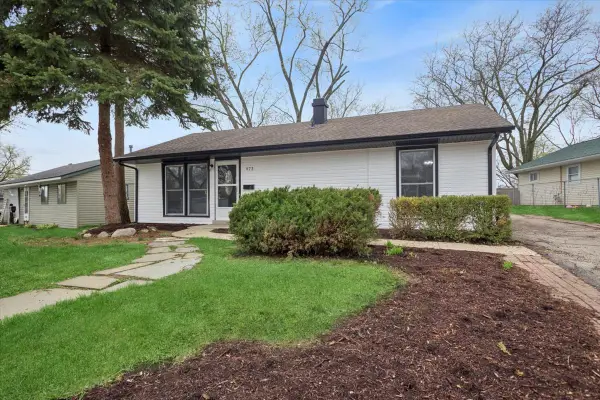 $314,999Pending3 beds 1 baths
972 Osage Court, Carpentersville, IL 60110
MLS# 12628352Listed by: BAIRD & WARNER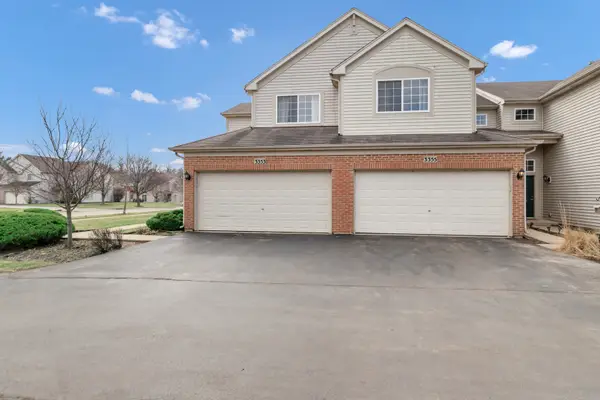 $315,000Pending3 beds 2 baths1,501 sq. ft.
3355 Blue Ridge Drive, Carpentersville, IL 60110
MLS# 12627644Listed by: LEGACY PROPERTIES, A SARAH LEONARD COMPANY, LLC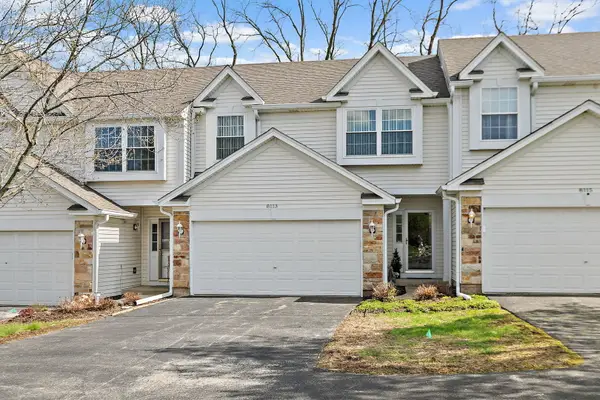 $300,000Pending2 beds 2 baths1,750 sq. ft.
8113 Sierra Woods Lane, Carpentersville, IL 60110
MLS# 12627795Listed by: BROKEROCITY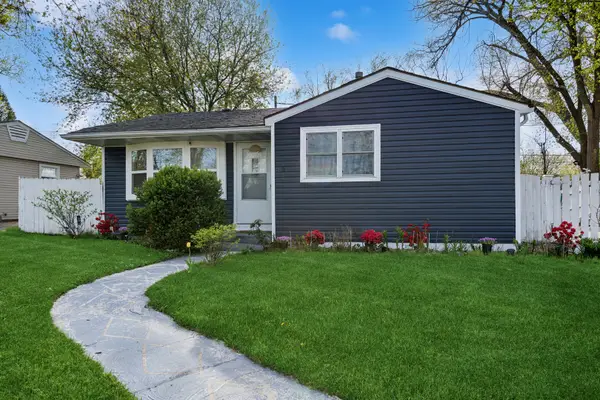 $290,000Pending3 beds 1 baths1,000 sq. ft.
80 Birch Street, Carpentersville, IL 60110
MLS# 12622959Listed by: BAIRD & WARNER REAL ESTATE - ALGONQUIN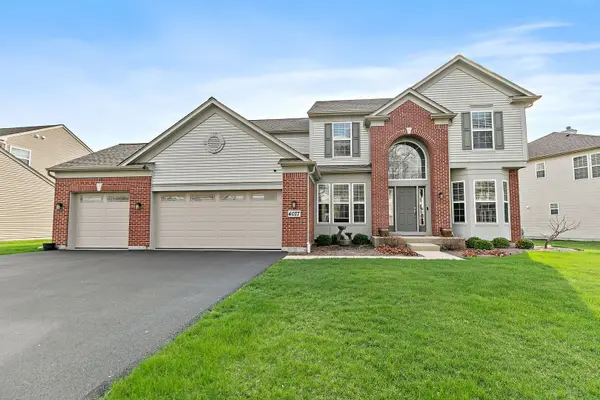 $510,000Pending4 beds 3 baths2,600 sq. ft.
4077 Stratford Lane, Carpentersville, IL 60110
MLS# 12621981Listed by: BROKEROCITY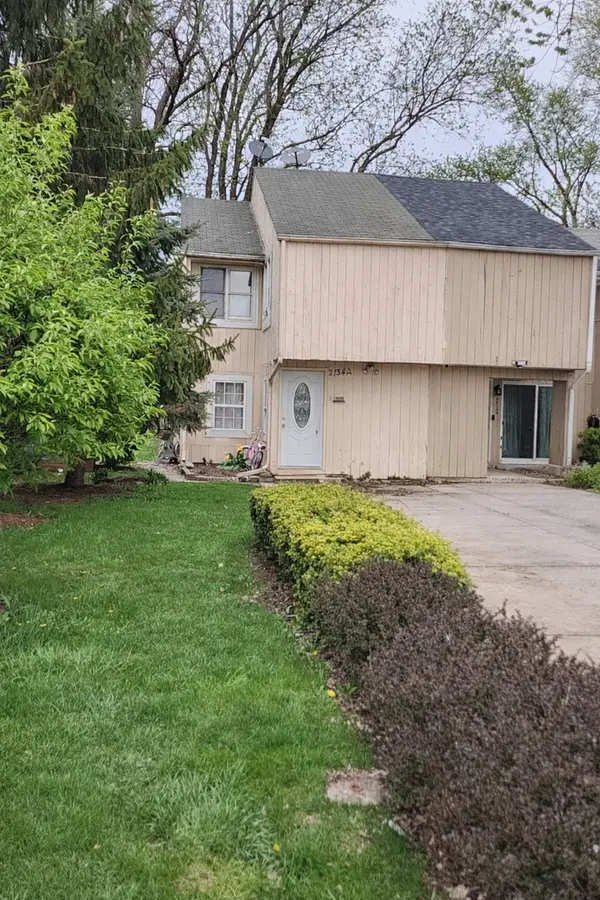 $205,000Pending3 beds 1 baths
2134 Morningside Lane #A, Carpentersville, IL 60110
MLS# 12622366Listed by: LUNA REAL ESTATE INC.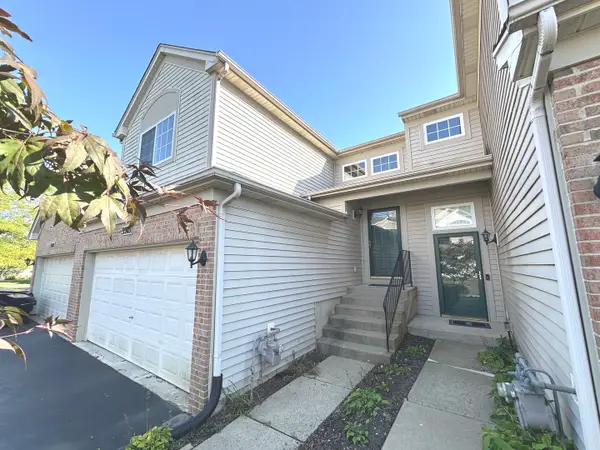 $289,900Active2 beds 1 baths1,501 sq. ft.
3503 Blue Ridge Court #3503, Carpentersville, IL 60110
MLS# 12622701Listed by: HOMESMART CONNECT LLC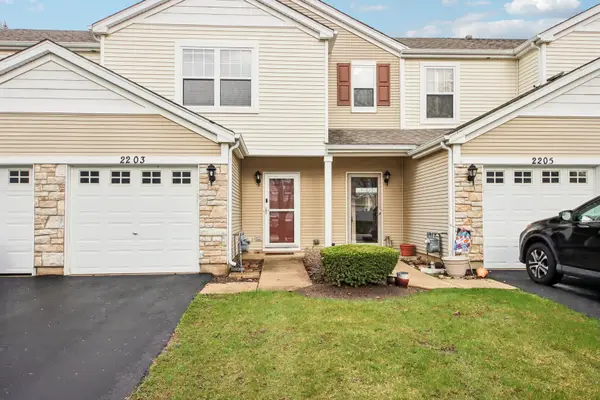 $250,000Pending2 beds 2 baths1,148 sq. ft.
2203 Flagstone Lane #2203, Carpentersville, IL 60110
MLS# 12588323Listed by: REDFIN CORPORATION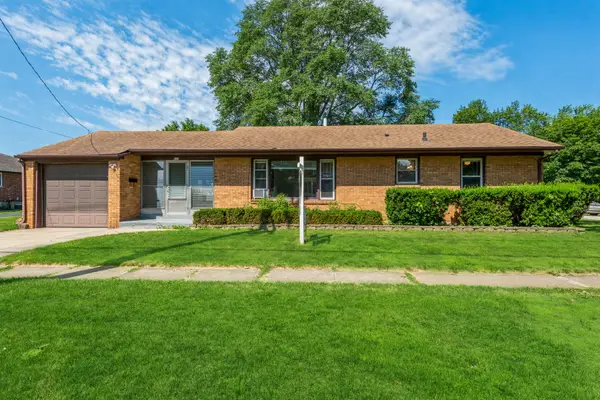 $400,000Active4 beds 2 baths1,000 sq. ft.
319 N Lord Avenue, Carpentersville, IL 60110
MLS# 12620168Listed by: BERKSHIRE HATHAWAY HOMESERVICES STARCK REAL ESTATE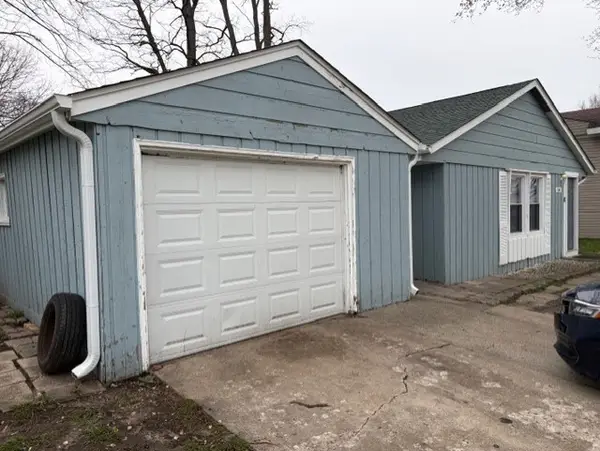 $279,000Active3 beds 1 baths960 sq. ft.
100 Hickory Drive, Carpentersville, IL 60110
MLS# 12618279Listed by: VYLLA HOME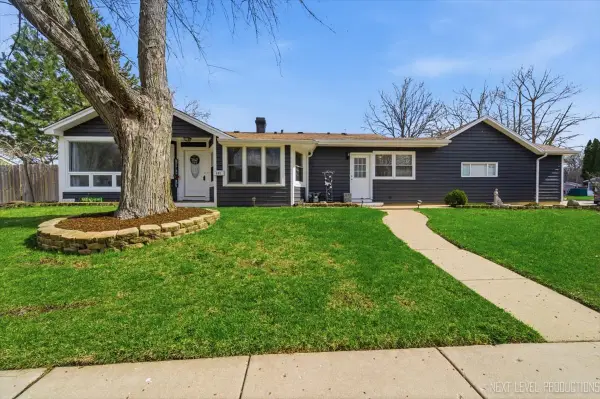 $335,000Pending5 beds 2 baths1,523 sq. ft.
101 Hickory Drive, Carpentersville, IL 60110
MLS# 12611234Listed by: HOMESMART CONNECT LLC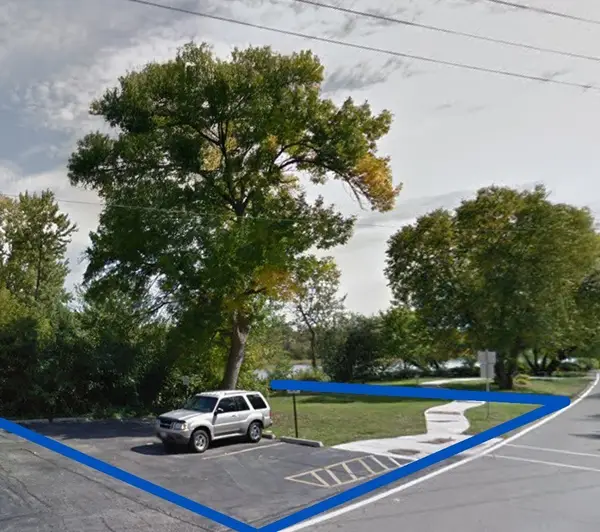 $5,900Active0.2 Acres
1 S Lincoln Avenue, Carpentersville, IL 60110
MLS# 12613927Listed by: EXP REALTY - CHICAGO NORTH AVE $180,000Active0 Acres
LOT 19 & LOT 18 Williams Road, Lake Marian, IL 60110
MLS# 12604188Listed by: UNIVERSAL REAL ESTATE LLC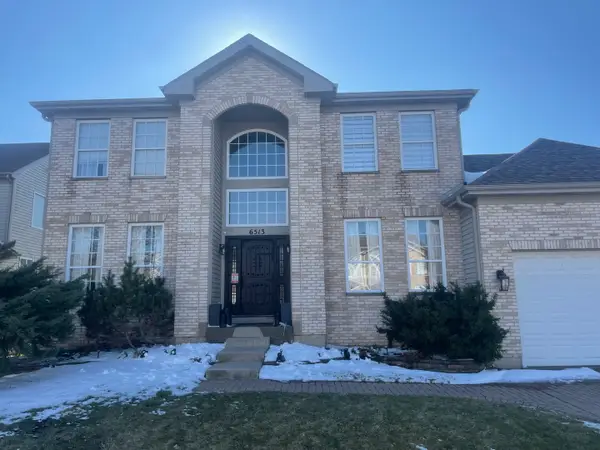 $469,000Pending4 beds 3 baths2,450 sq. ft.
6513 Pine Hollow Road, Carpentersville, IL 60110
MLS# 12604388Listed by: ARC RED INC ARC REALTY GROUP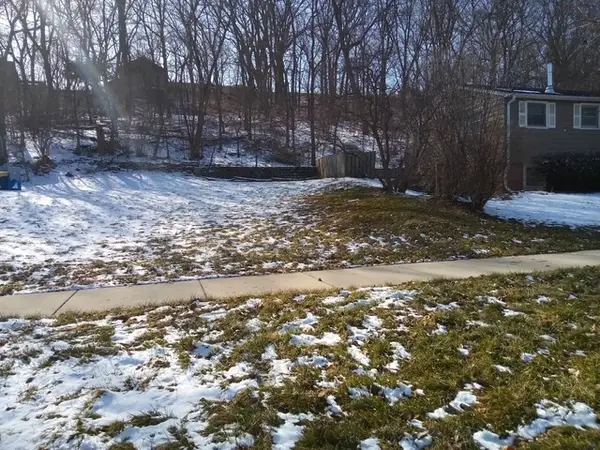 $52,000Active0.26 Acres
19 N Lincoln Avenue, Carpentersville, IL 60110
MLS# 12598869Listed by: CHARLES RUTENBERG REALTY OF IL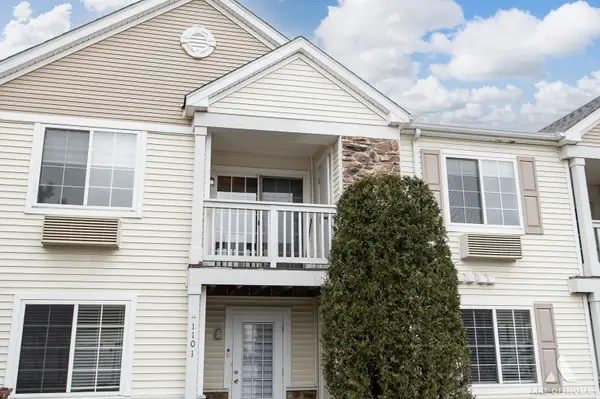 $238,000Pending2 beds 2 baths1,050 sq. ft.
1117 Silverstone Drive #1117, Carpentersville, IL 60110
MLS# 12573899Listed by: VILLAGE REALTY, INC. $257,900Active3 beds 1 baths950 sq. ft.
28 Hickory Drive, Carpentersville, IL 60110
MLS# 12589161Listed by: ARNI REALTY INCORPORATED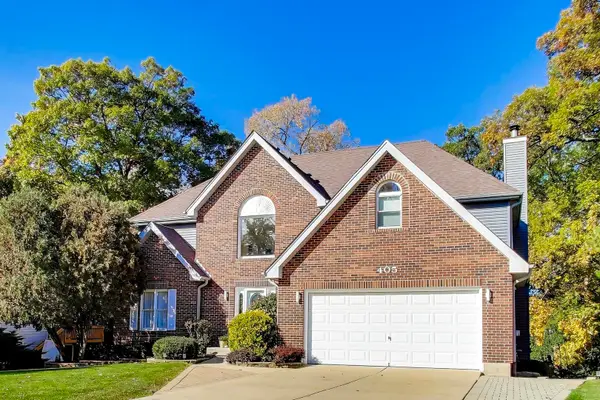 $589,900Active5 beds 4 baths3,000 sq. ft.
405 Windham Trail, Carpentersville, IL 60110
MLS# 12571259Listed by: AVERTA REALTY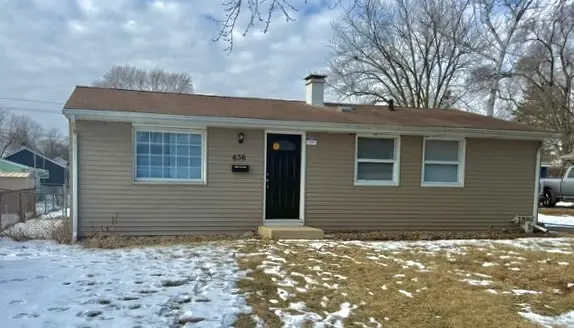 $302,000Active3 beds 1 baths975 sq. ft.
636 Jefferson Avenue, Carpentersville, IL 60110
MLS# 12563471Listed by: EXP REALTY $65,000Active0.34 Acres
Lot 8 Elmwood Drive, Carpentersville, IL 60110
MLS# 12494347Listed by: COMPASS $50,000Active0.44 Acres
Lot 5-7 Cottage Avenue, Carpentersville, IL 60110
MLS# 12494397Listed by: COMPASS $95,000Active0 Acres
1033 Rosewood Drive, Carpentersville, IL 60110
MLS# 12387146Listed by: WORTH CLARK REALTY $550,000Active2.41 Acres
lot 009 Huntley Road, Carpentersville, IL 60110
MLS# 12382863Listed by: KELLER WILLIAMS INSPIRE - GENEVA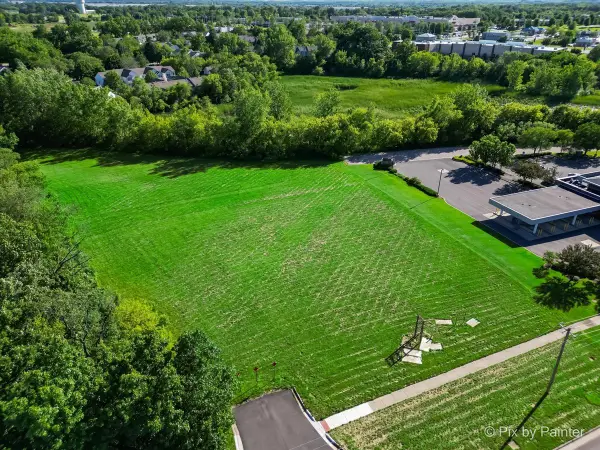 $550,000Pending2.38 Acres
6850 Huntley Road, Carpentersville, IL 60110
MLS# 12382859Listed by: KELLER WILLIAMS INSPIRE - GENEVA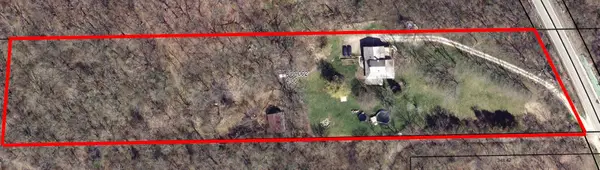 $1,250,000Active3 beds 3 baths1,794 sq. ft.
Address Withheld By Seller, Dundee, IL 60118
MLS# 11409573Listed by: CHICAGOLAND BROKERS INC. $750,000Active3 beds 3 baths2,650 sq. ft.
17N448 Il Route 31, Dundee, IL 60110
MLS# 11409575Listed by: CHICAGOLAND BROKERS INC. $2,500,000Active13.54 Acres
Route 31 Route, Carpentersville, IL 60110
MLS# 11415103Listed by: CHICAGOLAND BROKERS INC.
Local realty services provided by:CENTURY 21 Broughton Team
Copyright 2026 Midwest Real Estate Data LLC. All rights reserved. The data relating to real estate for sale on this web site comes in part from the Broker Reciprocity Program of the Midwest Real Estate Data LLC. Listing information is deemed reliable but not guaranteed. MLSNI Member Broker: Barbara K. Broughton
Neighborhoods near Carpentersville, IL
Zip codes near Carpentersville, IL
- 60010 homes for sale
- 60012 homes for sale
- 60013 homes for sale
- 60014 homes for sale
- 60021 homes for sale
- 60102 homes for sale
- 60107 homes for sale
- 60110 homes for sale
- 60118 homes for sale
- 60120 homes for sale
- 60123 homes for sale
- 60124 homes for sale
- 60136 homes for sale
- 60140 homes for sale
- 60142 homes for sale
- 60156 homes for sale
- 60169 homes for sale
- 60177 homes for sale
- 60192 homes for sale
- 60195 homes for sale
Popular searches near Carpentersville, IL
- Algonquin homes for sale
- Algonquin Township homes for sale
- Barrington Township homes for sale
- Barrington Hills homes for sale
- Cary homes for sale
- Crystal Lake homes for sale
- Dundee homes for sale
- East Dundee homes for sale
- Elgin homes for sale
- Fox River Grove homes for sale
- Gilberts homes for sale
- Grafton Township homes for sale
- Huntley homes for sale
- Lake In The Hills homes for sale
- Lakewood homes for sale
- Pingree Grove homes for sale
- Plato homes for sale
- Rutland homes for sale
- Sleepy Hollow homes for sale
- West Dundee homes for sale
Protect your home and budget from life's surprises with an Assurant Home Warranty, backed by a partner that supports you through every step of homeownership. Explore Plans.
©2026 Century 21 Real Estate LLC. All rights reserved. CENTURY 21®, the CENTURY 21 Logo and C21® are service marks owned by Century 21 Real Estate LLC. Century 21 Real Estate LLC fully supports the principles of the Fair Housing Act and the Equal Opportunity Act. Each office is independently owned and operated. Listing information is deemed reliable but not guaranteed accurate.