- Armour Square, Chicago homes for sale
- Bridgeport, Chicago homes for sale
- Brighton Park, Chicago homes for sale
- Bronzeville, Chicago homes for sale
- Canaryville, Chicago homes for sale
- Chinatown, Chicago homes for sale
- Dearborn Park, Chicago homes for sale
- Douglas, Chicago homes for sale
- East Pilsen, Chicago homes for sale
- Fuller Park, Chicago homes for sale
- Grand Boulevard, Chicago homes for sale
- Little Italy, Chicago homes for sale
- Little Village, Chicago homes for sale
- Lower West Side, Chicago homes for sale
- McKinley Park, Chicago homes for sale
- Near South Side, Chicago homes for sale
- New City, Chicago homes for sale
- North Lawndale, Chicago homes for sale
- River South, Chicago homes for sale
- South Commons, Chicago homes for sale
Chicago, IL - homes for sale
300 of 8,569 results displayed
- New
 $194,900Active2 beds 1 baths
6758 W 64th Place #23, Chicago, IL 60638
MLS# 12579179Listed by: INFINITI PROPERTIES, INC.
- New
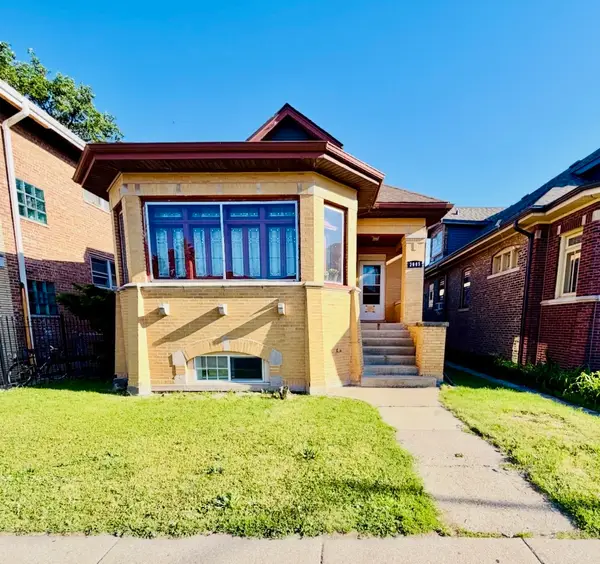
 $370,000Active5 beds 3 baths
184 N Leamington Avenue, Chicago, IL 60644
MLS# 12671100Listed by: BAIRD & WARNER - Open Sat, 12 to 2pmNew
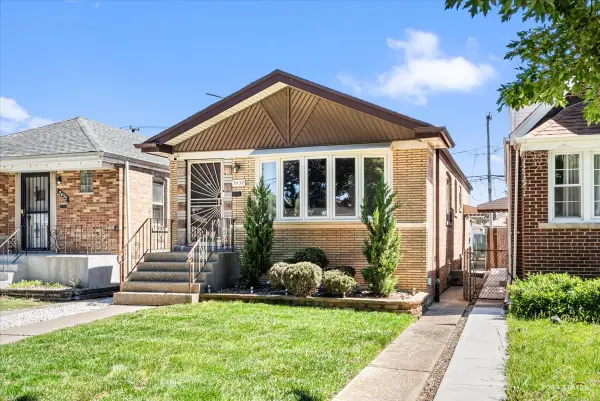
 $309,000Active5 beds 2 baths2,400 sq. ft.
2481 E 74th Street, Chicago, IL 60649
MLS# 12664948Listed by: FULTON GRACE REALTY - New
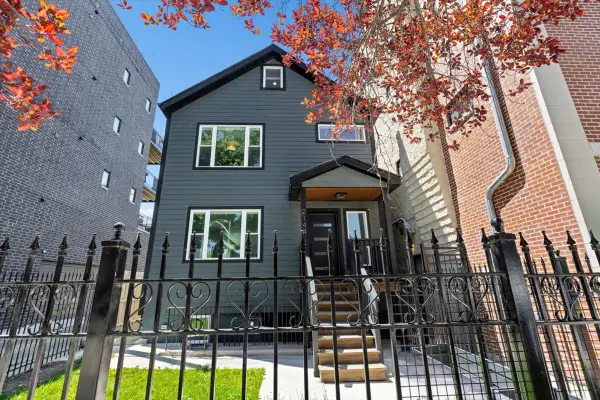
 $650,000Active3 beds 2 baths1,675 sq. ft.
2701 W Fitch Avenue, Chicago, IL 60645
MLS# 12652613Listed by: JAMESON SOTHEBY'S INTERNATIONAL REALTY - New
 $540,000Active4 beds 3 baths
4727 W Schubert Avenue, Chicago, IL 60639
MLS# 12669564Listed by: KELLER WILLIAMS EXPERIENCE - New
 $190,000Active2 beds 1 baths988 sq. ft.
11548 S Normal Avenue, Chicago, IL 60628
MLS# 12670709Listed by: REALTY OF AMERICA, LLC - New
 $1,399,000Active4 beds 3 baths2,400 sq. ft.
1826 W Farragut Avenue, Chicago, IL 60640
MLS# 12670789Listed by: 4 SALE REALTY ADVANTAGE LLC - New
 $164,900Active2 beds 1 baths1,125 sq. ft.
827 E 48th Street #C, Chicago, IL 60615
MLS# 12670926Listed by: CAROL A. HOLLAND - New

 $325,000Active3 beds 2 baths1,193 sq. ft.
11600 S Hale Avenue, Chicago, IL 60643
MLS# 12670962Listed by: CENTURY 21 CIRCLE - New
 $695,000Active19 beds 7 baths
6244 S Langley Avenue, Chicago, IL 60637
MLS# 12670968Listed by: ROMAN PROPERTIES, LLC. - Open Sun, 1 to 3pmNew
 $355,000Active8 beds 2 baths1,500 sq. ft.
6455 S California Avenue, Chicago, IL 60629
MLS# 12670969Listed by: CLOUD GATE REALTY LLC - New
 $524,900Active3 beds 3 baths
5552 N Major Avenue, Chicago, IL 60630
MLS# 12671001Listed by: HOMESMART CONNECT LLC - New
 $594,999Active3 beds 3 baths
5037 W Winona Street, Chicago, IL 60630
MLS# 12649714Listed by: OPTION PREMIER LLC - New
 $640,000Active7 beds 5 baths
915 S Kedzie Avenue, Chicago, IL 60612
MLS# 12656969Listed by: REALTY OF AMERICA, LLC - New
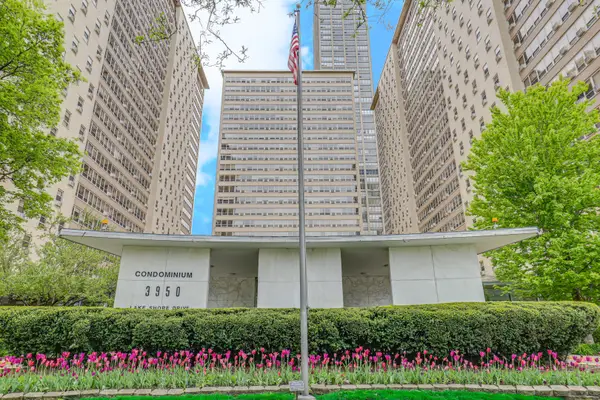 $289,900Active2 beds 1 baths1,000 sq. ft.
3950 N Lake Shore Drive #1100A, Chicago, IL 60613
MLS# 12658548Listed by: AMERICAN INTERNATIONAL REALTY - New
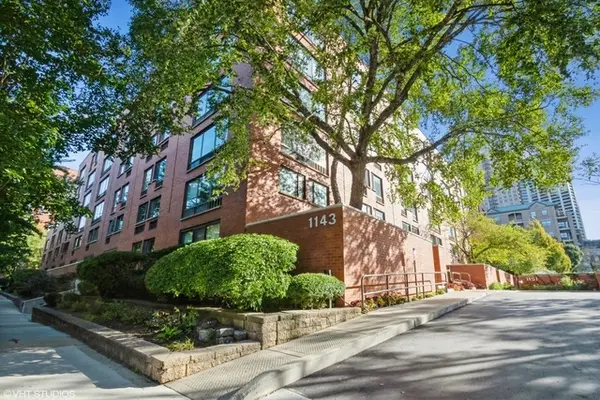 $299,000Active2 beds 3 baths1,250 sq. ft.
1143 S Plymouth Court #106, Chicago, IL 60605
MLS# 12664344Listed by: BERKSHIRE HATHAWAY HOMESERVICES CHICAGO - New
 $539,900Active2 beds 2 baths
2525 N Sheffield Avenue #2C, Chicago, IL 60614
MLS# 12670822Listed by: COLDWELL BANKER STRATFORD PLACE - New
 $620,000Active4 beds 3 baths2,100 sq. ft.
6017 S Monitor Avenue, Chicago, IL 60638
MLS# 12670858Listed by: PAK HOME REALTY  $4,300,000Pending3 beds 4 baths4,000 sq. ft.
11 E Walton Street #3902, Chicago, IL 60611
MLS# 12670867Listed by: @PROPERTIES CHRISTIE'S INTERNATIONAL REAL ESTATE- New
 $134,900Active1 beds 1 baths
2315 W Rosemont Avenue #G, Chicago, IL 60659
MLS# 12670324Listed by: EXIT STRATEGY REALTY / EMA MANAGEMENT - New
 $386,000Active8 beds 3 baths
912 W 95th Street, Chicago, IL 60643
MLS# 12656778Listed by: MBH REALTY GROUP LLC - New
 $330,000Active1 beds 1 baths1,030 sq. ft.
Address Withheld By Seller, Chicago, IL 60606
MLS# 12660862Listed by: @PROPERTIES CHRISTIE'S INTERNATIONAL REAL ESTATE - New
 $849,000Active6 beds 3 baths
1419 W Lexington Street, Chicago, IL 60607
MLS# 12668576Listed by: C. GALLUCCI REALTY, INC. - New
 $199,900Active1 beds 1 baths
3135 W Leland Avenue #2E, Chicago, IL 60625
MLS# 12670738Listed by: HOMESMART CONNECT LLC - Open Mon, 4 to 6pmNew
 $700,000Active3 beds 2 baths
1516 N Mohawk Street #3F, Chicago, IL 60610
MLS# 12670213Listed by: JAMESON SOTHEBY'S INTL REALTY - New
 $1,090,000Active7 beds 4 baths
2925 N Damen Avenue, Chicago, IL 60618
MLS# 12670734Listed by: @PROPERTIES CHRISTIE'S INTERNATIONAL REAL ESTATE - Open Wed, 4:30 to 6:30pmNew
 $750,000Active5 beds 4 baths3,603 sq. ft.
6730 W Dakin Street, Chicago, IL 60634
MLS# 12670740Listed by: @PROPERTIES CHRISTIE'S INTERNATIONAL REAL ESTATE - New
 $249,900Active4 beds 2 baths1,800 sq. ft.
1506 W 109th Place, Chicago, IL 60643
MLS# 12375006Listed by: EVERBRIGHT ENTERPRISE INC. - New
 $199,900Active3 beds 2 baths1,600 sq. ft.
7935 S Blackstone Avenue, Chicago, IL 60619
MLS# 12670684Listed by: CENTURY 21 CIRCLE - AURORA - New
 $755,000Active6 beds 3 baths
4055 W Nelson Street, Chicago, IL 60641
MLS# 12670691Listed by: CHICAGOLAND BROKERS, INC. - New
 $122,999Active3 beds 2 baths1,240 sq. ft.
501 W 60th Place #3, Chicago, IL 60621
MLS# 12617079Listed by: REAL PEOPLE REALTY - New
 $449,900Active4 beds 2 baths
4435 S Artesian Avenue, Chicago, IL 60632
MLS# 12635847Listed by: MUV REAL ESTATE - New
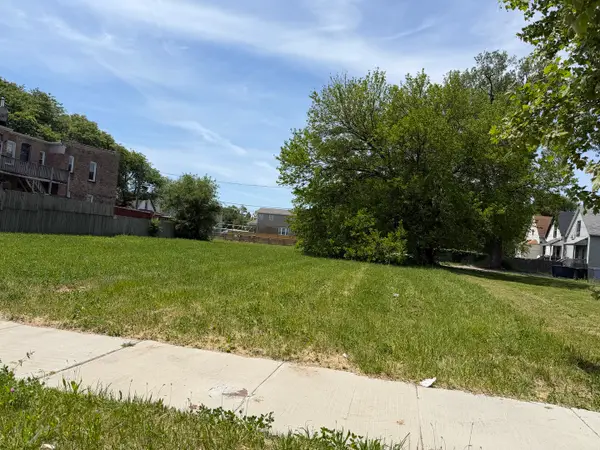
 $35,000Active0 Acres
4023 W 16th Street, Chicago, IL 60623
MLS# 12637141Listed by: HOUSE OF REAL ESTATE - New
 $255,000Active3 beds 2 baths990 sq. ft.
6457 S Long Avenue #6457, Chicago, IL 60638
MLS# 12646541Listed by: AMERICAN LAND REALTY, LTD. - New
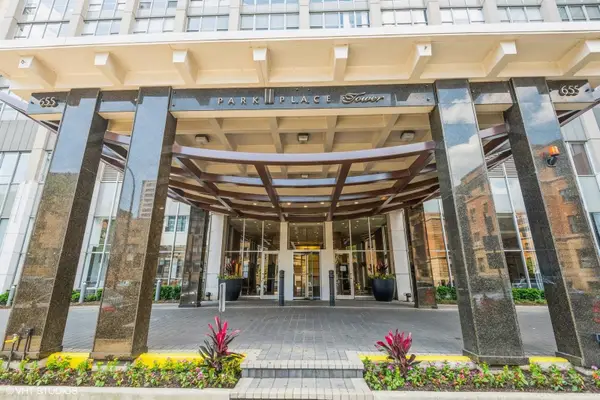 $249,000Active1 beds 1 baths840 sq. ft.
655 W Irving Park Road #4812, Chicago, IL 60613
MLS# 12661601Listed by: @PROPERTIES CHRISTIE'S INTERNATIONAL REAL ESTATE - Open Sat, 1 to 3pmNew
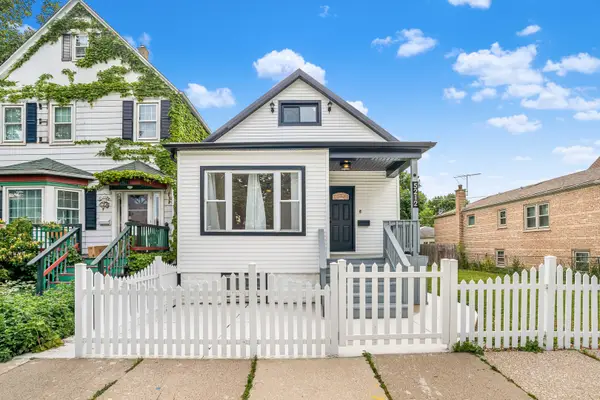 $399,999Active3 beds 2 baths1,218 sq. ft.
5212 S Kildare Avenue, Chicago, IL 60632
MLS# 12667883Listed by: AMERICAN LAND REALTY, LTD. - New
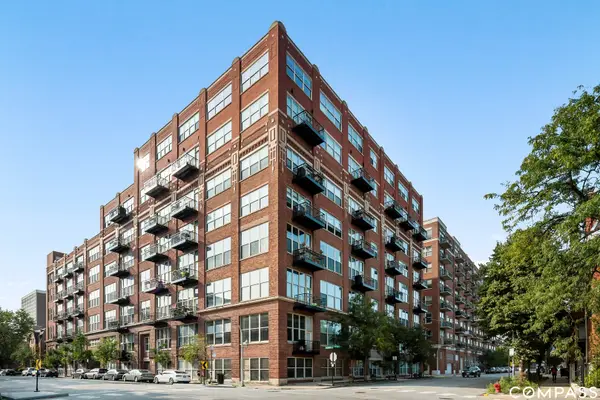 $420,900Active2 beds 2 baths1,300 sq. ft.
1500 W Monroe Street #623, Chicago, IL 60607
MLS# 12668107Listed by: COMPASS - New
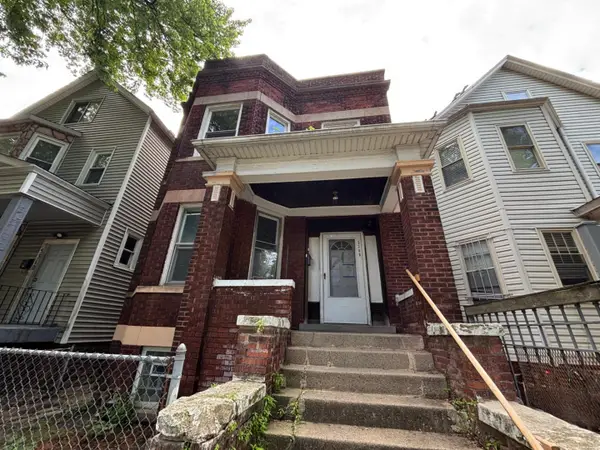 $145,000Active4 beds 2 baths
5308 S Bishop Street, Chicago, IL 60609
MLS# 12669434Listed by: TRADEMARKS & ASSOCIATES - New
 $290,000Active12 beds 4 baths
7321 S Stewart Avenue, Chicago, IL 60621
MLS# 12670193Listed by: COLDWELL BANKER REAL ESTATE GROUP - New
 $469,900Active3 beds 2 baths1,700 sq. ft.
1151 W 14th Place #332, Chicago, IL 60608
MLS# 12670655Listed by: RE/MAX CITY - New
 $159,000Active4 beds 2 baths1,300 sq. ft.
1233 W 73rd Place, Chicago, IL 60636
MLS# 12670503Listed by: KELLER WILLIAMS ONECHICAGO - New
 $140,000Active4 beds 2 baths969 sq. ft.
1647 W 59th Street, Chicago, IL 60636
MLS# 12670558Listed by: KELLER WILLIAMS ONECHICAGO - New
 $359,000Active4 beds 3 baths2,000 sq. ft.
8155 S Wabash Avenue, Chicago, IL 60619
MLS# 12670618Listed by: EXECUTIVE REALTY GROUP LLC - New
 $195,000Active4 beds 1 baths
6037 & 6039 S Wood Street, Chicago, IL 60636
MLS# 12670581Listed by: KELLER WILLIAMS ONECHICAGO - New
 $329,000Active5 beds 3 baths
5415 W Parker Avenue, Chicago, IL 60639
MLS# 12655312Listed by: COMPASS - New
 $250,000Active3 beds 2 baths1,600 sq. ft.
4815 S Champlain Avenue #2, Chicago, IL 60615
MLS# 12668621Listed by: KM REALTY GROUP, LLC - New
 $254,900Active1 beds 1 baths850 sq. ft.
208 W Washington Street #1404, Chicago, IL 60606
MLS# 12644120Listed by: MORPHEASY REALTY - New
 $299,999Active5 beds 3 baths
5237 S Princeton Avenue, Chicago, IL 60609
MLS# 12667002Listed by: EXAREALTY LLC - New
 $150,000Active3 beds 2 baths1,435 sq. ft.
3149 W Lexington Street #1, Chicago, IL 60612
MLS# 12670480Listed by: RE/MAX PREMIER - New
 $279,000Active2 beds 2 baths1,136 sq. ft.
3506 S State Street #303, Chicago, IL 60609
MLS# 12653021Listed by: CENTURY 21 REALTY ASSOCIATES - New
 $1,179,000Active6 beds 4 baths3,400 sq. ft.
3027 N Allen Avenue, Chicago, IL 60618
MLS# 12659222Listed by: DEGRAS HILL PROPERTIES, INC. - New
 $399,000Active5 beds 2 baths1,942 sq. ft.
6348 S Laporte Avenue, Chicago, IL 60638
MLS# 12670476Listed by: EXP REALTY - New
 $75,000Active0 Acres
1337 W Haddon Avenue, Chicago, IL 60622
MLS# 12670485Listed by: @PROPERTIES CHRISTIE'S INTERNATIONAL REAL ESTATE - New
 $2,680,000Active3 beds 3 baths2,577 sq. ft.
363 E Wacker Drive #2708, Chicago, IL 60601
MLS# 12670522Listed by: COMPASS - New
 $410,000Active1 beds 1 baths947 sq. ft.
303 W Ohio Street #2902, Chicago, IL 60654
MLS# 12670523Listed by: AMERICORP, LTD  $529,900Pending3 beds 3 baths1,900 sq. ft.
4443 S Vincennes Avenue #2, Chicago, IL 60653
MLS# 12670383Listed by: FULTON GRACE REALTY- New
 $400,000Active3 beds 1 baths1,300 sq. ft.
4517 N Ashland Avenue #3N, Chicago, IL 60640
MLS# 12665289Listed by: @PROPERTIES CHRISTIE'S INTERNATIONAL REAL ESTATE - Open Sun, 12 to 2:30pmNew
 $469,500Active6 beds 4 baths3,500 sq. ft.
8232 S Calumet Avenue, Chicago, IL 60619
MLS# 12670264Listed by: HOMESMART CONNECT LLC - New
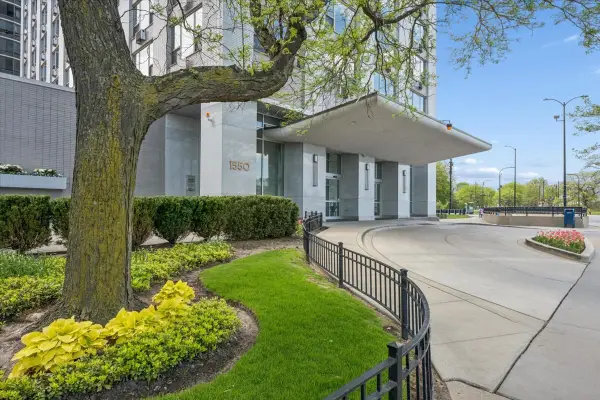 $575,000Active1 beds 2 baths1,400 sq. ft.
1550 N Lake Shore Drive #12A, Chicago, IL 60610
MLS# 12670491Listed by: JAMESON SOTHEBY'S INTL REALTY - New
 $585,000Active5 beds 3 baths2,414 sq. ft.
1244 W 96th Street, Chicago, IL 60643
MLS# 12616527Listed by: KELLER WILLIAMS THRIVE - New
 $50,000Active0 Acres
403 W 62nd Street, Chicago, IL 60621
MLS# 12636616Listed by: HOUSE OF REAL ESTATE - New
 $40,000Active0 Acres
6531 S Emerald Avenue, Chicago, IL 60621
MLS# 12636648Listed by: HOUSE OF REAL ESTATE - New$60,000Active0.06 Acres
6537 S Emerald Avenue, Chicago, IL 60621
MLS# 12636659Listed by: HOUSE OF REAL ESTATE - New
 $250,000Active5 beds 3 baths2,000 sq. ft.
6328 S Drexel Avenue #1, Chicago, IL 60637
MLS# 12670318Listed by: KELLER WILLIAMS PREFERRED RLTY - New
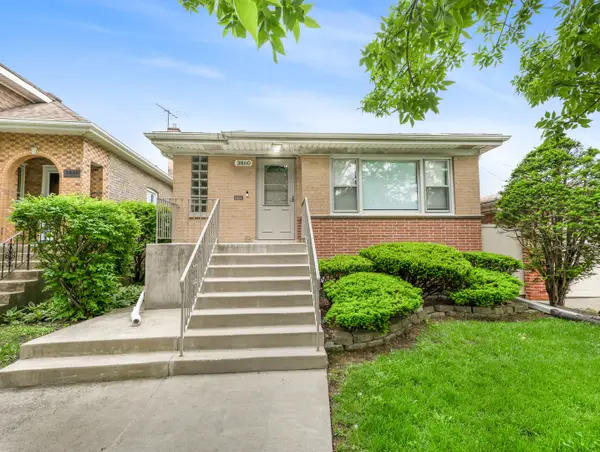 $444,000Active4 beds 2 baths1,377 sq. ft.
3860 N Oketo Avenue, Chicago, IL 60634
MLS# 12670323Listed by: WEICHERT, REALTORS - ALL PRO - New
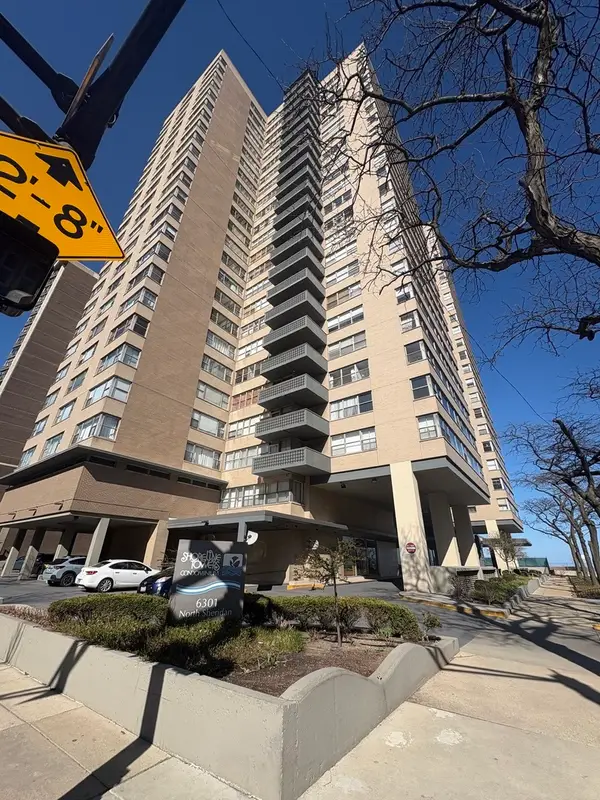 $149,000Active1 beds 1 baths825 sq. ft.
6301 N Sheridan Road #9M, Chicago, IL 60660
MLS# 12670326Listed by: BERKSHIRE HATHAWAY HOMESERVICES STARCK REAL ESTATE - New
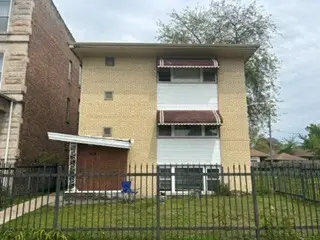 $305,000Active8 beds 3 baths
1210 E 72nd Street, Chicago, IL 60619
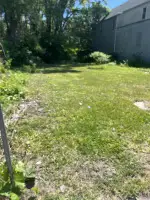
MLS# 12670334Listed by: GRANDVIEW REALTY, LLC - New$80,000Active0.14 Acres
419 W 65th Street, Chicago, IL 60621
MLS# 12636668Listed by: HOUSE OF REAL ESTATE - New
 $80,000Active0 Acres
6636 S Stewart Avenue, Chicago, IL 60621
MLS# 12636673Listed by: HOUSE OF REAL ESTATE - New
 $50,000Active0.06 Acres
6441 S Eggleston Avenue, Chicago, IL 60621
MLS# 12636677Listed by: HOUSE OF REAL ESTATE - New
 $80,000Active0 Acres
530 W 61st Place, Chicago, IL 60621
MLS# 12636681Listed by: HOUSE OF REAL ESTATE - New
 $25,000Active0 Acres
5900 S Princeton Avenue, Chicago, IL 60621
MLS# 12636686Listed by: HOUSE OF REAL ESTATE - New
 $60,000Active0.14 Acres
740 W 61st Place, Chicago, IL 60621
MLS# 12636687Listed by: HOUSE OF REAL ESTATE - New
 $399,000Active4 beds 4 baths1,400 sq. ft.
425 N Lawler Avenue, Chicago, IL 60644
MLS# 12660223Listed by: COLDWELL BANKER REALTY - New
 $225,000Active1 beds 1 baths641 sq. ft.
659 W Randolph Street #717, Chicago, IL 60661
MLS# 12662044Listed by: BERKSHIRE HATHAWAY HOMESERVICES CHICAGO - New
 $749,900Active6 beds 6 baths
6835 S Clyde Avenue, Chicago, IL 60649
MLS# 12664985Listed by: REAL BROKER LLC - New
 $139,999Active3 beds 2 baths1,250 sq. ft.
4116 W Congress Parkway #2, Chicago, IL 60624
MLS# 12669618Listed by: CITY LIVING REALTY INC. - New
 $80,000Active0.21 Acres
656 W 61st Street, Chicago, IL 60621
MLS# 12636690Listed by: HOUSE OF REAL ESTATE - New
 $35,000Active0.07 Acres
652 W 61st Place, Chicago, IL 60621
MLS# 12636693Listed by: HOUSE OF REAL ESTATE - New
 $40,000Active0.09 Acres
614 W 61st Place, Chicago, IL 60621
MLS# 12636695Listed by: HOUSE OF REAL ESTATE - New
 $45,000Active0.7 Acres
1417 S Kenneth Avenue, Chicago, IL 60623
MLS# 12637133Listed by: HOUSE OF REAL ESTATE - New
 $45,000Active0.07 Acres
1338 S Keeler Avenue, Chicago, IL 60623
MLS# 12637137Listed by: HOUSE OF REAL ESTATE - New
 $35,000Active0 Acres
4104 W 16th Street, Chicago, IL 60623
MLS# 12637138Listed by: HOUSE OF REAL ESTATE - New
 $348,888Active4 beds 2 baths1,382 sq. ft.
4744 S Hamlin Avenue, Chicago, IL 60632
MLS# 12616606Listed by: HOMESMART REALTY GROUP - New
 $510,000Active2 beds 2 baths1,350 sq. ft.
33 W Ontario Street #57D, Chicago, IL 60654
MLS# 12654219Listed by: PARKVIEW PROPERTIES AND INVEST - New
 $337,000Active4 beds 4 baths2,130 sq. ft.
10203 S Sangamon Street, Chicago, IL 60643
MLS# 12656643Listed by: 3G REALTY GROUP - New
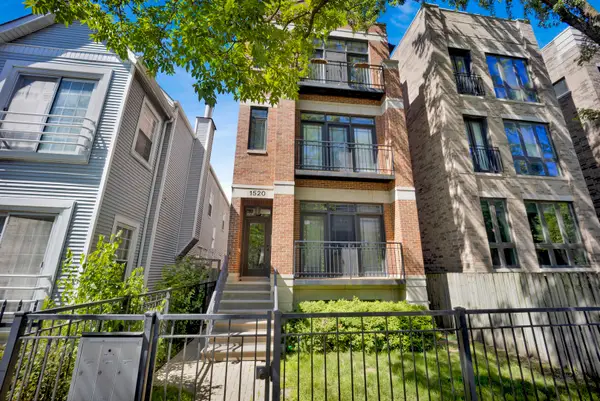
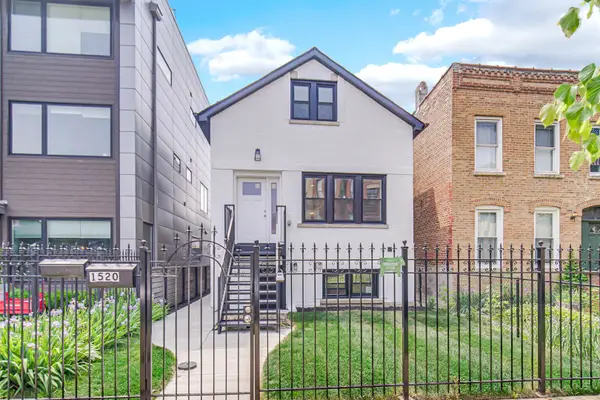 $875,000Active4 beds 3 baths
1520 N Campbell Avenue, Chicago, IL 60622
MLS# 12668900Listed by: EXIT STRATEGY REALTY - New
 $545,900Active8 beds 3 baths
539 N Trumbull Avenue, Chicago, IL 60624
MLS# 12670218Listed by: CENTURY 21 UNIVERSAL - New
 $334,999Active2 beds 1 baths1,200 sq. ft.
1525 S Sangamon Street S #504, Chicago, IL 60608
MLS# 12609368Listed by: OPTION PREMIER LLC - New
 $269,999Active2 beds 1 baths
1111 W 14th Place #111, Chicago, IL 60608
MLS# 12663788Listed by: OPTION PREMIER LLC - New
 $675,000Active2 beds 2 baths
1123 W Altgeld Street #3, Chicago, IL 60614
MLS# 12665461Listed by: BAIRD & WARNER - New
 $350,000Active1 beds 2 baths898 sq. ft.
653 N Kingsbury Street #2102, Chicago, IL 60654
MLS# 12667157Listed by: @PROPERTIES CHRISTIE'S INTERNATIONAL REAL ESTATE - New
 $314,900Active4 beds 2 baths
4405 W Marquette Road, Chicago, IL 60629
MLS# 12667202Listed by: RE/MAX MI CASA - New
 $379,900Active3 beds 3 baths1,194 sq. ft.
4542 S Mozart Street, Chicago, IL 60632
MLS# 12668532Listed by: IMPERIAL PALACE PROPERTIES CORPORATION - New
 $329,000Active5 beds 3 baths1,400 sq. ft.
1651 E 91st Street, Chicago, IL 60617
MLS# 12669132Listed by: SAFE HARBOR REALTY LLC - New
 $340,000Active2 beds 2 baths1,300 sq. ft.
6034 N Wolcott Avenue #1W, Chicago, IL 60660
MLS# 12669162Listed by: RE/MAX SUBURBAN - New
 $1,099,000Active6 beds 4 baths3,500 sq. ft.
2456 W Huron Street, Chicago, IL 60612
MLS# 12669176Listed by: MICHAEL WAX - New
 $465,900Active2 beds 2 baths1,300 sq. ft.
330 S Michigan Avenue #1601, Chicago, IL 60604
MLS# 12670098Listed by: RE/MAX CITY - New
 $445,000Active3 beds 3 baths2,478 sq. ft.
7027 W 64th Place, Chicago, IL 60638
MLS# 12670155Listed by: DUARTE REALTY COMPANY - New
 $405,000Active4 beds 3 baths1,544 sq. ft.
633 N Latrobe Avenue, Chicago, IL 60644
MLS# 12670157Listed by: KELLER WILLIAMS ONECHICAGO - New
 $5,250,000Active3.64 Acres
2849-3139 W 51st Street, Chicago, IL 60632
MLS# 12670177Listed by: RUIZ REALTY, INC.  $240,000Pending2 beds 1 baths1,100 sq. ft.
5325 N Francisco Avenue #G, Chicago, IL 60625
MLS# 12670149Listed by: EXP REALTY- New
 $839,900Active6 beds 5 baths
5632 N Rockwell Street, Chicago, IL 60659
MLS# 12669990Listed by: LE FOREVER REALTY, LLC - New
 $10,000Active0 Acres
1308 S Kedvale Avenue, Chicago, IL 60623
MLS# 12611637Listed by: CHICAGO'S REAL ESTATE AGENCY - New
 $10,000Active0 Acres
1850 S Springfield Avenue, Chicago, IL 60623
MLS# 12629241Listed by: CHICAGO'S REAL ESTATE AGENCY - New
 $99,900Active0 Acres
3808 S Wabash Avenue, Chicago, IL 60653
MLS# 12644489Listed by: @PROPERTIES CHRISTIE'S INTERNATIONAL REAL ESTATE - New
 $349,000Active5 beds 2 baths
5806 S Talman Avenue, Chicago, IL 60629
MLS# 12654312Listed by: KALE REALTY - New
 $1,200,000Active3 beds 3 baths2,143 sq. ft.
1124 W Adams Street #5E, Chicago, IL 60607
MLS# 12661349Listed by: @PROPERTIES CHRISTIE'S INTERNATIONAL REAL ESTATE - New
 $699,000Active7 beds 4 baths3,412 sq. ft.
1755 N New England Avenue, Chicago, IL 60707
MLS# 12662077Listed by: MPOWER RESIDENTIAL BROKERAGE LLC - Open Sat, 1 to 2:30pmNew
 $489,000Active2 beds 2 baths1,350 sq. ft.
33 W Ontario Street #48A, Chicago, IL 60654
MLS# 12666798Listed by: BAIRD & WARNER - New
 $189,900Active1 beds 1 baths540 sq. ft.
3733 W 64th Street, Chicago, IL 60629
MLS# 12669422Listed by: REALTY OF AMERICA, LLC - New
 $360,000Active1 beds 1 baths825 sq. ft.
400 E Randolph Street #2518, Chicago, IL 60601
MLS# 12669548Listed by: BERKSHIRE HATHAWAY HOMESERVICES CHICAGO  $450,000Pending1 beds 1 baths825 sq. ft.
400 E Randolph Street #2305, Chicago, IL 60601
MLS# 12669688Listed by: BERKSHIRE HATHAWAY HOMESERVICES CHICAGO- New
 $179,500Active1 beds 1 baths
6301 N Sheridan Road #4G, Chicago, IL 60660
MLS# 12670030Listed by: @PROPERTIES CHRISTIE'S INTERNATIONAL REAL ESTATE  $245,000Pending3 beds 1 baths1,200 sq. ft.
2822 W Granville Avenue #2W, Chicago, IL 60659
MLS# 12670031Listed by: DIRECT BROKER LLC- New
 $37,000Active5 beds 2 baths
8429 S Sangamon Street, Chicago, IL 60620
MLS# 12670060Listed by: PREMIER AGENT NETWORK ILLINOIS LLC - New
 $399,000Active3 beds 3 baths1,401 sq. ft.
1416 W Farwell Avenue #1R, Chicago, IL 60626
MLS# 12670115Listed by: @PROPERTIES CHRISTIE'S INTERNATIONAL REAL ESTATE - New
 $745,000Active4 beds 4 baths4,500 sq. ft.
4859 W Hirsch Street, Chicago, IL 60651
MLS# 12661466Listed by: RE/MAX CITY - New
 $347,000Active1 beds 1 baths805 sq. ft.
160 E Illinois Street #1704, Chicago, IL 60611
MLS# 12595788Listed by: EXP REALTY - New
 $220,000Active2 beds 1 baths1,000 sq. ft.
6103 S Kimbark Avenue #3E, Chicago, IL 60637
MLS# 12595872Listed by: RE/MAX PREMIER - New
 $329,000Active2 beds 2 baths1,071 sq. ft.
1 S Leavitt Street #403, Chicago, IL 60612
MLS# 12648435Listed by: @PROPERTIES CHRISTIE'S INTERNATIONAL REAL ESTATE - New
 $585,000Active4 beds 4 baths1,656 sq. ft.
3651 S Giles Avenue, Chicago, IL 60653
MLS# 12667250Listed by: UNITED REAL ESTATE - CHICAGO - New
 $219,900Active1 beds 1 baths950 sq. ft.
4534 N Cumberland Avenue #401, Chicago, IL 60656
MLS# 12668063Listed by: ADVOCATE REALTY - New
 $239,900Active2 beds 2 baths
5447 W Lawrence Avenue #203, Chicago, IL 60630
MLS# 12668933Listed by: KELLER WILLIAMS ONECHICAGO - New
 $249,999Active2 beds 1 baths
6711 N Lakewood Avenue #2N, Chicago, IL 60626
MLS# 12670009Listed by: YOUMU VENTURES LLC - New
 $510,000Active2 beds 2 baths1,300 sq. ft.
852 N Ashland Avenue #3, Chicago, IL 60622
MLS# 12652646Listed by: SHOPPING CASAS CHICAGO LLC  $288,800Pending2 beds 2 baths1,250 sq. ft.
5701 N Sheridan Road #5A, Chicago, IL 60660
MLS# 12669683Listed by: @PROPERTIES CHRISTIE'S INTERNATIONAL REAL ESTATE- New
 $480,000Active1 beds 1 baths825 sq. ft.
400 E Randolph Street #1705, Chicago, IL 60601
MLS# 12629583Listed by: BERKSHIRE HATHAWAY HOMESERVICES CHICAGO  $260,000Pending6 beds 2 baths
8739 S Colfax Avenue, Chicago, IL 60617
MLS# 12656876Listed by: A&O DREAM KEY REAL ESTATE- Open Sat, 10:30am to 1:30pmNew
 $525,000Active2 beds 2 baths1,350 sq. ft.
420 W Ontario Street #304, Chicago, IL 60654
MLS# 12657135Listed by: BRILLIANT REAL ESTATE - New
 $574,900Active2 beds 2 baths1,255 sq. ft.
1523 W Thomas Street #2, Chicago, IL 60642
MLS# 12667539Listed by: @PROPERTIES CHRISTIE'S INTERNATIONAL REAL ESTATE - New
 $599,000Active3 beds 3 baths1,614 sq. ft.
3819 N Kilpatrick Avenue, Chicago, IL 60641
MLS# 12668640Listed by: PAYES REAL ESTATE GROUP - New
 $329,000Active4 beds 2 baths1,536 sq. ft.
3912 W Marquette Road, Chicago, IL 60629
MLS# 12668930Listed by: RE/MAX 10 - New
 $385,000Active6 beds 3 baths
7250 S King Drive, Chicago, IL 60619
MLS# 12669082Listed by: VISIONS MANIFESTED REALTY LLC - New
 $275,000Active1 beds 1 baths890 sq. ft.
405 N Wabash Avenue #3911, Chicago, IL 60611
MLS# 12669479Listed by: AMERICORP, LTD - New
 $155,000Active1 beds 1 baths650 sq. ft.
5113 N East River Road #1K, Chicago, IL 60656
MLS# 12669530Listed by: ARHOME REALTY - New
 $349,995Active2 beds 2 baths
33 W Ontario Street #29I, Chicago, IL 60611
MLS# 12669626Listed by: AMERICORP, LTD - New
 $1,800,000Active2 beds 3 baths2,076 sq. ft.
401 N Wabash Avenue #30J, Chicago, IL 60611
MLS# 12669737Listed by: @PROPERTIES CHRISTIE'S INTERNATIONAL REAL ESTATE - New
 $679,900Active6 beds 3 baths
1051 N Springfield Avenue, Chicago, IL 60651
MLS# 12669853Listed by: EXECUTIVE REALTY GROUP LLC - New
 $950,000Active3 beds 3 baths2,200 sq. ft.
1000 W Washington Boulevard #513, Chicago, IL 60607
MLS# 12669954Listed by: BAIRD & WARNER - New
 $399,900Active12 beds 5 baths
8239 S Colfax Avenue, Chicago, IL 60617
MLS# 12669970Listed by: RE/MAX MI CASA - New
 $299,999Active3 beds 1 baths1,152 sq. ft.
6029 S Artesian Avenue, Chicago, IL 60629
MLS# 12669986Listed by: SU FAMILIA REAL ESTATE INC - New
 $769,000Active3 beds 2 baths2,800 sq. ft.
910 S Michigan Avenue #2006, Chicago, IL 60605
MLS# 12559528Listed by: REDFIN CORPORATION - New
 $550,000Active5 beds 3 baths3,132 sq. ft.
6010 W School Street, Chicago, IL 60634
MLS# 12634539Listed by: REDFIN CORPORATION - New
 $650,000Active2 beds 3 baths
2013 W Crystal Street #1F, Chicago, IL 60622
MLS# 12662110Listed by: LORI BONAREK REALTY - New
 $285,000Active2 beds 2 baths1,657 sq. ft.
4361 S Greenwood Avenue #1N, Chicago, IL 60653
MLS# 12662739Listed by: @PROPERTIES CHRISTIE'S INTERNATIONAL REAL ESTATE - New
 $269,000Active4 beds 2 baths1,150 sq. ft.
7618 S Carpenter Street, Chicago, IL 60620
MLS# 12663797Listed by: RE/MAX PREMIER - New
 $70,000Active3 beds 2 baths1,540 sq. ft.
9433 S Michigan Avenue, Chicago, IL 60619
MLS# 12664070Listed by: KELLER WILLIAMS PREFERRED RLTY - New
 $285,000Active1 beds 1 baths840 sq. ft.
2626 N Lakeview Avenue #3804, Chicago, IL 60614
MLS# 12665867Listed by: HOMESMART CONNECT LLC - New
 $500,000Active2 beds 1 baths1,300 sq. ft.
2600 N Southport Avenue #315, Chicago, IL 60614
MLS# 12666934Listed by: @PROPERTIES CHRISTIE'S INTERNATIONAL REAL ESTATE - New
 $315,000Active1 beds 1 baths658 sq. ft.
1120 N Lake Shore Drive #1B, Chicago, IL 60611
MLS# 12667142Listed by: BAIRD & WARNER - New
 $279,900Active3 beds 3 baths954 sq. ft.
906 W 71st Street, Chicago, IL 60621
MLS# 12667554Listed by: NEW HOPE REALTY GROUP, INC. - New
 $530,000Active3 beds 1 baths
3551 N Reta Avenue #2, Chicago, IL 60657
MLS# 12668125Listed by: REDFIN CORPORATION - New
 $999,995Active3 beds 3 baths2,769 sq. ft.
706 S Ada Street, Chicago, IL 60607
MLS# 12668384Listed by: AMERICORP, LTD - New
 $625,000Active3 beds 3 baths1,574 sq. ft.
331 S Peoria Street #107, Chicago, IL 60607
MLS# 12668687Listed by: COLDWELL BANKER REALTY - New
 $299,900Active4 beds 3 baths2,000 sq. ft.
7000 S Eberhart Avenue, Chicago, IL 60637
MLS# 12669466Listed by: DEI REALTY LLC - New
 $270,000Active1 beds 1 baths
235 W Van Buren Street #2918, Chicago, IL 60607
MLS# 12669581Listed by: HOMESMART CONNECT LLC - New
 $289,900Active1 beds 1 baths1,080 sq. ft.
260 E Chestnut Street #2505, Chicago, IL 60611
MLS# 12669657Listed by: REDFIN CORPORATION - New
 $350,000Active7 beds 2 baths
2724 W Jackson Boulevard, Chicago, IL 60612
MLS# 12669685Listed by: R.A. HOMES & ASSOCIATES, INC. - New
 $1,899,000Active3 beds 3 baths2,754 sq. ft.
180 E Pearson Street #3807, Chicago, IL 60611
MLS# 12669709Listed by: COLDWELL BANKER REALTY - New
 $109,900Active4 beds 2 baths1,931 sq. ft.
7011 S Calumet Avenue, Chicago, IL 60637
MLS# 12669739Listed by: CIRCLE ONE REALTY - New
 $135,000Active3 beds 2 baths1,653 sq. ft.
7521 S Aberdeen Street, Chicago, IL 60620
MLS# 12669800Listed by: SU FAMILIA REAL ESTATE INC - New
 $175,000Active2 beds 1 baths
1931 W Albion Avenue #1, Chicago, IL 60626
MLS# 12669811Listed by: SECOND CITY REAL ESTATE - New
 $69,000Active3 beds 1 baths1,200 sq. ft.
7331 S Peoria Street, Chicago, IL 60621
MLS# 12669812Listed by: CHICAGOLAND BROKERS, INC.  $349,000Pending3 beds 2 baths1,032 sq. ft.
5748 S Kenneth Avenue, Chicago, IL 60629
MLS# 12669848Listed by: RE/MAX IN THE VILLAGE- New
 $16,000Active0 Acres
6824-6826 S Honore Street, Chicago, IL 60636
MLS# 12669887Listed by: RE/MAX MI CASA  $168,800Pending1 beds 1 baths950 sq. ft.
5701 N Sheridan Road #14F, Chicago, IL 60660
MLS# 12669649Listed by: @PROPERTIES CHRISTIE'S INTERNATIONAL REAL ESTATE $4,495,000Pending7 beds 7 baths5,750 sq. ft.
1852 N Howe Street, Chicago, IL 60614
MLS# 12645600Listed by: @PROPERTIES CHRISTIE'S INTERNATIONAL REAL ESTATE $315,000Pending3 beds 2 baths
4705 S Champlain Avenue #301, Chicago, IL 60615
MLS# 12669370Listed by: NORTH CLYBOURN GROUP, INC.- New
 $215,000Active4 beds 2 baths932 sq. ft.
7546 S Wolcott Avenue, Chicago, IL 60620
MLS# 12571949Listed by: REAL BROKER LLC - New
 $449,000Active2 beds 2 baths1,150 sq. ft.
345 W Fullerton Parkway #801, Chicago, IL 60614
MLS# 12636880Listed by: REAL PEOPLE REALTY - New
 $530,000Active6 beds 3 baths2,367 sq. ft.
2426 N Neva Avenue, Chicago, IL 60707
MLS# 12639654Listed by: MY PATH PROPERTIES, LLC - New
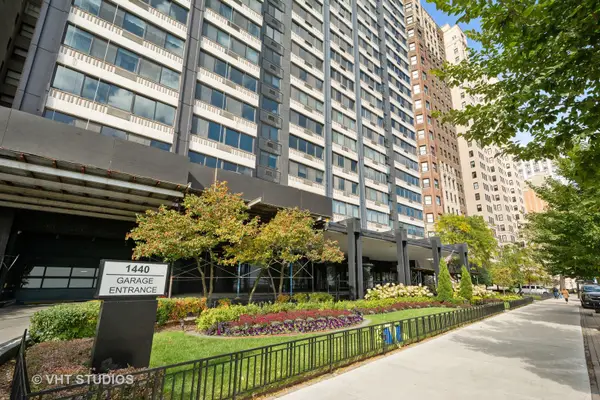 $545,000Active3 beds 2 baths1,720 sq. ft.
1440 N Lake Shore Drive #23A, Chicago, IL 60610
MLS# 12642134Listed by: BAIRD & WARNER - New
 $450,000Active2 beds 2 baths1,500 sq. ft.
619 N Racine Avenue #1, Chicago, IL 60642
MLS# 12653655Listed by: EXP REALTY - New
 $1,700,000Active4 beds 4 baths3,000 sq. ft.
1203 E 50th Street, Chicago, IL 60615
MLS# 12655874Listed by: COMPASS - New
 $1,185,000Active3 beds 3 baths2,300 sq. ft.
333 W Hubbard Street #610-611, Chicago, IL 60654
MLS# 12660159Listed by: JAMESON SOTHEBY'S INTL REALTY - New
 $325,000Active3 beds 1 baths
2019 W Chase Avenue, Chicago, IL 60645
MLS# 12663664Listed by: BAIRD & WARNER - New
 $260,000Active1 beds 1 baths900 sq. ft.
3145 N Cambridge Avenue #GN, Chicago, IL 60657
MLS# 12663709Listed by: JAMESON SOTHEBY'S INTL REALTY - New
 $245,000Active4 beds 2 baths1,305 sq. ft.
1205 E 93rd Street, Chicago, IL 60619
MLS# 12664933Listed by: ANI REAL ESTATE - New
 $589,900Active3 beds 2 baths1,300 sq. ft.
4831 N Winthrop Avenue #3S, Chicago, IL 60640
MLS# 12664956Listed by: BAIRD & WARNER - New
 $685,000Active3 beds 2 baths
5008 N Lincoln Avenue #3S, Chicago, IL 60625
MLS# 12665413Listed by: COMPASS - New
 $875,000Active2 beds 2 baths1,953 sq. ft.
1016 W Madison Street #4S, Chicago, IL 60607
MLS# 12665582Listed by: @PROPERTIES CHRISTIE'S INTERNATIONAL REAL ESTATE - New
 $184,900Active-- beds 1 baths
260 E Chestnut Street #409, Chicago, IL 60611
MLS# 12666334Listed by: REMAX LEGENDS - New
 $257,000Active1 beds 1 baths
3550 N Lake Shore Drive #519, Chicago, IL 60657
MLS# 12666568Listed by: @PROPERTIES CHRISTIE'S INTERNATIONAL REAL ESTATE - New
 $170,000Active-- beds 1 baths518 sq. ft.
1 E Scott Street #1311, Chicago, IL 60610
MLS# 12666877Listed by: KELLER WILLIAMS ONECHICAGO - New
 $435,000Active3 beds 2 baths1,900 sq. ft.
3912 W 107th Street, Chicago, IL 60655
MLS# 12667130Listed by: BAIRD & WARNER - New
 $449,000Active2 beds 2 baths1,250 sq. ft.
5415 N Sheridan Road #1601, Chicago, IL 60640
MLS# 12667360Listed by: KELLER WILLIAMS ONECHICAGO - Open Sun, 1 to 3pmNew
 $289,000Active5 beds 2 baths
Address Withheld By Seller, Chicago, IL 60628
MLS# 12667382Listed by: ARD REAL ESTATE PLLC - New
 $480,000Active7 beds 3 baths
2114 S Trumbull Avenue, Chicago, IL 60623
MLS# 12667775Listed by: RE/MAX PARTNERS  $375,000Pending2 beds 1 baths
5040 N Lawndale Avenue, Chicago, IL 60625
MLS# 12667822Listed by: COLDWELL BANKER REALTY- New
 $250,000Active0.21 Acres
4930 S Western Avenue, Chicago, IL 60609
MLS# 12668102Listed by: CHICAGO PROPERTIES FIRM - New
 $299,900Active1 beds 1 baths
225 W Huron Street #209, Chicago, IL 60654
MLS# 12668174Listed by: COLDWELL BANKER REALTY - New
 $789,000Active3 beds 3 baths2,500 sq. ft.
6470 N Newcastle Avenue, Chicago, IL 60631
MLS# 12668389Listed by: HOMECOIN.COM - New
 $1,199,950Active5 beds 5 baths3,700 sq. ft.
5942 N Kolmar Avenue, Chicago, IL 60646
MLS# 12668493Listed by: COLDWELL BANKER REALTY - New
 $75,000Active0.07 Acres
4936 S Western Avenue, Chicago, IL 60609
MLS# 12668561Listed by: CHICAGO PROPERTIES FIRM - New
 $49,950Active3 beds 2 baths1,360 sq. ft.
10631 S Wabash Avenue, Chicago, IL 60628
MLS# 12668904Listed by: MEEKER REAL ESTATE INC - New
 $590,000Active2 beds 3 baths
1330 N Lasalle Street #300, Chicago, IL 60610
MLS# 12669124Listed by: ARNI REALTY INCORPORATED - Open Mon, 10am to 3pmNew
 $1,037,000Active2 beds 2 baths1,701 sq. ft.
850 N Lake Shore Drive #406, Chicago, IL 60611
MLS# 12669277Listed by: WOLF RESIDENTIAL GROUP LLC - New
 $415,000Active5 beds 2 baths1,968 sq. ft.
5836 S Mayfield Avenue, Chicago, IL 60638
MLS# 12669283Listed by: RE/MAX MILLENNIUM - New
 $799,999Active5 beds 5 baths3,600 sq. ft.
5419 S Michigan Avenue, Chicago, IL 60615
MLS# 12669297Listed by: HOMESMART CONNECT LLC - New
 $215,000Active3 beds 1 baths1,077 sq. ft.
7307 S Damen Avenue, Chicago, IL 60636
MLS# 12669306Listed by: EXP REALTY - New
 $630,000Active9 beds 3 baths
6506 S Saint Lawrence Avenue, Chicago, IL 60637
MLS# 12669309Listed by: @PROPERTIES CHRISTIE'S INTERNATIONAL REAL ESTATE - New
 $299,999Active1 beds 1 baths850 sq. ft.
700 W Van Buren Street #602, Chicago, IL 60607
MLS# 12669311Listed by: COMPASS - Open Mon, 10am to 3pmNew
 $769,000Active2 beds 2 baths1,256 sq. ft.
850 N Lake Shore Drive #1910, Chicago, IL 60611
MLS# 12669323Listed by: WOLF RESIDENTIAL GROUP LLC - New
 $1,299,900Active5 beds 4 baths3,500 sq. ft.
4036 W Warwick Avenue, Chicago, IL 60641
MLS# 12669345Listed by: Y REALTY - New
 $459,000Active3 beds 3 baths1,673 sq. ft.
3221 N Opal Avenue, Chicago, IL 60634
MLS# 12669366Listed by: RE/MAX SUBURBAN - New
 $1,849,000Active6 beds 5 baths
2312 W Charleston Street, Chicago, IL 60647
MLS# 12669373Listed by: JAMESON SOTHEBY'S INTL REALTY - New
 $489,900Active5 beds 3 baths1,368 sq. ft.
1935 N Natoma Avenue, Chicago, IL 60707
MLS# 12669387Listed by: REALTY OF AMERICA, LLC - New
 $850,000Active2 beds 2 baths1,639 sq. ft.
1201 S Prairie Avenue #3605, Chicago, IL 60605
MLS# 12669394Listed by: COMPASS - New
 $225,000Active2 beds 1 baths906 sq. ft.
6433 S Talman Avenue, Chicago, IL 60629
MLS# 12669405Listed by: COLDWELL BANKER REALTY - New
 $424,900Active5 beds 2 baths
5651 W Grand Avenue, Chicago, IL 60639
MLS# 12669407Listed by: HERBERT A GONZALEZ DMB - Open Mon, 10am to 3pmNew
 $709,000Active1 beds 1 baths1,040 sq. ft.
850 N Lake Shore Drive #1908, Chicago, IL 60611
MLS# 12669418Listed by: WOLF RESIDENTIAL GROUP LLC - New
 $399,900Active3 beds 2 baths1,513 sq. ft.
5458 W Windsor Avenue, Chicago, IL 60630
MLS# 12669441Listed by: RE/MAX PREMIER LUXURY COLLECTION - New
 $459,000Active0 Acres
2243 W Grand Avenue, Chicago, IL 60612
MLS# 12669502Listed by: COMPASS - New
 $549,000Active2 beds 2 baths1,196 sq. ft.
Address Withheld By Seller, Chicago, IL 60646
MLS# 12669503Listed by: BAIRD & WARNER - New
 $319,999Active6 beds 3 baths
5721 S Hermitage Avenue, Chicago, IL 60636
MLS# 12669534Listed by: AVENUE PROPERTIES CHICAGO - New
 $674,900Active6 beds 3 baths2,258 sq. ft.
5252 N Mulligan Avenue, Chicago, IL 60630
MLS# 12669540Listed by: HOMESMART CONNECT LLC - New
 $557,500Active3 beds 2 baths1,113 sq. ft.
8517 W Carmen Avenue, Chicago, IL 60656
MLS# 12669547Listed by: CENTURY 21 CIRCLE - New
 $899,999Active7 beds 5 baths
5333 W Foster Avenue, Chicago, IL 60630
MLS# 12669552Listed by: FULTON GRACE REALTY - New
 $414,900Active2 beds 2 baths1,290 sq. ft.
520 S State Street #902, Chicago, IL 60605
MLS# 12669555Listed by: @PROPERTIES CHRISTIE'S INTERNATIONAL REAL ESTATE - New
 $319,900Active3 beds 2 baths1,744 sq. ft.
9911 S Prospect Avenue, Chicago, IL 60643
MLS# 12611747Listed by: COLDWELL BANKER REALTY - New
 $2,675,000Active6 beds 6 baths4,600 sq. ft.
1841 W Newport Avenue, Chicago, IL 60657
MLS# 12622613Listed by: @PROPERTIES CHRISTIE'S INTERNATIONAL REAL ESTATE - New
 $525,000Active5 beds 3 baths2,200 sq. ft.
2223 N Keeler Avenue, Chicago, IL 60639
MLS# 12625050Listed by: CORCORAN URBAN REAL ESTATE - New
 $875,000Active3 beds 3 baths
3806 N Damen Avenue #1, Chicago, IL 60618
MLS# 12657906Listed by: COMPASS - New
 $84,900Active3 beds 2 baths1,364 sq. ft.
321 W 114th Street, Chicago, IL 60628
MLS# 12665945Listed by: KELLER WILLIAMS THRIVE - New
 $249,900Active4 beds 2 baths1,211 sq. ft.
8519 S King Drive, Chicago, IL 60619
MLS# 12667162Listed by: PARKVUE REALTY CORPORATION - New
 $980,000Active3 beds 2 baths1,800 sq. ft.
3344 N Halsted Street #4N, Chicago, IL 60657
MLS# 12667847Listed by: @PROPERTIES CHRISTIE'S INTERNATIONAL REAL ESTATE - New
 $265,000Active2 beds 2 baths1,198 sq. ft.
6301 N Sheridan Road #18E, Chicago, IL 60660
MLS# 12668602Listed by: KELLER WILLIAMS THRIVE - Open Sat, 11am to 1pmNew
 $318,800Active5 beds 2 baths2,284 sq. ft.
8014 S Yates Boulevard, Chicago, IL 60617
MLS# 12668964Listed by: REALTY EXECUTIVES NEW IMAGE - New
 $800,000Active6 beds 4 baths
2915 N Dawson Avenue, Chicago, IL 60618
MLS# 12669046Listed by: REAL BROKER LLC - New
 $693,500Active6 beds 2 baths3,090 sq. ft.
6515 N Maplewood Avenue, Chicago, IL 60645
MLS# 12669254Listed by: CENTURY 21 CIRCLE - New
 $999,500Active2 beds 2 baths1,775 sq. ft.
180 E Pearson Street #4002, Chicago, IL 60611
MLS# 12669269Listed by: COMPASS - New
 $369,900Active9 beds 3 baths
6640 S Union Avenue, Chicago, IL 60621
MLS# 12669270Listed by: BLUE DOOR DAVE INC - New
 $825,000Active5 beds 4 baths3,100 sq. ft.
6840 S Cregier Avenue, Chicago, IL 60649
MLS# 12666640Listed by: VILLAGE REALTY, INC. - New
 $103,500Active2 beds 2 baths1,008 sq. ft.
1140 E 81st Street #F, Chicago, IL 60619
MLS# 12619404Listed by: KELLER WILLIAMS PREFERRED REALTY - New
 $10,000Active0 Acres
6012 S Union Avenue, Chicago, IL 60621
MLS# 12633910Listed by: CHICAGO'S REAL ESTATE AGENCY - New
 $387,900Active8 beds 3 baths1,354 sq. ft.
3005 W 55th Street, Chicago, IL 60632
MLS# 12661641Listed by: HOME SELLERS REALTY INC. - New
 $315,000Active3 beds 2 baths1,650 sq. ft.
3437 W 84th Place, Chicago, IL 60652
MLS# 12663206Listed by: KELLER WILLIAMS INSPIRE - GENEVA - New
 $1,400,000Active5 beds 4 baths3,958 sq. ft.
2144 N Rockwell Street, Chicago, IL 60647
MLS# 12663694Listed by: @PROPERTIES CHRISTIE'S INTERNATIONAL REAL ESTATE - New
 $199,000Active2 beds 1 baths600 sq. ft.
1904 N Drake Avenue #1A, Chicago, IL 60647
MLS# 12664405Listed by: @PROPERTIES CHRISTIE'S INTERNATIONAL REAL ESTATE - New
 $328,000Active3 beds 3 baths2,000 sq. ft.
8848 S Jeffery Boulevard, Chicago, IL 60617
MLS# 12665053Listed by: RE/MAX PREMIER - New
 $325,000Active1 beds 1 baths
400 N Lasalle Street #1709, Chicago, IL 60654
MLS# 12665536Listed by: @PROPERTIES CHRISTIE'S INTERNATIONAL REAL ESTATE - New
 $1,365,000Active3 beds 3 baths1,574 sq. ft.
211 N Harbor Drive #3108, Chicago, IL 60601
MLS# 12665580Listed by: JAMESON SOTHEBY'S INTL REALTY - New
 $269,900Active2 beds 1 baths1,200 sq. ft.
6316 W Montrose Avenue #102, Chicago, IL 60634
MLS# 12667556Listed by: CHARLES RUTENBERG REALTY OF IL - New
 $399,000Active10 beds 4 baths
525 W 118th Street, Chicago, IL 60628
MLS# 12667604Listed by: LEVERAGE INVESTMENTS, LLC - New
 $89,999Active6 beds 2 baths
347 W 59th Place, Chicago, IL 60621
MLS# 12667862Listed by: CENTURY 21 CIRCLE - New
 $164,900Active3 beds 1 baths1,100 sq. ft.
11741 S Wentworth Avenue, Chicago, IL 60628
MLS# 12667949Listed by: CIRCLE ONE REALTY - New
 $174,900Active3 beds 2 baths1,351 sq. ft.
118 E 107th Street, Chicago, IL 60628
MLS# 12667970Listed by: GRANDVIEW REALTY, LLC - New
 $389,000Active3 beds 1 baths2,000 sq. ft.
6244 W Foster Avenue, Chicago, IL 60630
MLS# 12668545Listed by: BERKSHIRE HATHAWAY HOMESERVICES CHICAGO - New
 $325,000Active1 beds 1 baths850 sq. ft.
545 N Dearborn Street #W1409, Chicago, IL 60654
MLS# 12668870Listed by: FULTON GRACE REALTY - New
 $10,000Active0 Acres
6007 S Winchester Avenue, Chicago, IL 60609
MLS# 12668894Listed by: CHICAGO'S REAL ESTATE AGENCY - New
 $539,000Active4 beds 2 baths2,380 sq. ft.
6761 W Talcott Avenue, Chicago, IL 60656
MLS# 12668898Listed by: NEW HOPE REALTY GROUP, INC. - New
 $49,000Active3 beds 2 baths1,662 sq. ft.
556 W 111th Street, Chicago, IL 60628
MLS# 12668905Listed by: KUNO REAL ESTATE - New
 $239,500Active3 beds 1 baths1,786 sq. ft.
11349 S Saint Lawrence Avenue, Chicago, IL 60628
MLS# 12668947Listed by: RE/MAX CORNERSTONE - New
 $119,900Active3 beds 1 baths1,214 sq. ft.
9036 S Harper Avenue, Chicago, IL 60619
MLS# 12668965Listed by: SR REALTY GROUP INC. - New
 $10,000Active0 Acres
5717 S Peoria Street, Chicago, IL 60621
MLS# 12668972Listed by: CHICAGO'S REAL ESTATE AGENCY - New
 $10,000Active0 Acres
5731 S Hermitage Avenue, Chicago, IL 60636
MLS# 12668974Listed by: CHICAGO'S REAL ESTATE AGENCY - New
 $1,039,900Active3 beds 3 baths1,800 sq. ft.
2341 W Belden Avenue #1, Chicago, IL 60647
MLS# 12669107Listed by: CHICAGOLAND BROKERS, INC. - New
 $500,000Active2 beds 2 baths1,300 sq. ft.
4038 N Western Avenue #2S, Chicago, IL 60618
MLS# 12569129Listed by: BAIRD & WARNER  $483,500Pending3 beds 3 baths1,375 sq. ft.
3806 N Octavia Avenue, Chicago, IL 60634
MLS# 12620137Listed by: @PROPERTIES CHRISTIE'S INTERNATIONAL REAL ESTATE- New
 $519,900Active4 beds 2 baths2,036 sq. ft.
5326 S Nagle Avenue, Chicago, IL 60638
MLS# 12652059Listed by: BAIRD & WARNER - New
 $1,800,000Active1 beds 2 baths1,703 sq. ft.
435 N Michigan Avenue #701, Chicago, IL 60611
MLS# 12662041Listed by: COLDWELL BANKER REALTY - New
 $574,900Active3 beds 2 baths1,942 sq. ft.
4563 N Merrimac Avenue, Chicago, IL 60630
MLS# 12667624Listed by: VILLAGE REALTY, INC. - New
 $359,900Active5 beds 3 baths1,900 sq. ft.
3858 W 59th Place, Chicago, IL 60629
MLS# 12667803Listed by: RE/MAX LOYALTY - New
 $200,000Active3 beds 2 baths1,550 sq. ft.
3246 W Warren Boulevard #3, Chicago, IL 60624
MLS# 12668214Listed by: KELLER WILLIAMS PREMIERE PROPERTIES - New
 $120,000Active2 beds 2 baths
7939 S Ingleside Avenue #C, Chicago, IL 60619
MLS# 12668322Listed by: ALL CIRCLES INC. - New
 $575,000Active3 beds 3 baths
1818 N Sawyer Avenue #1W, Chicago, IL 60647
MLS# 12668380Listed by: @PROPERTIES CHRISTIE'S INTERNATIONAL REAL ESTATE - New
 $140,000Active-- beds 1 baths420 sq. ft.
601 E 32nd Street #403, Chicago, IL 60616
MLS# 12668825Listed by: LUXESQUIRE REALTY - New
 $619,000Active3 beds 2 baths2,000 sq. ft.
843 N California Avenue #3, Chicago, IL 60622
MLS# 12668921Listed by: BAIRD & WARNER - New
 $1,850,000Active2 beds 3 baths2,446 sq. ft.
363 E Wacker Drive #2709, Chicago, IL 60601
MLS# 12669020Listed by: COMPASS - New
 $415,000Active2 beds 2 baths1,200 sq. ft.
440 N Wabash Avenue #4905, Chicago, IL 60611
MLS# 12669034Listed by: BERKSHIRE HATHAWAY HOMESERVICES CHICAGO - New
 $420,000Active5 beds 3 baths2,100 sq. ft.
3907 W Marquette Road, Chicago, IL 60629
MLS# 12669038Listed by: SU FAMILIA REAL ESTATE INC - New
 $299,500Active1 beds 1 baths800 sq. ft.
1960 N Lincoln Park West #1601, Chicago, IL 60614
MLS# 12669063Listed by: JAMESON SOTHEBY'S INTL REALTY - New
 $725,000Active5 beds 4 baths
4635 W Peterson Avenue, Chicago, IL 60646
MLS# 12663190Listed by: LOHAN REALTY, INC. - New
 $459,900Active2 beds 2 baths
6 S Laflin Street #510, Chicago, IL 60607
MLS# 12664812Listed by: @PROPERTIES CHRISTIE'S INTERNATIONAL REAL ESTATE - New
 $2,399,000Active3 beds 3 baths
1935 N Mohawk Street #4N, Chicago, IL 60614
MLS# 12541812Listed by: FULTON GRACE REALTY - New
 $1,975,000Active4 beds 4 baths
1935 N Mohawk Street #1S, Chicago, IL 60614
MLS# 12597724Listed by: FULTON GRACE REALTY - New
 $10,000Active0 Acres
5209 S Winchester Avenue, Chicago, IL 60609
MLS# 12633821Listed by: CHICAGO'S REAL ESTATE AGENCY - New
 $499,900Active5 beds 2 baths2,472 sq. ft.
4310 W Shakespeare Avenue, Chicago, IL 60639
MLS# 12640056Listed by: KELLER WILLIAMS ONECHICAGO - New
 $460,000Active3 beds 2 baths
7515 W Rosedale Avenue, Chicago, IL 60631
MLS# 12642096Listed by: BAIRD & WARNER - New
 $15,000Active0 Acres
10200 S Torrence Avenue, Chicago, IL 60617
MLS# 12650367Listed by: KELLER WILLIAMS PREFERRED REALTY - New
 $315,000Active1 beds 1 baths
111 S Morgan Street #620, Chicago, IL 60607
MLS# 12650500Listed by: COMPASS - New
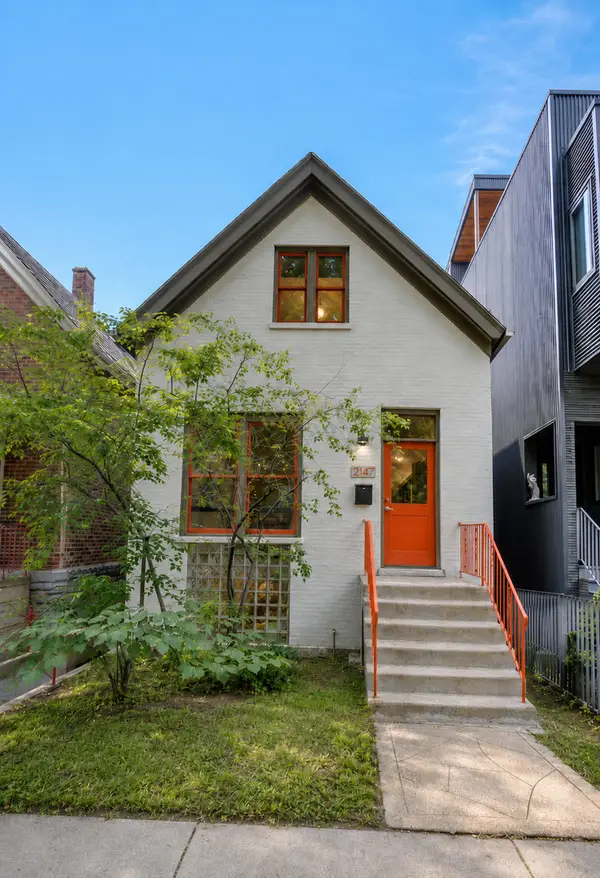 $1,250,000Active3 beds 4 baths
2147 N Claremont Avenue, Chicago, IL 60647
MLS# 12651524Listed by: COMPASS - New
 $799,900Active5 beds 4 baths
5320 N Moody Avenue, Chicago, IL 60630
MLS# 12653125Listed by: FULTON GRACE REALTY - New
 $599,000Active6 beds 4 baths
1302 W 31st Street, Chicago, IL 60608
MLS# 12658143Listed by: CROSS STREET REAL ESTATE - New
 $490,000Active5 beds 4 baths2,100 sq. ft.
8816 S Laflin Street, Chicago, IL 60620
MLS# 12658878Listed by: CENTURY 21 IMPACT - New
 $825,000Active2 beds 2 baths
1520 W Diversey Parkway #3, Chicago, IL 60614
MLS# 12659365Listed by: FULTON GRACE REALTY - New
 $349,900Active1 beds 1 baths750 sq. ft.
600 N Kingsbury Street #1005, Chicago, IL 60610
MLS# 12659812Listed by: REDFIN CORPORATION - New
 $255,000Active1 beds 1 baths950 sq. ft.
1503 S State Street #311, Chicago, IL 60605
MLS# 12659961Listed by: TOP CARE REALTY LLC - New
 $360,000Active3 beds 2 baths
6344 N Artesian Avenue #1, Chicago, IL 60659
MLS# 12664576Listed by: CENTURY 21 CIRCLE - New
 $695,000Active6 beds 3 baths
6122 W Leland Avenue, Chicago, IL 60630
MLS# 12664676Listed by: RE/MAX LOYALTY - New
 $25,000Active2 beds 1 baths1,100 sq. ft.
4850 S Lake Park Avenue #1605, Chicago, IL 60615
MLS# 12665267Listed by: LOIS WHITE REALTY - New
 $774,900Active4 beds 4 baths3,200 sq. ft.
6227 D S Ellis Avenue, Chicago, IL 60637
MLS# 12665597Listed by: @PROPERTIES CHRISTIE'S INTERNATIONAL REAL ESTATE - New
 $1,095,000Active3 beds 2 baths1,550 sq. ft.
211 N Harbor Drive #3309, Chicago, IL 60601
MLS# 12665602Listed by: JAMESON SOTHEBY'S INTL REALTY - New
 $224,900Active3 beds 2 baths1,334 sq. ft.
7949 S Manistee Avenue, Chicago, IL 60617
MLS# 12666824Listed by: CENTURY 21 S.G.R., INC.  $130,000Pending2 beds 2 baths1,081 sq. ft.
8449 S Kedzie Avenue #101, Chicago, IL 60652
MLS# 12666844Listed by: COLDWELL BANKER REALTY- New
 $385,000Active2 beds 1 baths839 sq. ft.
5758 N Moody Avenue, Chicago, IL 60646
MLS# 12667164Listed by: CHICAGOLAND BROKERS, INC. - New
 $599,900Active8 beds 4 baths
3206 W 66th Street, Chicago, IL 60629
MLS# 12667520Listed by: HOMESMART REALTY GROUP - New
 $499,900Active3 beds 3 baths
6034 N Bernard Street, Chicago, IL 60659
MLS# 12667929Listed by: COLDWELL BANKER - New
 $258,900Active4 beds 2 baths1,634 sq. ft.
12432 S State Street, Chicago, IL 60628
MLS# 12668019Listed by: RE/MAX MI CASA
Local realty services provided by:CENTURY 21 North East
Copyright 2026 Midwest Real Estate Data LLC. All rights reserved. The data relating to real estate for sale on this web site comes in part from the Broker Reciprocity Program of the Midwest Real Estate Data LLC. Listing information is deemed reliable but not guaranteed. MLSNI Member Broker: Nate Brown
Neighborhoods near Chicago, IL
Zip codes near Chicago, IL
- 60601 homes for sale
- 60602 homes for sale
- 60603 homes for sale
- 60604 homes for sale
- 60605 homes for sale
- 60606 homes for sale
- 60607 homes for sale
- 60608 homes for sale
- 60609 homes for sale
- 60612 homes for sale
- 60615 homes for sale
- 60616 homes for sale
- 60621 homes for sale
- 60623 homes for sale
- 60632 homes for sale
- 60636 homes for sale
- 60653 homes for sale
- 60654 homes for sale
- 60661 homes for sale
- 60669 homes for sale
Popular searches near Chicago, IL
- Berwyn homes for sale
- Brookfield homes for sale
- Burbank homes for sale
- Cicero homes for sale
- Evergreen Park homes for sale
- Forest Park homes for sale
- Hometown homes for sale
- Lyons homes for sale
- Maywood homes for sale
- North Riverside homes for sale
- Oak Lawn homes for sale
- Oak Park Township homes for sale
- Oak Park homes for sale
- River Forest homes for sale
- Riverside Township homes for sale
- Riverside homes for sale
- Stickney Township homes for sale
- Stickney homes for sale
- Summit homes for sale
- Summit Argo homes for sale
Protect your home and budget from life's surprises with an Assurant Home Warranty, backed by a partner that supports you through every step of homeownership. Explore Plans.
©2026 Century 21 Real Estate LLC. All rights reserved. CENTURY 21®, the CENTURY 21 Logo and C21® are service marks owned by Century 21 Real Estate LLC. Century 21 Real Estate LLC fully supports the principles of the Fair Housing Act and the Equal Opportunity Act. Each office is independently owned and operated. Listing information is deemed reliable but not guaranteed accurate.