- Bonita, Bonita homes for sale
- Castle Park, Chula Vista homes for sale
- Countryside, Chula Vista homes for sale
- Downtown Chula Vista, Chula Vista homes for sale
- Eastlake Greens, Chula Vista homes for sale
- EastLake Shores, Chula Vista homes for sale
- Heritage, Chula Vista homes for sale
- Heritage Hills, Chula Vista homes for sale
- Kenwood Village, Chula Vista homes for sale
- Millenia, Chula Vista homes for sale
- Montecito Ridge, Chula Vista homes for sale
- Ocean View Hills, San Diego homes for sale
- Otay Ranch, Chula Vista homes for sale
- Otay Ranch Village 3 North, Chula Vista homes for sale
- Rancho Del Rey, Chula Vista homes for sale
- San Miguel Ranch, Chula Vista homes for sale
- Sunbowl, Chula Vista homes for sale
- Terra Nova, Chula Vista homes for sale
- Village of Hillsborough, Chula Vista homes for sale
- Village of Montecito, Chula Vista homes for sale
Chula Vista, CA - homes for sale
142 of 142 results displayed
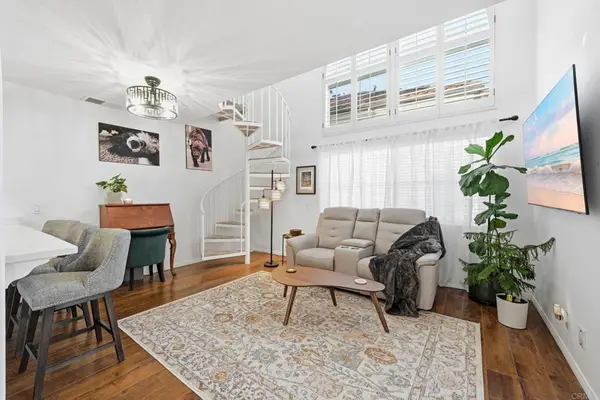
- Open Sat, 11am to 2pmNew
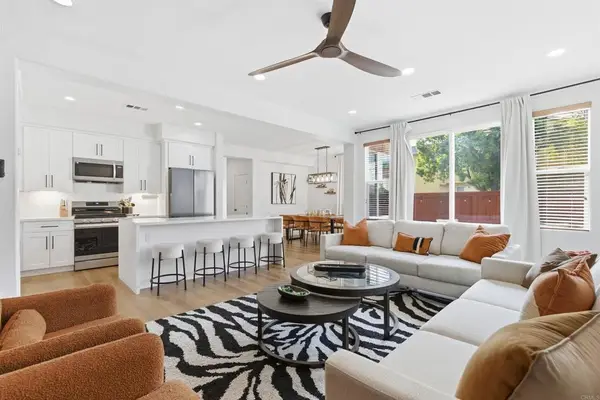
 $549,500Active2 beds 2 baths1,066 sq. ft.
1338 Nicolette #1032, Chula Vista, CA 91913
MLS# 260013540SDListed by: TORREY PINES DEVELOPMENT GROUP - New
 $689,000Active3 beds 3 baths1,500 sq. ft.
1449 Normandy Drive, Chula Vista, CA 91913
MLS# 260013413SDListed by: LPT REALTY,INC - New
 $419,900Active2 beds 2 baths936 sq. ft.
569 E Street #37, Chula Vista, CA 91910
MLS# PTP2604241Listed by: PREMIER AGENCY R.E. INC - Open Sat, 11am to 1pmNew
 $460,000Active2 beds 2 baths920 sq. ft.
1687 Melrose Ave #D, Chula Vista, CA 91911
MLS# 260013383SDListed by: DOUGLAS ELLIMAN OF CALIFORNIA, INC. - Coming Soon
 $520,000Coming Soon2 beds 2 baths
Address Withheld By Seller, Chula Vista, CA 91910
MLS# 260013347SDListed by: RAY ALCANTARA, BROKER - Coming Soon
 $625,000Coming Soon3 beds 2 baths
1338 Nicolette Avenue #1011, Chula Vista, CA 91913
MLS# PTP2604199Listed by: COLDWELL BANKER WEST - Open Sat, 12 to 3pmNew
 $555,000Active3 beds 2 baths1,186 sq. ft.
4095 Bonita Rd #228, Bonita, CA 91902
MLS# PTP2604172Listed by: ROMO REALTY - New
 $600,000Active2 beds 2 baths1,034 sq. ft.
717 Caminito Valiente, Chula Vista, CA 91911
MLS# IG26117539Listed by: KW COLLEGE PARK - Open Sat, 11am to 1pmNew
 $599,000Active2 beds 3 baths1,292 sq. ft.
1811 Lime Ct #1, Chula Vista, CA 91913
MLS# 260013072SDListed by: JAG REAL ESTATE LIFESTYLE - New
 $389,000Active1 beds 1 baths621 sq. ft.
279 Moss St #10, Chula Vista, CA 91911
MLS# 260013052SDListed by: REAL BROKER - New
 $725,000Active4 beds 3 baths1,623 sq. ft.
784 Mateo #1, Chula Vista, CA 91911
MLS# NP26116586Listed by: THE VANTAGE REAL ESTATE GROUP, - Open Sat, 12 to 3pmNew
 $699,000Active3 beds 2 baths1,471 sq. ft.
1431 Caminito Capistrano #3, Chula Vista, CA 91913
MLS# PTP2604094Listed by: COLDWELL BANKER WEST  $449,000Pending2 beds 2 baths900 sq. ft.
285 Moss Street #32, Chula Vista, CA 91911
MLS# PTP2604095Listed by: CA-RES- New
 $765,000Active4 beds 3 baths1,810 sq. ft.
1543 Caminito Cremona, Chula Vista, CA 91915
MLS# NDP2605128Listed by: COLDWELL BANKER REALTY - Open Sat, 11am to 2pmNew
 $575,000Active2 beds 3 baths1,182 sq. ft.
1999 Affinity Lane, Chula Vista, CA 91915
MLS# PTP2604072Listed by: REAL BROKER  $600,000Pending2 beds 2 baths1,028 sq. ft.
1819 Via Capri, Chula Vista, CA 91913
MLS# PTP2604067Listed by: REAL BROKER- New
 $539,000Active2 beds 3 baths1,235 sq. ft.
1760 E Palomar #101, Chula Vista, CA 91913
MLS# 260012813SDListed by: EXP REALTY OF SOUTHERN CALIFORNIA, INC. - Open Sat, 11am to 2pmNew
 $725,000Active3 beds 2 baths1,433 sq. ft.
2170 Birch #109, Chula Vista, CA 91915
MLS# PT26113975Listed by: THE KASA AGENCY INC - New
 $499,999Active3 beds 2 baths1,296 sq. ft.
1434 Hilltop Drive #30, Chula Vista, CA 91911
MLS# NDP2605019Listed by: EXP REALTY GREATER LOS ANGELES  $800,000Pending4 beds 4 baths1,828 sq. ft.
1404 Santa Victoria Road #1, Chula Vista, CA 91913
MLS# PTP2603984Listed by: KELLER WILLIAMS LA JOLLA- Open Sat, 1 to 3pm
 $485,000Active2 beds 2 baths1,024 sq. ft.
415 Woodlawn Ave #D, Chula Vista, CA 91910
MLS# 260012473SDListed by: RENOVATION REALTY  $589,000Active2 beds 2 baths1,032 sq. ft.
1892 Miner Creek #1, Chula Vista, CA 91913
MLS# 260012344SDListed by: ONE PERCENT LISTING GROUP, INC $648,000Pending3 beds 3 baths1,321 sq. ft.
1126 Latigo #3, Chula Vista, CA 91915
MLS# PTP2603900Listed by: COLDWELL BANKER WEST $489,000Active2 beds 2 baths1,144 sq. ft.
550 Park Way #04, Chula Vista, CA 91910
MLS# 260012271SDListed by: 4 HOME SALES REALTY $719,000Active3 beds 2 baths1,407 sq. ft.
1277 Calle Pomelo #3, Chula Vista, CA 91913
MLS# 260012193SDListed by: LPT REALTY,INC $525,000Pending2 beds 2 baths1,045 sq. ft.
730 Brookstone Rd. #201, Chula Vista, CA 91913
MLS# 260012166SDListed by: I2I REAL ESTATE AND MORTGAGE, $738,000Pending4 beds 4 baths1,819 sq. ft.
1952 Pavilion Lane, Chula Vista, CA 91915
MLS# PTP2603838Listed by: COLDWELL BANKER WEST- Open Sat, 11am to 2pm
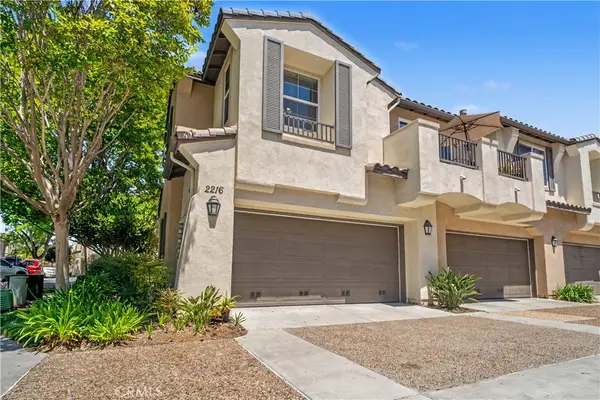
 $645,000Active3 beds 2 baths1,296 sq. ft.
2216 Caminito Livorno #1, Chula Vista, CA 91915
MLS# SW26107957Listed by: CENTURY 21 MASTERS 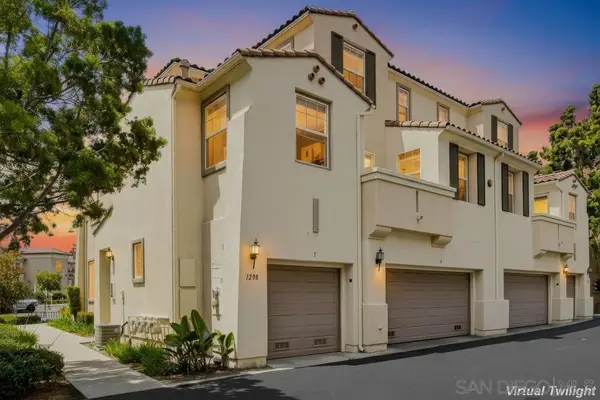 $569,000Active2 beds 2 baths1,071 sq. ft.
1298 Fools Gold #1, Chula Vista, CA 91913
MLS# 260011935SDListed by: REAL BROKER $665,000Active3 beds 4 baths1,561 sq. ft.
1622 Gila Ct #172, Chula Vista, CA 91915
MLS# 260011928SDListed by: COMPASS $580,000Active2 beds 3 baths1,062 sq. ft.
2860 Athens Road #6, Chula Vista, CA 91915
MLS# PTP2603756Listed by: LPT REALTY, INC.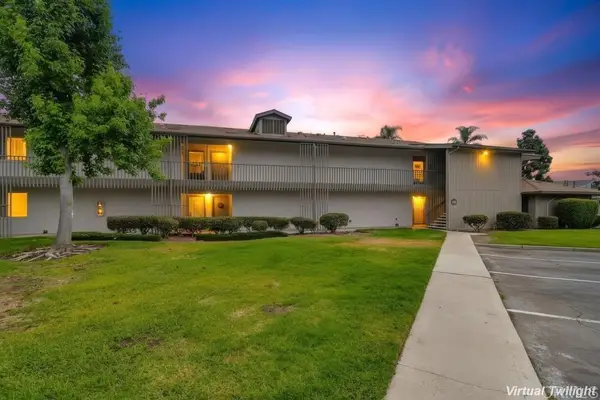 $399,000Pending1 beds 1 baths766 sq. ft.
4201 Bonita Road #253, Bonita, CA 91902
MLS# PTP2603746Listed by: REAL BROKER- Open Sat, 12 to 3pm
 $615,000Active3 beds 2 baths1,315 sq. ft.
1880 Aubrives Place #2126, Chula Vista, CA 91913
MLS# PTP2603722Listed by: COMPASS 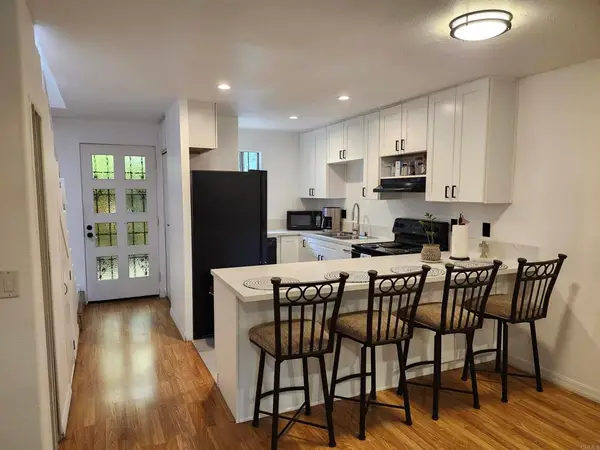 $469,995Active2 beds 2 baths966 sq. ft.
170 E Street #D5, Chula Vista, CA 91910
MLS# PTP2603728Listed by: ROA CALIFORNIA INC $689,000Active3 beds 3 baths1,471 sq. ft.
1367 Caminito Capistrano, Chula Vista, CA 91913
MLS# PW26085198Listed by: THE AGENCY- Open Sun, 1:30 to 4pm
 $899,000Active4 beds 3 baths2,375 sq. ft.
2284 Red Leaf Lane, Chula Vista, CA 91915
MLS# PTP2603693Listed by: HOMESMART REALTY WEST 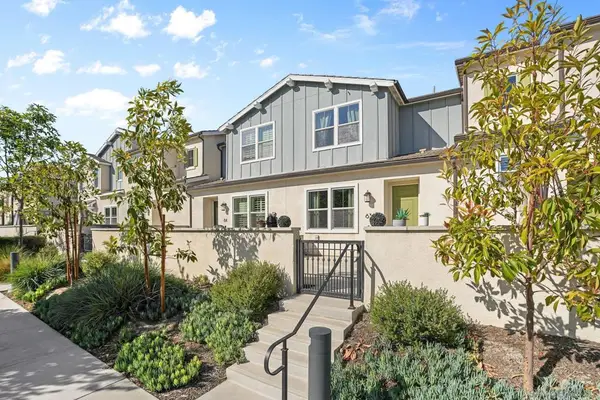 $649,999Pending3 beds 3 baths1,278 sq. ft.
1985 Paseo Cultura #63, Chula Vista, CA 91913
MLS# 260011635SDListed by: COLDWELL BANKER WEST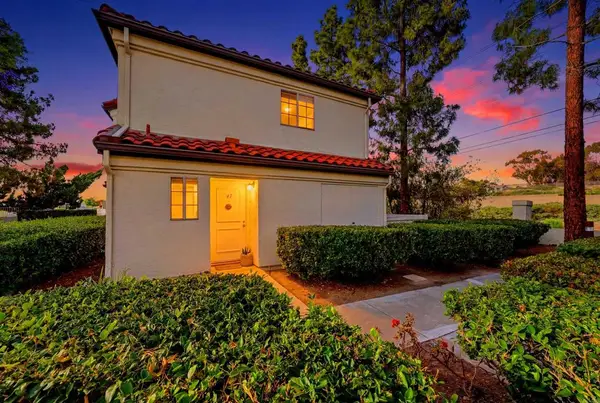 $449,999Active1 beds 2 baths669 sq. ft.
719 Eastshore Ter #47, Chula Vista, CA 91913
MLS# PTP2603658Listed by: EXP REALTY OF CALIFORNIA, INC.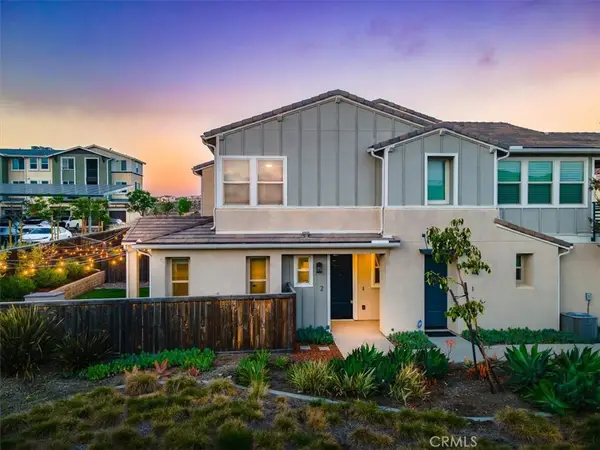 $740,000Active4 beds 3 baths1,736 sq. ft.
1233 Calle Pomelo #2, Chula Vista, CA 91913
MLS# IG26103962Listed by: BERKSHIRE HATHAWAY HOMESERVICES CALIFORNIA REALTY $619,900Active3 beds 2 baths1,096 sq. ft.
783 Brookstone Road #104, Chula Vista, CA 91913
MLS# PTP2603642Listed by: COLDWELL BANKER WEST $559,900Pending2 beds 3 baths1,143 sq. ft.
858 Kili Street #1, Chula Vista, CA 91911
MLS# 260011455SDListed by: MARK SCHULTZ BROKER $706,900Active4 beds 3 baths1,680 sq. ft.
881 Obediah Loop #3, Chula Vista, CA 91911
MLS# 260011457SDListed by: MARK SCHULTZ BROKER $676,900Pending4 beds 3 baths1,320 sq. ft.
895 Jude Drive #6, Chula Vista, CA 91911
MLS# 260011458SDListed by: MARK SCHULTZ BROKER $599,995Active2 beds 3 baths1,192 sq. ft.
2015 Mindoro Lane #2, Chula Vista, CA 91915
MLS# PTP2603637Listed by: FINEST CITY HOMES $589,000Active3 beds 2 baths1,180 sq. ft.
1565 Mendocino Drive #179, Chula Vista, CA 91911
MLS# PTP2603636Listed by: ROA CALIFORNIA INC $610,900Active2 beds 2 baths1,334 sq. ft.
2285 Whistling Ln, Chula Vista, CA 91915
MLS# PTP2603611Listed by: COLDWELL BANKER WEST $699,999Active4 beds 3 baths1,782 sq. ft.
778 Ada Street #1, Chula Vista, CA 91911
MLS# 26832237Listed by: RESIDENT GROUP $619,900Active3 beds 2 baths1,166 sq. ft.
761 Brookstone #102, Chula Vista, CA 91913
MLS# 260011265SDListed by: LEADING MORTGAGE SOLUTIONS $549,900Pending2 beds 2 baths920 sq. ft.
400 Sanibelle #1, Chula Vista, CA 91910
MLS# PTP2603509Listed by: BAYFRONT REAL ESTATE $490,000Pending2 beds 2 baths997 sq. ft.
166 Third Ave #4, Chula Vista, CA 91910
MLS# PTP2603487Listed by: COLDWELL BANKER WEST $555,000Pending3 beds 2 baths1,200 sq. ft.
39 Tamarindo Way #1, Chula Vista, CA 91911
MLS# PTP2603452Listed by: AXIA REAL ESTATE GROUP, INC $765,000Pending4 beds 3 baths1,689 sq. ft.
2208 Trevi Cir, Chula Vista, CA 91913
MLS# 260010857SDListed by: KELLER WILLIAMS SAN DIEGO METRO $799,500Active4 beds 3 baths1,827 sq. ft.
2092 Tango Loop #2, Chula Vista, CA 91915
MLS# 260010792SDListed by: VIP REALTY CALIFORNIA, PC $620,000Active2 beds 3 baths1,243 sq. ft.
1875 Champagne Court #9, Chula Vista, CA 91913
MLS# PTP2603374Listed by: VILLAMAR INTERNATIONAL, CORP- New
 $730,000Active3 beds 3 baths1,710 sq. ft.
1926 Corte Agata #140, Chula Vista, CA 91913
MLS# PTP2604297Listed by: CA-RES 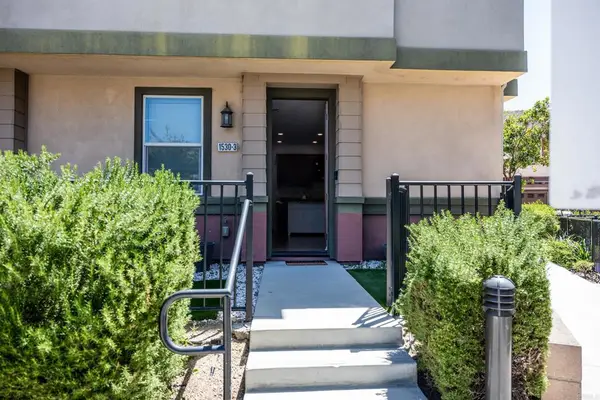 $654,900Active4 beds 2 baths1,437 sq. ft.
1530 Winter Ln #3, Chula Vista, CA 91915
MLS# PTP2603346Listed by: EMPIRE REAL ESTATE CONSULTANTS- Open Sat, 12 to 2pm
 $570,000Active2 beds 3 baths1,230 sq. ft.
1241 Santa Cora Avenue #130, Chula Vista, CA 91913
MLS# PTP2603302Listed by: REALTY EXECUTIVES DILLON  $830,000Pending3 beds 3 baths1,220 sq. ft.
907 Caminito Estrella, Chula Vista, CA 91910
MLS# PTP2603267Listed by: COLDWELL BANKER WEST $570,000Pending3 beds 2 baths1,212 sq. ft.
238 Regency Ct #C, Chula Vista, CA 91910
MLS# 260010353SDListed by: DREAM HOME REALTY AND LENDING $625,000Pending3 beds 3 baths1,400 sq. ft.
1545 Sonora #231, Chula Vista, CA 91911
MLS# 260010160SDListed by: REDFIN CORPORATION $709,000Pending3 beds 3 baths1,578 sq. ft.
2041 Bluestone Circle, Chula Vista, CA 91913
MLS# 260010169SDListed by: LPT REALTY,INC $629,999Active3 beds 3 baths1,412 sq. ft.
2710 Apricot Court, Chula Vista, CA 91915
MLS# PTP2603185Listed by: SHOPPINGSDHOUSES $689,000Pending4 beds 4 baths1,719 sq. ft.
1430 Heron Street #4, Chula Vista, CA 91913
MLS# PTP2603170Listed by: ROA CALIFORNIA INC $585,000Pending2 beds 2 baths1,025 sq. ft.
1232 Madrigal Court, Chula Vista, CA 91910
MLS# PTP2603163Listed by: SAN DIEGO REAL ESTATE & LOANS $425,000Active2 beds 1 baths812 sq. ft.
626 J Street #37, Chula Vista, CA 91910
MLS# 260008244SDListed by: COLDWELL BANKER REALTY $663,000Active3 beds 3 baths1,278 sq. ft.
1927 Corte Agata #163, Chula Vista, CA 91913
MLS# PTP2603034Listed by: LPT REALTY, INC. $529,900Pending2 beds 2 baths1,229 sq. ft.
1516 Concord Way Unit D, Chula Vista, CA 91911
MLS# 260009504SDListed by: COLDWELL BANKER REALTY $699,000Pending4 beds 4 baths1,652 sq. ft.
2790 Sparta Rd #12, Chula Vista, CA 91915
MLS# 260009477SDListed by: FINEST CITY HOMES & LOANS $565,000Active2 beds 2 baths956 sq. ft.
773 Brookstone #104, Chula Vista, CA 91913
MLS# 260009473SDListed by: CATCH REAL ESTATE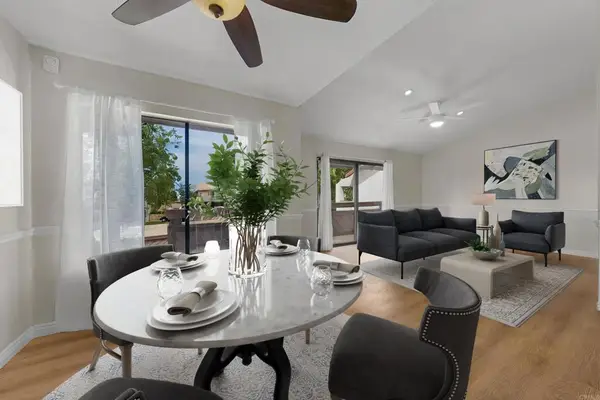 $399,000Active2 beds 1 baths889 sq. ft.
1679 Melrose Avenue #H, Chula Vista, CA 91911
MLS# PTP2602968Listed by: COMPASS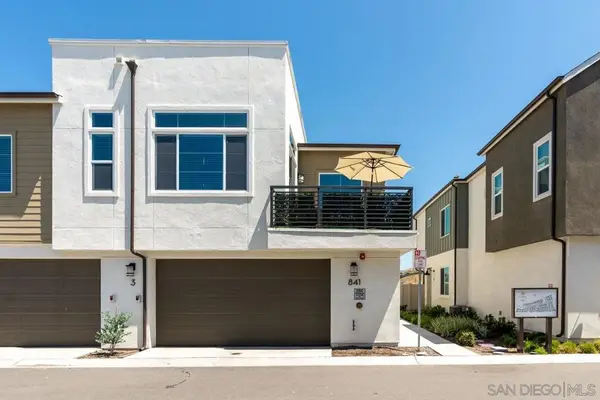 $729,000Active3 beds 2 baths1,507 sq. ft.
841 Hana Ave #3, Chula Vista, CA 91911
MLS# 260009363SDListed by: BERKSHIRE HATHAWAY HOMESERVICES CALIFORNIA PROPERTIES- New
 $495,000Active2 beds 2 baths896 sq. ft.
160 E St. #c-1, Chula Vista, CA 91910
MLS# PTP2604177Listed by: BRIDGEVIEW REALTY - Open Sat, 2 to 5pm
 $515,000Active2 beds 2 baths1,003 sq. ft.
110 N 2nd Avenue #30, Chula Vista, CA 91910
MLS# PTP2602915Listed by: TEAM Z REALTY 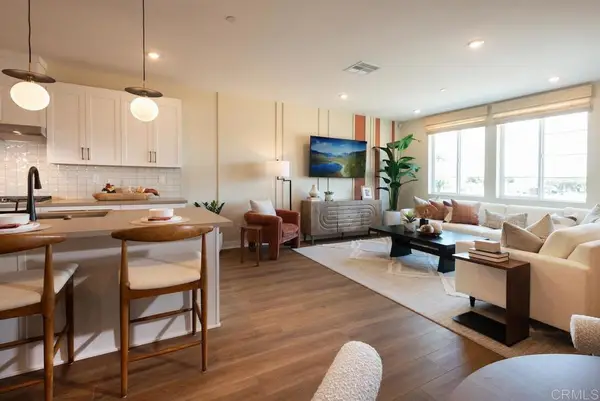 $763,900Active3 beds 3 baths1,696 sq. ft.
511 Avenida Centro #103, Chula Vista, CA 91910
MLS# NDP2603710Listed by: CALIFORNIA WEST REALTY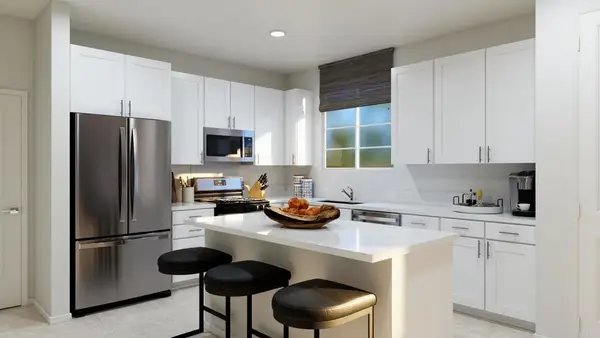 $763,900Pending3 beds 3 baths1,741 sq. ft.
511 Avenida Centro #106, Chula Vista, CA 91910
MLS# NDP2603711Listed by: CALIFORNIA WEST REALTY $589,900Pending2 beds 2 baths1,025 sq. ft.
1259 El Cortez Court, Chula Vista, CA 91910
MLS# PTP2602889Listed by: COLDWELL BANKER WEST $415,000Pending2 beds 2 baths936 sq. ft.
178 4th Ave #2, Chula Vista, CA 91910
MLS# 260009185SDListed by: EXP REALTY OF SOUTHERN CALIFORNIA, INC. $575,000Active2 beds 3 baths1,270 sq. ft.
1241 Santa Cora Ave #329, Chula Vista, CA 91913
MLS# PTP2602849Listed by: CENTURY 21 AFFILIATED $425,000Active2 beds 1 baths812 sq. ft.
709 Madison, Chula Vista, CA 91910
MLS# 260009020SDListed by: THE GREENHOUSE GROUP INC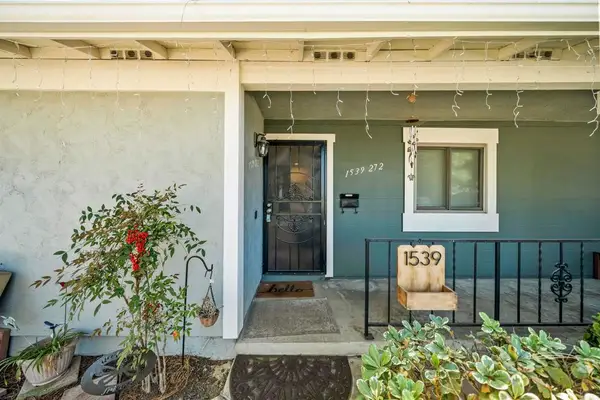 $539,900Pending2 beds 2 baths1,070 sq. ft.
1539 Sonora Drive #272, Chula Vista, CA 91911
MLS# PTP2602834Listed by: REAL BROKER- Open Sun, 11am to 1pm
 $799,000Active3 beds 2 baths2,185 sq. ft.
2095 Bravo Loop #4, Chula Vista, CA 91915
MLS# SR26079533Listed by: MILLS REALTY OF CALIFORNIA - Open Sat, 1 to 3pm
 $735,000Active4 beds 3 baths1,681 sq. ft.
1939 Strata St., Chula Vista, CA 91915
MLS# 260008849SDListed by: I2I REAL ESTATE AND MORTGAGE,  $595,000Pending3 beds 3 baths1,412 sq. ft.
2725 Apricot Court, Chula Vista, CA 91915
MLS# PTP2602771Listed by: REAL BROKER $649,900Active3 beds 2 baths1,166 sq. ft.
783 Brookstone Road #101, Chula Vista, CA 91913
MLS# PTP2602765Listed by: COASTAL PROPERTY GROUP, INC $519,999Pending2 beds 2 baths1,006 sq. ft.
814 Tamayo Drive #2, Chula Vista, CA 91910
MLS# PTP2602751Listed by: COLDWELL BANKER WEST $689,900Active2 beds 3 baths1,424 sq. ft.
511 Avenida Centro #104, Chula Vista, CA 91910
MLS# NDP2603494Listed by: CALIFORNIA WEST REALTY $637,900Pending2 beds 3 baths1,126 sq. ft.
515 Avenida Centro #105, Chula Vista, CA 91910
MLS# NDP2603465Listed by: CALIFORNIA WEST REALTY $449,988Active3 beds 2 baths1,224 sq. ft.
471 Fourth Avenue #I, Chula Vista, CA 91910
MLS# PTP2602692Listed by: BLACK LABEL REALTY $599,000Pending2 beds 2 baths1,163 sq. ft.
1529 El Prado Street #1, Chula Vista, CA 91913
MLS# PTP2602682Listed by: COLDWELL BANKER WEST $499,900Pending2 beds 2 baths1,125 sq. ft.
205 Camlau Drive #C, Chula Vista, CA 91911
MLS# PTP2602621Listed by: FINEST CITY HOMES $660,000Active3 beds 2 baths1,515 sq. ft.
75 Third Avenue #20, Chula Vista, CA 91910
MLS# 260008108SDListed by: TEAM METRO $579,900Active3 beds 2 baths1,166 sq. ft.
2077 Lakeridge Circle #104, Chula Vista, CA 91913
MLS# 260007849SDListed by: COMPASS $700,000Active3 beds 3 baths1,583 sq. ft.
1294 Santa Victoria Road #2, Chula Vista, CA 91913
MLS# PTP2602487Listed by: COLDWELL BANKER WEST- Open Sat, 11am to 2pm
 $474,000Active1 beds 2 baths669 sq. ft.
744 Eastshore Ter. #102, Chula Vista, CA 91913
MLS# NDP2603082Listed by: FATHOM REALTY GROUP, INC  $699,000Pending3 beds 3 baths1,396 sq. ft.
2175 Condor Drive #56, Chula Vista, CA 91915
MLS# CRPTP2602398Listed by: THE FLOWERS REALTY INC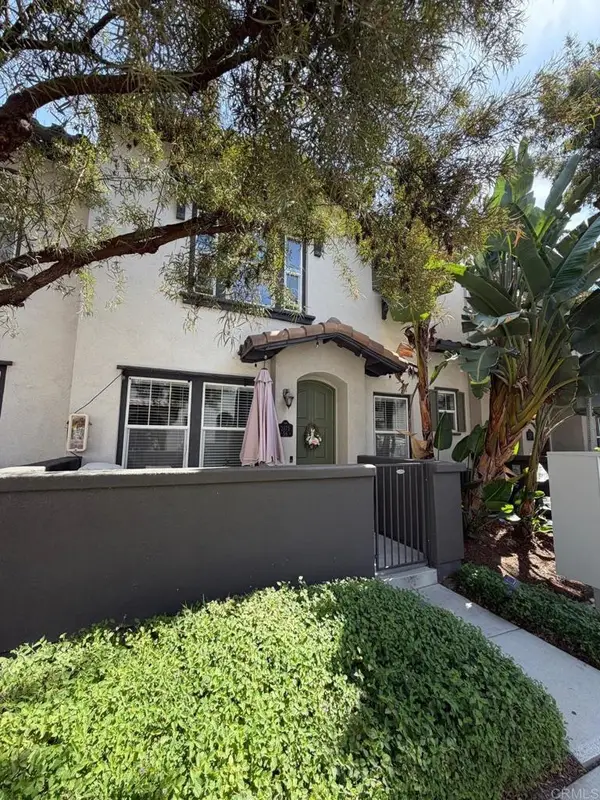 $699,000Pending3 beds 3 baths1,396 sq. ft.
2175 Condor Drive #56, Chula Vista, CA 91915
MLS# PTP2602398Listed by: THE FLOWERS REALTY INC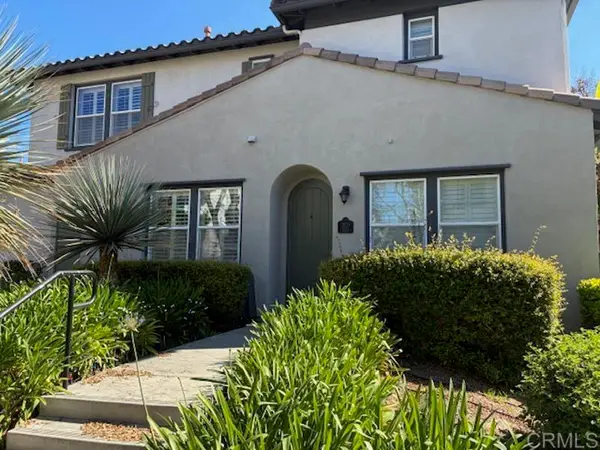 $619,000Pending2 beds 3 baths1,279 sq. ft.
2170 Bobcat Court #123, Chula Vista, CA 91915
MLS# PTP2602351Listed by: SHERRY PROPERTIES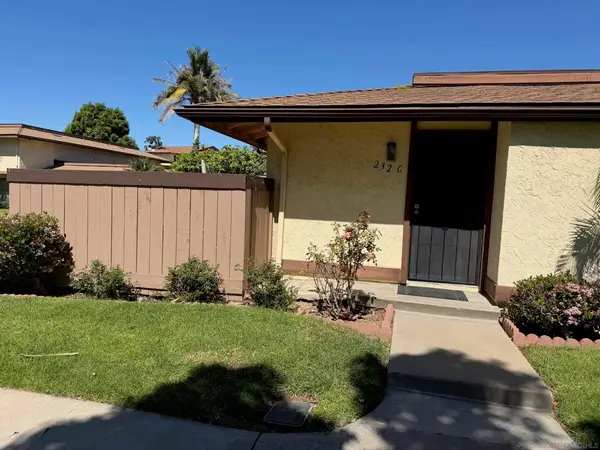 $499,900Pending2 beds 1 baths900 sq. ft.
232 Otay Valley Rd #C, Chula Vista, CA 91911
MLS# 260007332SDListed by: AARE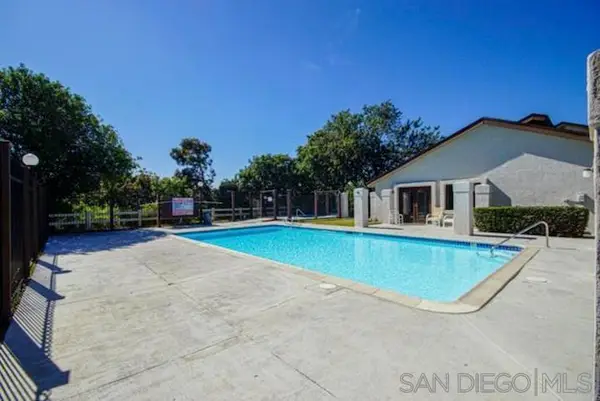 $387,999Pending2 beds 2 baths920 sq. ft.
1691 Melrose Ave H, Chula Vista, CA 91911
MLS# 260007314SDListed by: CENTURY HOMES $788,000Pending4 beds 4 baths1,816 sq. ft.
1812 Mint Terrace #Unit 2, Chula Vista, CA 91915
MLS# PTP2602165Listed by: GOLD COAST REAL ESTATE $569,900Pending3 beds 2 baths1,315 sq. ft.
1853 Rue Bienville #836, Chula Vista, CA 91913
MLS# SW26058482Listed by: SIMPLIHOM $375,000Pending1 beds 1 baths700 sq. ft.
490 Fourth Ave #32, Chula Vista, CA 91910
MLS# 260006258SDListed by: WEICHERT SOCAL $355,000Active1 beds 1 baths550 sq. ft.
201 Twin Oaks #2, Chula Vista, CA 91910
MLS# RS26050569Listed by: CRISTAL REAL ESTATE GROUP- Open Sat, 1 to 4pm
 $639,900Active2 beds 3 baths1,438 sq. ft.
1291 Blue Jean Way Unit 4, Chula Vista, CA 91913
MLS# PTP2601958Listed by: COLDWELL BANKER WEST  $495,000Active2 beds 2 baths936 sq. ft.
569 E Street #30, Chula Vista, CA 91910
MLS# PTP2601933Listed by: SHOPPINGSDHOUSES $915,000Pending3 beds 4 baths2,670 sq. ft.
1812 Lynx Ter, Chula Vista, CA 91915
MLS# 260005687SDListed by: LPT REALTY,INC $530,000Pending3 beds 1 baths1,053 sq. ft.
1565 Mendocino Dr #164, Chula Vista, CA 91911
MLS# 260005565SDListed by: CA-RES $465,000Pending2 beds 2 baths1,024 sq. ft.
429 Colorado Avenue #A, Chula Vista, CA 91910
MLS# PTP2603535Listed by: COLDWELL BANKER WEST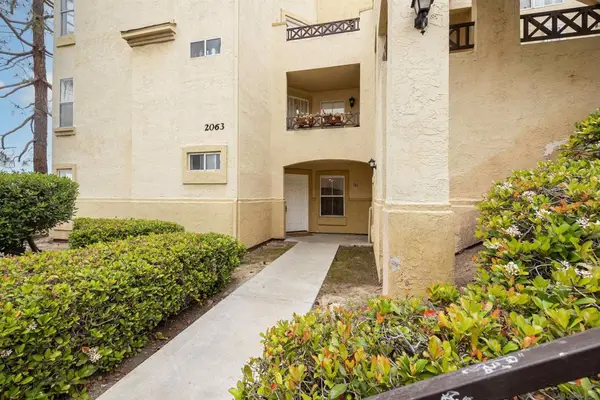 $525,000Active2 beds 2 baths1,037 sq. ft.
2063 Lakeridge Circle #101, Chula Vista, CA 91913
MLS# 260005407SDListed by: AARON LUCHANS REAL ESTATE BRKR $459,000Pending2 beds 2 baths1,000 sq. ft.
149 Fourth Av #17, Chula Vista, CA 91910
MLS# PTP2601731Listed by: COLDWELL BANKER WEST $799,900Pending3 beds 2 baths1,621 sq. ft.
1774 Camino Strava, Chula Vista, CA 91913
MLS# NDP2602130Listed by: CALIFORNIA WEST REALTY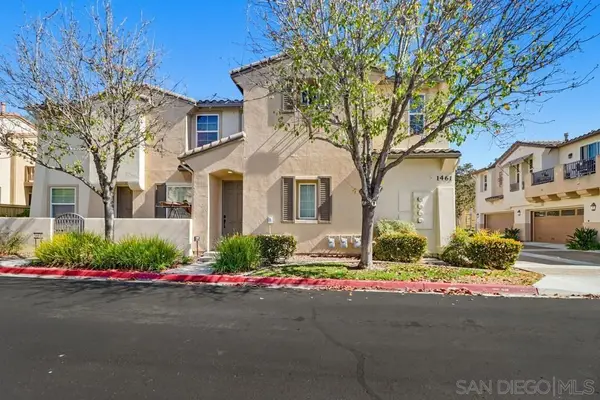 $655,000Pending3 beds 2 baths1,296 sq. ft.
1461 Caminito Sardinia #1, Chula Vista, CA 91915
MLS# 260005079SDListed by: COLDWELL BANKER WEST $639,900Pending3 beds 3 baths1,471 sq. ft.
798 Caminito Francisco Unit #3, Chula Vista, CA 91913
MLS# PTP2601557Listed by: CENTURY 21 AFFILIATED $550,000Active2 beds 2 baths1,045 sq. ft.
2011 Lakeridge Circle #304, Chula Vista, CA 91913
MLS# PTP2601527Listed by: COLDWELL BANKER WEST $429,900Pending2 beds 1 baths854 sq. ft.
532 Anita Street #112, Chula Vista, CA 91911
MLS# PTP2601431Listed by: CRABTREE REAL ESTATE GROUP $650,000Pending2 beds 3 baths1,458 sq. ft.
2232 Huntington Point Road #53, Chula Vista, CA 91914
MLS# PTP2601327Listed by: SD REAL ESTATE $385,000Active1 beds 1 baths572 sq. ft.
242 E Street Street, Chula Vista, CA 91910
MLS# PTP2601308Listed by: ROA CALIFORNIA INC $458,000Active2 beds 2 baths963 sq. ft.
617 3rd Avenue #14, Chula Vista, CA 91910
MLS# PTP2601212Listed by: CA-RES $499,500Active2 beds 2 baths1,150 sq. ft.
4201 Bonita Road #242, Bonita, CA 91902
MLS# PTP2601196Listed by: DRW SERVICES GROUP, INC. $349,000Active2 beds 1 baths864 sq. ft.
471 Fourth Avenue #B, Chula Vista, CA 91910
MLS# PTP2601033Listed by: COMPASS $345,000Active1 beds 1 baths621 sq. ft.
285 Moss #9, Chula Vista, CA 91911
MLS# 260001322SDListed by: COMMUNITY REALTY GROUP $669,000Pending3 beds 3 baths1,505 sq. ft.
1279 Gorge Run Way #3, Chula Vista, CA 91913
MLS# 260001316SDListed by: ONE PERCENT LISTING GROUP, INC $837,000Pending4 beds 3 baths1,725 sq. ft.
843 Caminito Las Olas, Chula Vista, CA 91911
MLS# 250045759SDListed by: RAY ALCANTARA, BROKER $433,000Pending2 beds 1 baths812 sq. ft.
630 1/2 J St, Chula Vista, CA 91910
MLS# 250045094SDListed by: OPENDOOR BROKERAGE INC. $678,000Pending3 beds 3 baths1,504 sq. ft.
1665 Santa Alexia Avenue #1, Chula Vista, CA 91913
MLS# CRPTP2601735Listed by: COLDWELL BANKER WEST $550,000Active2 beds 2 baths1,043 sq. ft.
1386 Serena Circle #1, Chula Vista, CA 91910
MLS# PTP2508696Listed by: COLDWELL BANKER WEST $629,999Pending3 beds 3 baths1,412 sq. ft.
2710 Apricot Court, Chula Vista, CA 91915
MLS# PTP2508253Listed by: SHOPPINGSDHOUSES $619,900Active3 beds 3 baths1,342 sq. ft.
380 Callesita Mariola, Chula Vista, CA 91914
MLS# 250039187SDListed by: THE AGENCY $767,999Active4 beds 3 baths1,741 sq. ft.
2304 Trevi Cir, Chula Vista, CA 91913
MLS# PTP2601307Listed by: COLDWELL BANKER WEST $810,000Pending4 beds 4 baths2,189 sq. ft.
1704 Frangipani Avenue, Chula Vista, CA 91913
MLS# 250038858SDListed by: COMPASS $395,000Active2 beds 2 baths1,004 sq. ft.
1420 Hilltop Drive #301, Chula Vista, CA 91911
MLS# NDP2508949Listed by: REAL BROKER $675,000Pending3 beds 2 baths1,437 sq. ft.
1512 Champion Lane #4, Chula Vista, CA 91915
MLS# NDP2600399Listed by: STREXIN REAL ESTATE $883,900Active3 beds 3 baths2,226 sq. ft.
1778 Camino Strava, Chula Vista, CA 91913
MLS# NDP2505874Listed by: CALIFORNIA WEST REALTY $596,900Pending2 beds 3 baths1,141 sq. ft.
848 Makani #2, Chula Vista, CA 91911
MLS# 250030635SDListed by: MARK SCHULTZ BROKER $579,900Pending3 beds 2 baths1,315 sq. ft.
1875 Baudouin Place #1731, Chula Vista, CA 91913
MLS# PTP2504234Listed by: SOCAL EREALTY $590,900Pending2 beds 3 baths1,209 sq. ft.
852 Makani Street #7, Chula Vista, CA 91911
MLS# 250029207SDListed by: MARK SCHULTZ BROKER $594,900Pending2 beds 2 baths956 sq. ft.
773 Brookstone Rd #304, Chula Vista, CA 91913
MLS# 250027821SDListed by: MILITARY MUTUAL $670,000Active3 beds 3 baths1,285 sq. ft.
624 Corte Patio #81, Chula Vista, CA 91914
MLS# NP25080873Listed by: RE/MAX NEW DIMENSION $469,000Pending2 beds 2 baths1,007 sq. ft.
4095 Bonita Road #229, Bonita, CA 91902
MLS# CRPTP2501456Listed by: KELLER WILLIAMS REALTY $500,000Active2 beds 2 baths1,224 sq. ft.
376 Center St #304, Chula Vista, CA 91910
MLS# 240016533SDListed by: FAMILIAR REAL ESTATE $500,000Active3 beds 2 baths1,224 sq. ft.
471 Fourth Avenue, Chula Vista, CA 91910
MLS# PTP2404180Listed by: ACROPOLIS ENTERPRISE $520,000Pending2 beds 2 baths1,050 sq. ft.
749 Brookstone Road #101, Chula Vista, CA 91913
MLS# 230011308SDListed by: GOLDEN VINE REAL ESTATE
Local realty services provided by:CENTURY 21 Discovery, CENTURY 21 Wildwood Properties, Inc., CENTURY 21 Masters
The information being provided by California Regional MLS (Southern California) is for the consumer's personal, non-commercial use and may not be used for any purpose other than to identify prospective properties consumer may be interested in purchasing. Any information relating to real estate for sale referenced on this web site comes from the Internet Data Exchange (IDX) program of the California Regional MLS (Southern California). CENTURY 21 Discovery is not a Multiple Listing Service (MLS), nor does it offer MLS access. This website is a service of CENTURY 21 Discovery, a broker participant of California Regional MLS (Southern California). This web site may reference real estate listing(s) held by a brokerage firm other than the broker and/or agent who owns this web site.
The accuracy of all information, regardless of source, including but not limited to open house information, square footages and lot sizes, is deemed reliable but not guaranteed and should be personally verified through personal inspection by and/or with the appropriate professionals. The data contained herein is copyrighted by California Regional MLS (Southern California) and is protected by all applicable copyright laws. Any unauthorized dissemination of this information is in violation of copyright laws and is strictly prohibited.
Copyright 2021 California Regional MLS (Southern California). All rights reserved. CRMLS Member Broker: Stephanie Goedl
This information is deemed reliable but not guaranteed. You should rely on this information only to decide whether or not to further investigate a particular property. BEFORE MAKING ANY OTHER DECISION, YOU SHOULD PERSONALLY INVESTIGATE THE FACTS (e.g. square footage and lot size) with the assistance of an appropriate professional. You may use this information only to identify properties you may be interested in investigating further. All uses except for personal, non-commercial use in accordance with the foregoing purpose are prohibited. Redistribution or copying of this information, any photographs or video tours is strictly prohibited. This information is derived from the Internet Data Exchange (IDX) service provided by San Diego MLS®. Displayed property listings may be held by a brokerage firm other than the broker and/or agent responsible for this display. The information and any photographs and video tours and the compilation from which they are derived is protected by copyright. Compilation © 2020 San Diego MLS®, Inc. SANDICOR Member Broker: Randy Thompson
Neighborhoods near Chula Vista, CA
Zip codes near Chula Vista, CA
- 91902 homes for sale
- 91910 homes for sale
- 91911 homes for sale
- 91913 homes for sale
- 91914 homes for sale
- 91915 homes for sale
- 91932 homes for sale
- 91941 homes for sale
- 91945 homes for sale
- 91950 homes for sale
- 91977 homes for sale
- 91978 homes for sale
- 92102 homes for sale
- 92105 homes for sale
- 92113 homes for sale
- 92114 homes for sale
- 92118 homes for sale
- 92139 homes for sale
- 92154 homes for sale
- 92173 homes for sale
Popular searches near Chula Vista, CA
- Bonita homes for sale
- Bostonia homes for sale
- Casa De Oro-Mount Helix homes for sale
- Coronado homes for sale
- Crest homes for sale
- El Cajon homes for sale
- Granite Hills homes for sale
- Imperial Beach homes for sale
- Jamul homes for sale
- La Mesa homes for sale
- La Presa homes for sale
- Lemon Grove homes for sale
- National City homes for sale
- Otay Mesa homes for sale
- Rancho San Diego homes for sale
- San Diego homes for sale
- San Ysidro homes for sale
- Santee homes for sale
- Spring Valley homes for sale
- Winter Gardens homes for sale
Protect your home and budget from life's surprises with an Assurant Home Warranty, backed by a partner that supports you through every step of homeownership. Explore Plans.
©2026 Century 21 Real Estate LLC. All rights reserved. CENTURY 21®, the CENTURY 21 Logo and C21® are service marks owned by Century 21 Real Estate LLC. Century 21 Real Estate LLC fully supports the principles of the Fair Housing Act and the Equal Opportunity Act. Each office is independently owned and operated. Listing information is deemed reliable but not guaranteed accurate.