- Alden Bridge, The Woodlands homes for sale
- April Sound, Montgomery homes for sale
- Carlton Woods, The Woodlands homes for sale
- Cochran's Crossing, The Woodlands homes for sale
- College Park, Conroe homes for sale
- East Shore, The Woodlands homes for sale
- Graystone Hills, Conroe homes for sale
- Hidden Creek, Conroe homes for sale
- Indian Springs, The Woodlands homes for sale
- Jacobs Reserve, Conroe homes for sale
- Lake Conroe, Montgomery homes for sale
- Lake Conroe Forest, Conroe homes for sale
- Panorama Village, Conroe homes for sale
- Panther Creek, The Woodlands homes for sale
- Research Forest, The Woodlands homes for sale
- River Plantation, Conroe homes for sale
- Sterling Ridge, The Woodlands homes for sale
- The Woodlands, The Woodlands homes for sale
- Town Center, Shenandoah homes for sale
- Woodforest, Montgomery homes for sale
Conroe, TX - homes for sale
300 of 1,860 results displayed
- New
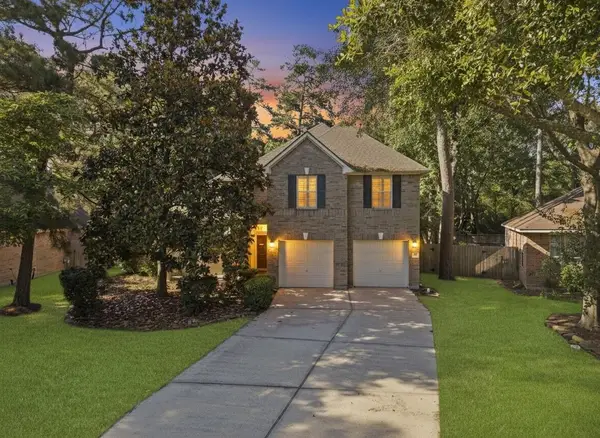 $590,000Active4 beds 3 baths2,822 sq. ft.
78 E Hobbit Glen Drive, Conroe, TX 77384
MLS# 5541465Listed by: CORCORAN PRESTIGE REALTY - New
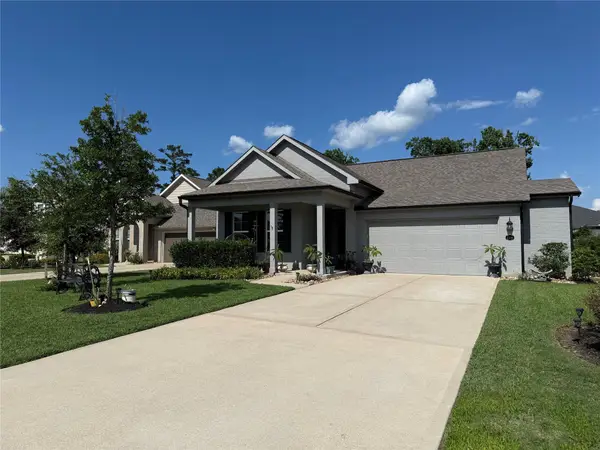 $599,900Active4 beds 3 baths2,402 sq. ft.
2336 Hagerman Rd, Conroe, TX 77384
MLS# 7598331Listed by: KELLER WILLIAMS REALTY - New
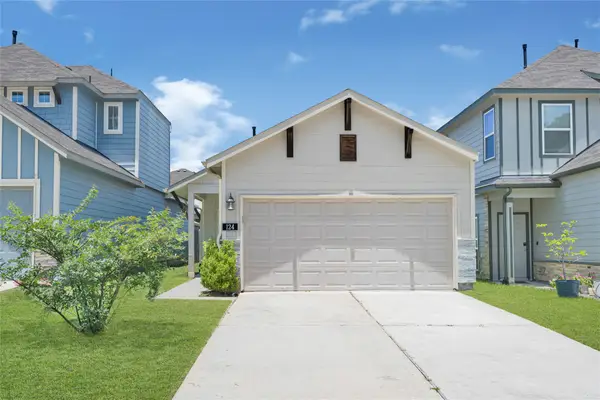 $190,000Active3 beds 2 baths1,201 sq. ft.
124 Camelot Place Court, Conroe, TX 77304
MLS# 21284961Listed by: DHS REALTY 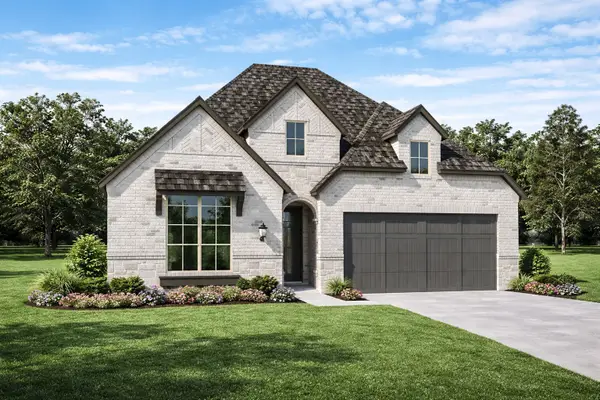 $498,890Active4 beds 3 baths2,279 sq. ft.
406 Tunnel Creek Lane, Conroe, TX 77304
MLS# 71867397Listed by: HIGHLAND HOMES REALTY $1,700,000Active4 beds 4 baths3,598 sq. ft.
10965 Lake Forest Drive, Conroe, TX 77384
MLS# 18681673Listed by: EXECUTIVE REAL ESTATE $379,000Active5 beds 3 baths2,767 sq. ft.
14077 Sharktooth Hill Lane, Conroe, TX 77384
MLS# 21932440Listed by: HOUSTON HOMES LEGACY GROUP LLC $275,000Active4 beds 3 baths2,096 sq. ft.
9909 Kingfisher Drive, Conroe, TX 77385
MLS# 96096713Listed by: REAL PROPERTIES $397,000Active4 beds 3 baths2,551 sq. ft.
119 Bluebell Woods Way, Willis, TX 77318
MLS# 8368262Listed by: OAK STORY REALTY, LLC. $799,900Active4 beds 5 baths4,013 sq. ft.
126 Stellar Hills Court, Willis, TX 77318
MLS# 97737873Listed by: RAVENNA HOMES $599,900Active4 beds 4 baths2,855 sq. ft.
334 Calmato Woods Way, Willis, TX 77318
MLS# 45387262Listed by: RAVENNA HOMES $729,900Active4 beds 5 baths3,531 sq. ft.
331 Calmato Woods Way, Willis, TX 77318
MLS# 26286041Listed by: RAVENNA HOMES $749,900Active5 beds 5 baths3,799 sq. ft.
454 Lontano Path, Willis, TX 77318
MLS# 91087745Listed by: RAVENNA HOMES $699,900Active4 beds 4 baths3,179 sq. ft.
219 Prelude Park Trail, Willis, TX 77318
MLS# 81028147Listed by: RAVENNA HOMES $410,000Active5 beds 3 baths2,748 sq. ft.
7546 Fettle Lane, Conroe, TX 77304
MLS# 32942201Listed by: REALTY EXECUTIVES THE WOODLANDS $315,000Active4 beds 2 baths1,824 sq. ft.
115 Red Oak Lane, Conroe, TX 77304
MLS# 64044070Listed by: TOP GUNS REALTY ON LAKE CONROE $5,950,000Active5 beds 8 baths8,672 sq. ft.
12349 Longmire Trace, Conroe, TX 77304
MLS# 31499421Listed by: COMPASS RE TEXAS, LLC - THE WOODLANDS $205,000Active2 beds 2 baths1,226 sq. ft.
128 April Point Drive S, Conroe, TX 77356
MLS# 32450212Listed by: COLDWELL BANKER REALTY - THE WOODLANDS $320,000Active3 beds 3 baths2,079 sq. ft.
560 Newcomb Hollow Drive, Conroe, TX 77304
MLS# 33034514Listed by: EXP REALTY LLC $230,000Active3 beds 3 baths2,443 sq. ft.
314 Tara Park, Conroe, TX 77302
MLS# 33605356Listed by: OLDE HOMESTEAD PROPERTIES OF T $259,990Active4 beds 3 baths2,260 sq. ft.
9542 Travertine Court, Conroe, TX 77303
MLS# 48285439Listed by: STARLIGHT HOMES $462,000Active5 beds 4 baths2,725 sq. ft.
2110 Artic Loon Drive, Conroe, TX 77385
MLS# 49169109Listed by: JANE BYRD PROPERTIES INTERNATIONAL LLC $364,900Active4 beds 3 baths2,301 sq. ft.
218 Ayana Forest Trail, Conroe, TX 77318
MLS# 5071844Listed by: REDFIN CORPORATION $363,500Active4 beds 2 baths2,124 sq. ft.
13917 Nicolet Arbor Lane, Conroe, TX 77384
MLS# 53050528Listed by: EXP REALTY, LLC $269,900Active3 beds 3 baths1,609 sq. ft.
1831 Brushy Cedar Drive, Conroe, TX 77301
MLS# 6673942Listed by: KELLER WILLIAMS REALTY THE WOODLANDS $526,692Active3 beds 2 baths2,288 sq. ft.
132 Silverbow Creek Way, Conroe, TX 77304
MLS# 73439914Listed by: WEEKLEY PROPERTIES BEVERLY BRADLEY $919,900Active4 beds 5 baths4,013 sq. ft.
15707 Dandelion Dreams Street, Conroe, TX 77302
MLS# 80143232Listed by: RAVENNA HOMES $859,900Active4 beds 5 baths4,195 sq. ft.
15607 Early Bird Lane, Conroe, TX 77302
MLS# 91389345Listed by: RAVENNA HOMES $350,000Active4 beds 3 baths1,819 sq. ft.
17121 Spindle Oaks Drive, Conroe, TX 77385
MLS# 23996481Listed by: KELLER WILLIAMS REALTY METROPOLITAN $59,000Active0.15 Acres
1981 La Salle Park Drive, Conroe, TX 77304
MLS# 5353631Listed by: LPT REALTY, LLC $209,990Active3 beds 2 baths1,522 sq. ft.
9469 Beryl Lane, Conroe, TX 77303
MLS# 30637207Listed by: STARLIGHT HOMES $246,000Active4 beds 2 baths1,872 sq. ft.
11431 Vassal Crossing, Conroe, TX 77304
MLS# 35007609Listed by: SKW REALTY $315,000Active4 beds 3 baths2,416 sq. ft.
2055 Midlane Drive, Conroe, TX 77301
MLS# 9810415Listed by: EXP REALTY, LLC $455,000Active3 beds 4 baths2,553 sq. ft.
120 April Wind Drive E, Montgomery, TX 77356
MLS# 37189820Listed by: SUMMIT, REALTORS $170,000Active3 beds 1 baths1,080 sq. ft.
1019 Bertrand Street, Conroe, TX 77301
MLS# 43414819Listed by: COTTAGE GATE REAL ESTATE GROUP $260,000Active3 beds 2 baths1,789 sq. ft.
9949 Kingfisher Drive, Conroe, TX 77385
MLS# 17763198Listed by: KELLER WILLIAMS REALTY PROFESSIONALS $284,990Active3 beds 3 baths2,094 sq. ft.
1382 Mount Bassie Trail, Conroe, TX 77301
MLS# 13161891Listed by: LEGEND HOME CORPORATION $409,900Active4 beds 4 baths3,073 sq. ft.
191 Maple Grove Drive, Conroe, TX 77384
MLS# 17296836Listed by: COMPASS RE TEXAS, LLC - THE WOODLANDS $329,430Active5 beds 4 baths2,622 sq. ft.
2974 Sir Ian Blake Drive, Conroe, TX 77301
MLS# 32389802Listed by: LEGEND HOME CORPORATION $245,000Active3 beds 2 baths1,740 sq. ft.
12045 La Salle Branch, Conroe, TX 77304
MLS# 38156694Listed by: EXP REALTY LLC $171,990Active2 beds 2 baths1,193 sq. ft.
176 April Point Drive N, Conroe, TX 77356
MLS# 42933389Listed by: MONARCH & CO $339,000Active4 beds 3 baths2,583 sq. ft.
9806 Tanager Lane, Conroe, TX 77385
MLS# 48565214Listed by: CAMM GROUP, INC. $345,000Active4 beds 3 baths2,630 sq. ft.
660 Stonewall Jackson Drive, Conroe, TX 77302
MLS# 8430717Listed by: WHITE PICKET REALTY LLC $256,719Active3 beds 2 baths1,355 sq. ft.
2975 Sir Ian Blake Drive, Conroe, TX 77301
MLS# 8852270Listed by: LEGEND HOME CORPORATION $349,900Active3 beds 2 baths1,751 sq. ft.
10720 Royal Forest Drive, Conroe, TX 77303
MLS# 92589433Listed by: EXP REALTY LLC $313,637Active4 beds 3 baths2,111 sq. ft.
3858 Avalon Lane, Conroe, TX 77301
MLS# 43354587Listed by: LEGEND HOME CORPORATION $279,890Active4 beds 3 baths1,745 sq. ft.
2982 Sir Ian Blake Drive, Conroe, TX 77301
MLS# 8459238Listed by: LEGEND HOME CORPORATION $478,990Active4 beds 4 baths2,545 sq. ft.
26515 Pioneer Pointe Court, Montgomery, TX 77316
MLS# 27299180Listed by: WEEKLEY PROPERTIES BEVERLY BRADLEY $424,990Active3 beds 2 baths2,088 sq. ft.
26524 Pioneer Pointe Court, Montgomery, TX 77316
MLS# 29148823Listed by: WEEKLEY PROPERTIES BEVERLY BRADLEY $273,900Active3 beds 3 baths1,696 sq. ft.
226 W Stedhill Loop, Conroe, TX 77384
MLS# 81961223Listed by: GRAND TERRA REALTY $1,499,000Active5 beds 8 baths5,551 sq. ft.
18703 Palm Beach Boulevard, Conroe, TX 77356
MLS# 92984742Listed by: JLA REALTY $435,000Active4 beds 3 baths2,564 sq. ft.
212 Trillium Park Loop, Conroe, TX 77304
MLS# 10007715Listed by: BETTER HOMES AND GARDENS REAL ESTATE GARY GREENE - THE WOODLANDS $259,900Active4 beds 3 baths1,853 sq. ft.
2741 Cadiz Bay Drive, Conroe, TX 77301
MLS# 57872872Listed by: EXECUTIVE TEXAS REALTY- Open Sat, 12 to 4pm
 $319,024Active4 beds 3 baths2,084 sq. ft.
11940 Avian Avenue, Conroe, TX 77303
MLS# 65007168Listed by: THE SIGNORELLI COMPANY  $235,000Active2 beds 3 baths1,170 sq. ft.
279 Capetown, Conroe, TX 77356
MLS# 21456655Listed by: KELLER WILLIAMS REALTY PROFESSIONALS $200,000Active2 beds 2 baths1,736 sq. ft.
213 Oak Hollow Street, Conroe, TX 77301
MLS# 64213932Listed by: KELLER WILLIAMS REALTY PROFESSIONALS $299,999Active3 beds 2 baths1,801 sq. ft.
3113 Catalonion Court, Conroe, TX 77301
MLS# 26150945Listed by: HOMESMART $429,900Active4 beds 3 baths2,291 sq. ft.
13035 Wandering Ridge Lane, Conroe, TX 77302
MLS# 39860913Listed by: CB&A, REALTORS $431,207Active4 beds 3 baths2,367 sq. ft.
13030 Brookwood Bend Lane, Conroe, TX 77302
MLS# 2256606Listed by: SHEA HOMES $309,000Active4 beds 2 baths1,784 sq. ft.
788 Yellow Birch, Conroe, TX 77304
MLS# 29635385Listed by: KELLER WILLIAMS REALTY THE WOODLANDS $949,000Active4 beds 5 baths5,106 sq. ft.
17018 Sweet Bay Court, Conroe, TX 77385
MLS# 36802987Listed by: BLOOM & PROSPER REALTY $435,139Active4 beds 3 baths2,153 sq. ft.
13018 Brookwood Bend Lane, Conroe, TX 77302
MLS# 71959732Listed by: SHEA HOMES $619,000Active4 beds 4 baths3,936 sq. ft.
1400 Graystone Hills Drive, Conroe, TX 77304
MLS# 8219245Listed by: KELLER WILLIAMS REALTY THE WOODLANDS $250,000Active4 beds 2 baths1,468 sq. ft.
503 Allison St Street, Conroe, TX 77303
MLS# 50188440Listed by: BERKSHIRE HATHAWAY HOMESERVICES PREMIER PROPERTIES $245,000Active4 beds 3 baths1,696 sq. ft.
2137 Cedar Way Drive, Conroe, TX 77301
MLS# 33985784Listed by: BETTER HOMES AND GARDENS REAL ESTATE GARY GREENE - CYPRESS $409,000Active3 beds 3 baths1,744 sq. ft.
16 Regency Point, Conroe, TX 77356
MLS# 73329760Listed by: COMPASS RE TEXAS, LLC - LAKE CONROE $1,085,000Active3 beds 4 baths3,562 sq. ft.
12336 Oak Bend Circle, Conroe, TX 77304
MLS# 10744848Listed by: BETTER HOMES AND GARDENS REAL ESTATE GARY GREENE - LAKE CONROE NORTH $500,000Active4 beds 3 baths3,114 sq. ft.
13725 Rising Sun Lane, Conroe, TX 77384
MLS# 72064611Listed by: AMERI CHOICE REALTY, LLC $285,000Active3 beds 2 baths1,680 sq. ft.
2211 Oak Rise Drive, Conroe, TX 77304
MLS# 38305068Listed by: ORCHARD BROKERAGE $650,000Active3 beds 4 baths3,140 sq. ft.
911 Sandy Beach Drive, Conroe, TX 77304
MLS# 33851796Listed by: LPT REALTY, LLC $210,000Active1 beds 1 baths1,226 sq. ft.
132 April Point Drive S, Conroe, TX 77356
MLS# 69276080Listed by: REALTY OF AMERICA, LLC $239,440Active4 beds 2 baths1,582 sq. ft.
15010 Tremaine Court, Montgomery, TX 77316
MLS# 17034920Listed by: MARTI REALTY GROUP $600,000Active4 beds 4 baths3,339 sq. ft.
3388 Wooded Lane, Conroe, TX 77301
MLS# 24866764Listed by: KELLER WILLIAMS REALTY METROPOLITAN $239,900Active3 beds 2 baths1,415 sq. ft.
4343 Roaring Timber Drive, Conroe, TX 77304
MLS# 44262541Listed by: BERKSHIRE HATHAWAY HOMESERVICES PREMIER PROPERTIES $429,900Active4 beds 3 baths2,657 sq. ft.
263 Garden Rose Trail, Willis, TX 77318
MLS# 56009552Listed by: CENTURY COMMUNITIES $258,000Active4 beds 2 baths1,760 sq. ft.
210 Harris Boulevard, Conroe, TX 77301
MLS# 6294102Listed by: CB&A, REALTORS $434,900Active4 beds 3 baths2,730 sq. ft.
270 Garden Rose Trail, Willis, TX 77318
MLS# 73823954Listed by: CENTURY COMMUNITIES $361,997Active5 beds 3 baths2,416 sq. ft.
11949 Avian Avenue, Conroe, TX 77303
MLS# 77504699Listed by: THE SIGNORELLI COMPANY $1,350,000Active5 beds 7 baths5,774 sq. ft.
2033 Bluestem Drive, Conroe, TX 77384
MLS# 11577825Listed by: EXP REALTY LLC $409,999Active3 beds 2 baths2,274 sq. ft.
8 Cambridge Circle, Conroe, TX 77304
MLS# 50916362Listed by: CREIGHTON REALTY PARTNERS, LLC $489,900Active4 beds 4 baths3,910 sq. ft.
109 Riverbrook Drive, Conroe, TX 77385
MLS# 55734421Listed by: RE/MAX INTEGRITY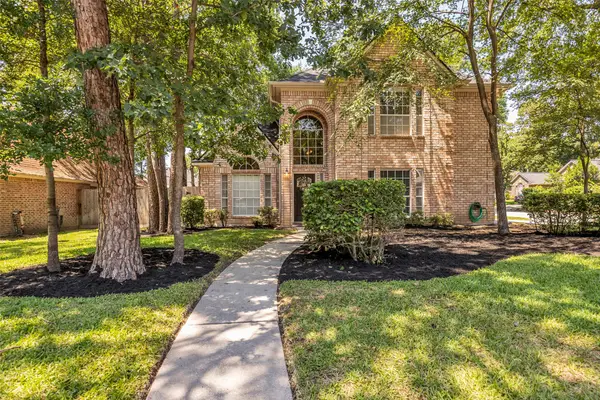 $339,900Active3 beds 3 baths2,063 sq. ft.
900 Melanie Park, Conroe, TX 77304
MLS# 62241068Listed by: COLDWELL BANKER REALTY - THE WOODLANDS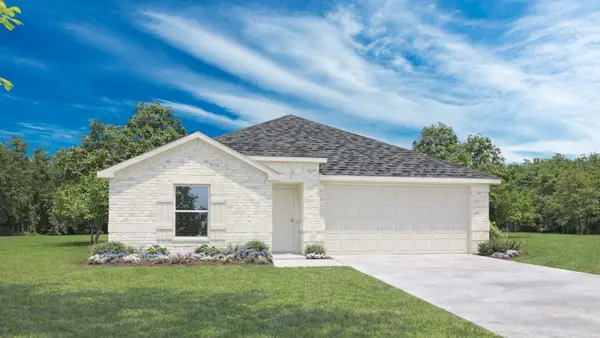 $292,990Active4 beds 3 baths2,041 sq. ft.
16632 Woodland Retreat Lane, Conroe, TX 77302
MLS# 62289060Listed by: D.R. HORTON-TEXAS, LTD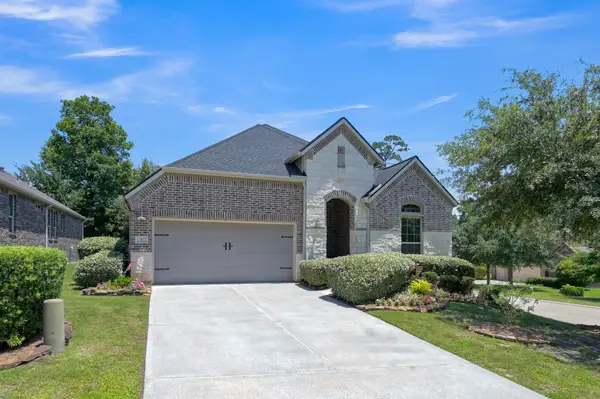 $409,000Active4 beds 3 baths2,234 sq. ft.
2 Muthill Circle, Conroe, TX 77304
MLS# 40847424Listed by: GRAND TERRA REALTY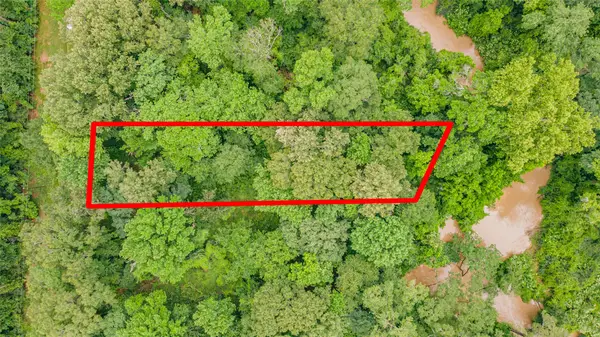 $16,000Active0.44 Acres
12572 Royal Creek Road, Conroe, TX 77303
MLS# 14925738Listed by: EXP REALTY, LLC $569,000Active4 beds 4 baths3,105 sq. ft.
254 Springs Edge Dr, Montgomery, TX 77356
MLS# 37620907Listed by: MARGARET WHITE, BROKER $575,000Active6 beds 5 baths4,402 sq. ft.
81 Oak Grove Lane, Conroe, TX 77304
MLS# 71453359Listed by: KELLER WILLIAMS PLATINUM $284,900Active4 beds 2 baths1,852 sq. ft.
15519 Caramel Springs Drive, Conroe, TX 77303
MLS# 71717459Listed by: LGI HOMES $529,999Active3 beds 4 baths3,893 sq. ft.
601 Brandon Road, Conroe, TX 77302
MLS# 9907732Listed by: VIN REALTY LLC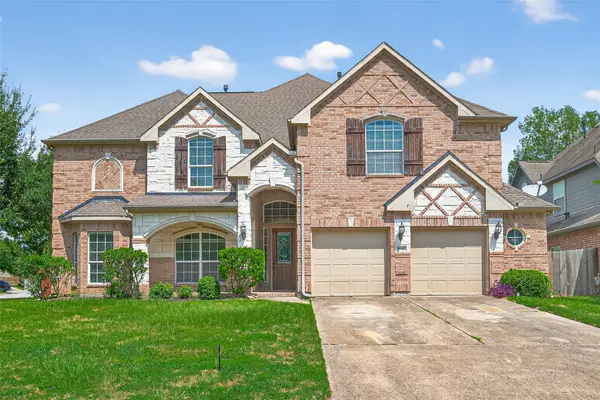 $509,000Active6 beds 4 baths4,470 sq. ft.
1840 Leela Springs Drive, Conroe, TX 77304
MLS# 37988159Listed by: LEGACY LIVING REAL ESTATE LLC $320,000Active3 beds 3 baths2,090 sq. ft.
3624 Cub Drive, Conroe, TX 77301
MLS# 32161868Listed by: REALM REAL ESTATE PROFESSIONALS - SUGAR LAND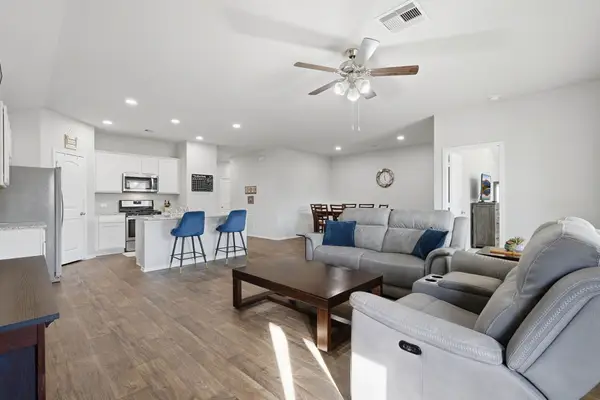 $276,000Active4 beds 2 baths1,867 sq. ft.
11519 Parrot Fish Court, Conroe, TX 77304
MLS# 54926448Listed by: CB&A, REALTORS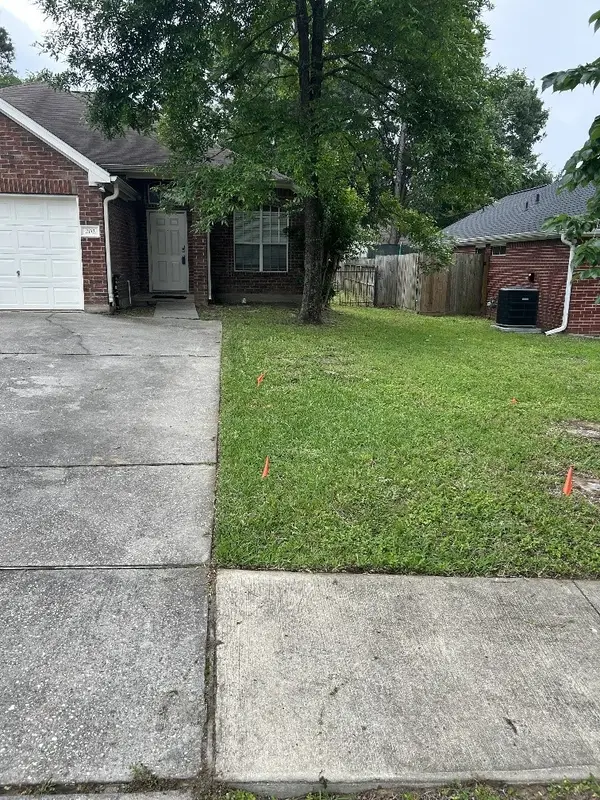 $189,900Active2 beds 2 baths1,215 sq. ft.
202 Canterbury Drive, Conroe, TX 77303
MLS# 10888358Listed by: TEAM MAMO REALTY, INC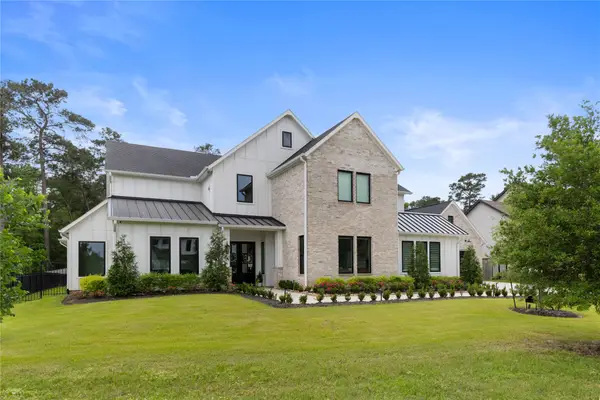 $1,950,000Active5 beds 7 baths5,332 sq. ft.
2118 Bennet Court, Conroe, TX 77384
MLS# 33250117Listed by: COMPASS RE TEXAS, LLC - THE WOODLANDS $499,000Active4 beds 4 baths3,187 sq. ft.
100 April Waters Drive N, Montgomery, TX 77356
MLS# 13346692Listed by: CLEARVIEW REAL ESTATE, LLC $1,600,000Active4 beds 6 baths7,538 sq. ft.
6148 Waltons Point, Conroe, TX 77304
MLS# 50299311Listed by: KELLER WILLIAMS ADVANTAGE REALTY $392,000Active3 beds 2 baths2,200 sq. ft.
2406 Winter Trail Drive, Conroe, TX 77304
MLS# 65840793Listed by: CONNECT REALTY.COM $730,000Active4 beds 4 baths3,426 sq. ft.
8978 Willow Springs Lane, Conroe, TX 77302
MLS# 53595256Listed by: REDFIN CORPORATION $330,000Active3 beds 3 baths1,544 sq. ft.
17570 Highway 105 W #42, Montgomery, TX 77356
MLS# 63101933Listed by: BLAKE & ASSOCIATES REALTY $349,900Active4 beds 3 baths2,374 sq. ft.
18 Dover Drive, Conroe, TX 77304
MLS# 7836186Listed by: WALZEL PROPERTIES - CORPORATE OFFICE $199,990Active3 beds 2 baths1,260 sq. ft.
11975 Hedley Court, Conroe, TX 77306
MLS# 96824168Listed by: MARTI REALTY GROUP $282,390Active4 beds 3 baths1,875 sq. ft.
13119 Pine Trace Street, Montgomery, TX 77316
MLS# 24521886Listed by: LENNAR HOMES VILLAGE BUILDERS, LLC $29,500Active0 Acres
25 Gettysburg, Conroe, TX 77302
MLS# 48211274Listed by: REAL PROPERTIES $329,900Active4 beds 3 baths2,439 sq. ft.
16417 Olive Sparrow Drive, Conroe, TX 77385
MLS# 61434392Listed by: COMPASS RE TEXAS, LLC - THE WOODLANDS $225,090Active3 beds 3 baths1,450 sq. ft.
9774 Enclave Ridge Road, Willis, TX 77318
MLS# 69879713Listed by: KELLER WILLIAMS SIGNATURE $329,000Active4 beds 4 baths2,726 sq. ft.
2906 Lawrence Park Court, Conroe, TX 77304
MLS# 79776813Listed by: CONNECT REALTY.COM $305,990Pending3 beds 2 baths1,572 sq. ft.
13115 Pine Trace Street, Montgomery, TX 77316
MLS# 95137511Listed by: LENNAR HOMES VILLAGE BUILDERS, LLC $235,390Active3 beds 2 baths1,418 sq. ft.
15011 Tremaine Court, Montgomery, TX 77316
MLS# 17522588Listed by: MARTI REALTY GROUP $540,990Active4 beds 3 baths2,460 sq. ft.
9358 Cordial Circle, Montgomery, TX 77316
MLS# 17804242Listed by: COVENTRY HOMES $416,000Active4 beds 3 baths2,595 sq. ft.
326 Westlake Terrace Drive, Conroe, TX 77304
MLS# 40602516Listed by: KELLER WILLIAMS REALTY THE WOODLANDS $280,990Active4 beds 2 baths1,750 sq. ft.
16640 Woodland Retreat Lane, Conroe, TX 77302
MLS# 61554170Listed by: D.R. HORTON-TEXAS, LTD $325,000Active3 beds 3 baths2,277 sq. ft.
2 Mace Street, Conroe, TX 77303
MLS# 93584351Listed by: DALTON WADE INC $249,900Pending4 beds 2 baths1,985 sq. ft.
8 Arlington Street, Conroe, TX 77301
MLS# 61324373Listed by: TREETOP REALTY GROUP $265,000Active4 beds 2 baths2,275 sq. ft.
2519 River Ridge Drive, Conroe, TX 77385
MLS# 14944756Listed by: RICK LAMAR REAL ESTATE, LLC $349,990Active4 beds 2 baths2,352 sq. ft.
9906 Knob Hollow Way, Conroe, TX 77385
MLS# 54128331Listed by: EXP REALTY LLC $549,990Active5 beds 4 baths4,387 sq. ft.
10 Wellington Lane, Conroe, TX 77304
MLS# 45343590Listed by: LPT REALTY, LLC $450,000Active4 beds 3 baths2,263 sq. ft.
15220 Tattle Creek Lane, Conroe, TX 77384
MLS# 90116187Listed by: KELLER WILLIAMS REALTY THE WOODLANDS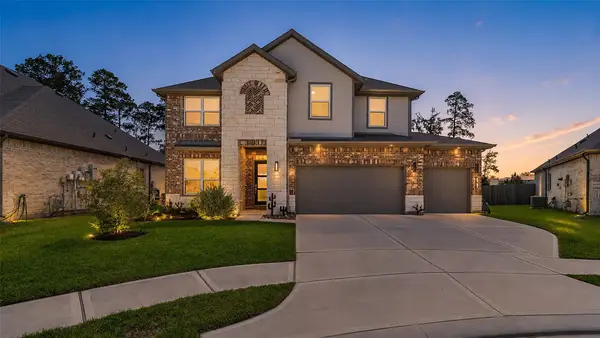 $545,000Active4 beds 3 baths2,641 sq. ft.
10302 Horseshoe Lake Trail, Conroe, TX 77384
MLS# 59627506Listed by: COLDWELL BANKER REALTY - HEIGHTS $261,990Active3 beds 2 baths1,575 sq. ft.
16636 Woodland Retreat Lane, Conroe, TX 77302
MLS# 67496079Listed by: D.R. HORTON-TEXAS, LTD $279,900Active3 beds 2 baths1,552 sq. ft.
15631 Plum Brook Drive, Conroe, TX 77303
MLS# 5443715Listed by: LGI HOMES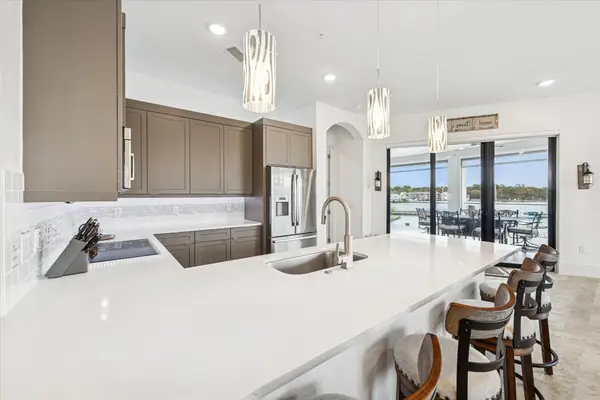 $999,900Active4 beds 4 baths2,938 sq. ft.
199 Waterpoint Court #214, Conroe, TX 77356
MLS# 47669388Listed by: KELLER WILLIAMS REALTY METROPOLITAN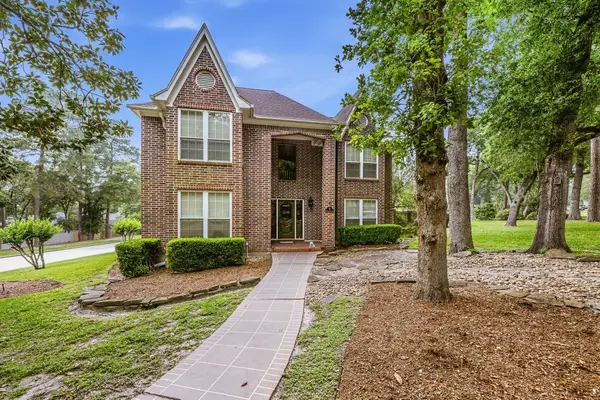 $469,000Active4 beds 3 baths2,633 sq. ft.
30 Royal Dalton Circle, Conroe, TX 77304
MLS# 51835403Listed by: RE/MAX PRIME PROPERTIES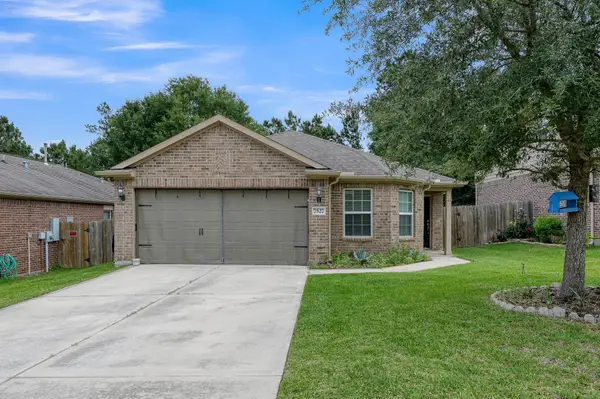 $268,000Active4 beds 2 baths1,847 sq. ft.
7527 Fettle Lane, Conroe, TX 77304
MLS# 66343223Listed by: RE/MAX INTEGRITY $350,000Active4 beds 4 baths2,992 sq. ft.
650 Bellingrath Park, Conroe, TX 77302
MLS# 90218459Listed by: EXP REALTY LLC $250,000Active3 beds 2 baths1,532 sq. ft.
9043 Nina Road, Conroe, TX 77304
MLS# 98882487Listed by: EXP REALTY LLC $399,900Active3 beds 2 baths1,678 sq. ft.
1 April Point Drive S, Montgomery, TX 77356
MLS# 24545046Listed by: THE MCKELLAR GROUP $274,500Active4 beds 2 baths1,958 sq. ft.
1118 Upton Court, Conroe, TX 77304
MLS# 38308482Listed by: RE/MAX UNIVERSAL $339,000Active4 beds 3 baths
2923 August Mist Ln, Conroe, TX 77429
MLS# 57048175Listed by: EXP REALTY LLC $690,000Active4 beds 3 baths3,100 sq. ft.
2408 Hollowbrook Lane, Conroe, TX 77384
MLS# 7087054Listed by: CB&A, REALTORS $399,000Active5 beds 3 baths2,797 sq. ft.
10428 Great Basin Lane, Conroe, TX 77384
MLS# 71678106Listed by: RE/MAX GRAND $315,000Active3 beds 3 baths1,912 sq. ft.
617 Aspen Falls Court, Conroe, TX 77304
MLS# 29115283Listed by: WHITE HOUSE GLOBAL PROPERTIES $324,500Active3 beds 2 baths2,104 sq. ft.
737 Holly Springs Drive, Conroe, TX 77302
MLS# 69338377Listed by: WALZEL PROPERTIES - CONROE $255,000Active3 beds 2 baths1,406 sq. ft.
1887 Brushy Cedar Drive, Conroe, TX 77301
MLS# 70693542Listed by: WALZEL PROPERTIES - CORPORATE OFFICE $320,000Active4 beds 3 baths1,981 sq. ft.
109 Harbour Town Circle, Conroe, TX 77356
MLS# 80927011Listed by: ENCOMPASS REAL ESTATE GROUP $324,990Active4 beds 3 baths2,209 sq. ft.
12320 Ridge Top Court, Conroe, TX 77304
MLS# 12172993Listed by: COVENTRY HOMES $725,000Active5 beds 5 baths4,292 sq. ft.
634 Cibolo Creek Drive, Conroe, TX 77304
MLS# 15304063Listed by: CB&A, REALTORS $254,990Active3 beds 2 baths1,400 sq. ft.
12182 Ridge Top Drive, Conroe, TX 77304
MLS# 51532416Listed by: COVENTRY HOMES $829,000Active3 beds 4 baths3,342 sq. ft.
5 W Forest Court, Conroe, TX 77384
MLS# 51553976Listed by: REAL BROKER, LLC $269,990Active3 beds 3 baths1,543 sq. ft.
12160 Ridge Top Drive, Conroe, TX 77304
MLS# 51973689Listed by: COVENTRY HOMES
 $615,000Active4 beds 4 baths3,478 sq. ft.
122 Deerfield Meadow Drive, Conroe, TX 77384
MLS# 72769242Listed by: CENTURY 21 REALTY PARTNERS $446,016Active4 beds 3 baths2,561 sq. ft.
14856 Shorthorn Run Lane, Montgomery, TX 77316
MLS# 85895964Listed by: TRI POINTE HOMES $234,900Active4 beds 3 baths2,696 sq. ft.
502 Birch Cluster Court, Conroe, TX 77301
MLS# 88992846Listed by: VISION REALTY $410,000Active3 beds 2 baths2,202 sq. ft.
131 Trillium Park Loop, Conroe, TX 77304
MLS# 34254238Listed by: COMPASS RE TEXAS, LLC - THE WOODLANDS $365,000Active2 beds 3 baths1,824 sq. ft.
144 April Point Drive S, Conroe, TX 77356
MLS# 91970971Listed by: MYERS & LINDSEY REAL ESTATE $415,000Active4 beds 3 baths2,257 sq. ft.
14146 Primrose Ridge Lane, Conroe, TX 77384
MLS# 64616600Listed by: CB&A, REALTORS $309,990Active4 beds 2 baths2,260 sq. ft.
952 Crannog Way, Conroe, TX 77301
MLS# 50105401Listed by: EXP REALTY LLC $295,000Active3 beds 2 baths1,621 sq. ft.
49 April Village, Conroe, TX 77356
MLS# 67031178Listed by: COMPASS RE TEXAS, LLC - THE WOODLANDS $335,490Active4 beds 3 baths2,244 sq. ft.
1697 Hopson Ranch Drive, Conroe, TX 77301
MLS# 29267943Listed by: MERITAGE HOMES REALTY $351,590Active4 beds 3 baths2,244 sq. ft.
2102 Rawls Ranch Court, Conroe, TX 77301
MLS# 45687210Listed by: MERITAGE HOMES REALTY $298,000Active4 beds 3 baths2,586 sq. ft.
2531 Eden Ridge Way, Willis, TX 77378
MLS# 47446775Listed by: MARTHA TURNER SOTHEBY'S INTERNATIONAL REALTY - THE WOODLANDS $2,700,000Active30 Acres
11927 Douget Road, Conroe, TX 77303
MLS# 51314688Listed by: REALM REAL ESTATE PROFESSIONALS - NORTH HOUSTON $339,590Active4 beds 3 baths2,244 sq. ft.
2131 Rawls Ranch Court, Conroe, TX 77301
MLS# 66101861Listed by: MERITAGE HOMES REALTY $396,690Active5 beds 4 baths2,958 sq. ft.
2111 Rawls Ranch Court, Conroe, TX 77301
MLS# 72070324Listed by: MERITAGE HOMES REALTY $290,880Active4 beds 3 baths2,024 sq. ft.
2046 West Darlington Oak Court, Conroe, TX 77304
MLS# 76700020Listed by: MERITAGE HOMES REALTY $339,490Active4 beds 3 baths2,244 sq. ft.
1680 Hopson Ranch Drive, Conroe, TX 77301
MLS# 86732345Listed by: MERITAGE HOMES REALTY- $336,590Active4 beds 3 baths2,316 sq. ft.
2127 Rawls Ranch Court, Conroe, TX 77301
MLS# 92432121Listed by: MERITAGE HOMES REALTY  $514,300Active3 beds 2 baths2,189 sq. ft.
5634 Fountain Villas Way, Conroe, TX 77304
MLS# 79955067Listed by: CREIGHTON REALTY PARTNERS, LLC $425,000Active4 beds 3 baths2,463 sq. ft.
901 Longmire Road #28, Conroe, TX 77304
MLS# 8062530Listed by: MARTHA TURNER SOTHEBY'S INTERNATIONAL REALTY - THE WOODLANDS $324,000Active4 beds 3 baths2,622 sq. ft.
13288 Musky Drive, Conroe, TX 77384
MLS# 94235626Listed by: RE/MAX THE WOODLANDS & SPRING $250,000Active4 beds 2 baths1,808 sq. ft.
282 Sunset Path S, Conroe, TX 77316
MLS# 45424661Listed by: ALLISON JAMES OF TEXAS, LLC $244,990Active3 beds 3 baths1,826 sq. ft.
9551 Travertine Court, Conroe, TX 77303
MLS# 64848597Listed by: STARLIGHT HOMES $329,000Active3 beds 2 baths1,766 sq. ft.
2407 Garden Shadow Drive, Conroe, TX 77384
MLS# 97007779Listed by: VISION REALTY $145,000Active3 beds 2 baths1,106 sq. ft.
11720 Thousand Trail #37, Willis, TX 77318
MLS# 51354963Listed by: HH PREMIER REALTY, LLC $414,999Active4 beds 4 baths3,157 sq. ft.
15231 Scenic Woodland Drive, Conroe, TX 77384
MLS# 39585778Listed by: RA BROKERS $283,961Active4 beds 3 baths1,624 sq. ft.
2328 Pipefish Drive, Conroe, TX 77384
MLS# 16075950Listed by: LEGEND HOME CORPORATION $277,073Active4 beds 3 baths1,940 sq. ft.
13552 Sauger Court, Conroe, TX 77384
MLS# 19838185Listed by: LEGEND HOME CORPORATION $299,000Active5 beds 3 baths2,770 sq. ft.
2080 Lost Timbers Drive, Conroe, TX 77304
MLS# 36273167Listed by: SWEET HOME REALTY $169,890Active4 beds 3 baths1,535 sq. ft.
3606 Duplet Avenue, Conroe, TX 77306
MLS# 41143749Listed by: MARTI REALTY GROUP $329,500Pending3 beds 3 baths2,682 sq. ft.
15319 Westland Gate Drive, Conroe, TX 77384
MLS# 49158990Listed by: INSPIRE REALTY $385,000Active5 beds 3 baths2,869 sq. ft.
14105 Redwood Forest Trail, Conroe, TX 77384
MLS# 50999874Listed by: CONNECT REALTY.COM $300,573Active4 beds 3 baths2,111 sq. ft.
2308 Pipefish Drive, Conroe, TX 77384
MLS# 7446895Listed by: LEGEND HOME CORPORATION $298,000Active3 beds 2 baths1,904 sq. ft.
3021 Quarry Springs Drive, Conroe, TX 77301
MLS# 46171529Listed by: REAL PROPERTIES $255,225Active3 beds 2 baths1,355 sq. ft.
2320 Pipefish Drive, Conroe, TX 77384
MLS# 8290976Listed by: LEGEND HOME CORPORATION $275,000Active3 beds 2 baths2,140 sq. ft.
1809 North Roberson Street, Conroe, TX 77301
MLS# 90195914Listed by: WALZEL PROPERTIES - CONROE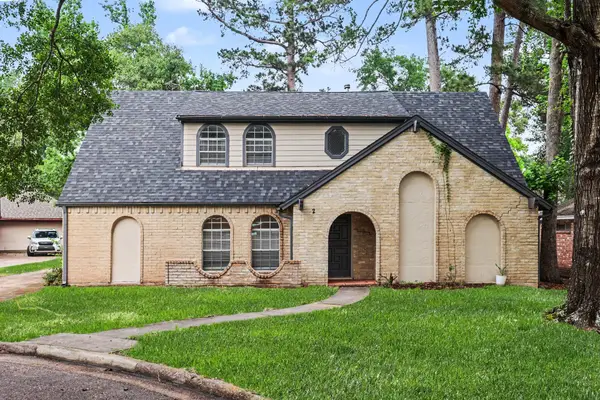 $289,900Active4 beds 2 baths2,184 sq. ft.
2 Queens Court, Conroe, TX 77304
MLS# 91453286Listed by: ENTERA REALTY LLC $475,000Active5 beds 3 baths2,983 sq. ft.
1810 Daly Way, Conroe, TX 77304
MLS# 78737800Listed by: STYLED REAL ESTATE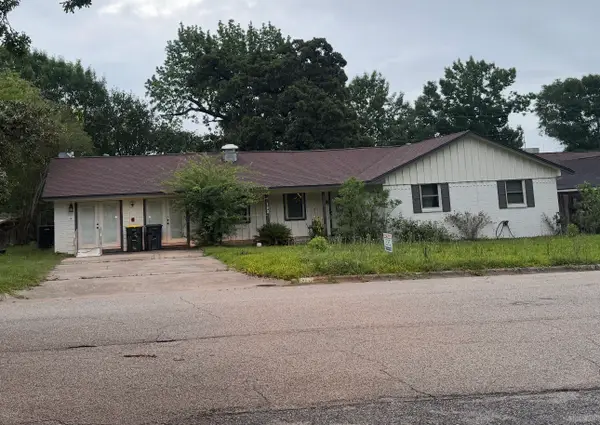 $349,900Active6 beds 3 baths2,853 sq. ft.
120 Parkgate Street, Conroe, TX 77304
MLS# 47338347Listed by: SYNERGY REAL ESTATE PROFESSIONALS $329,000Active4 beds 3 baths3,076 sq. ft.
16751 N Rail Drive, Conroe, TX 77385
MLS# 79809643Listed by: SPECTRUMSOURCE REALTY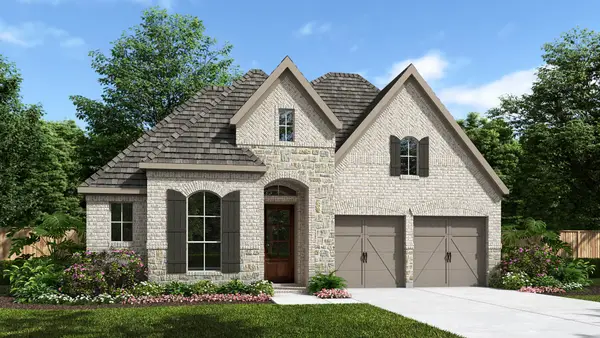 $498,900Active4 beds 3 baths2,476 sq. ft.
26516 Pioneer Pointe Court, Montgomery, TX 77316
MLS# 930822Listed by: PERRY HOMES REALTY, LLC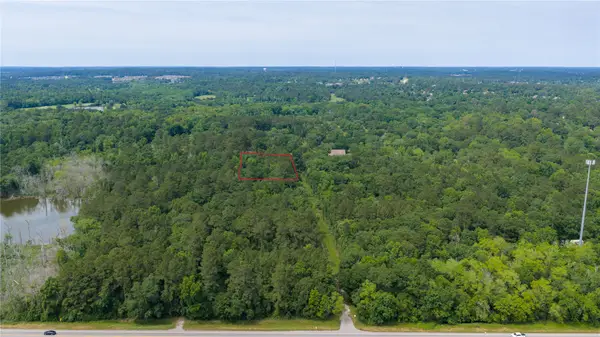 $62,500Active0.84 Acres
TBD Drew Lane, Conroe, TX 77304
MLS# 21263960Listed by: THE VANDER WOUDE GROUP $239,000Pending3 beds 3 baths1,921 sq. ft.
993 Oak Glen Drive, Willis, TX 77378
MLS# 7665228Listed by: CROW & ASSOCIATES $480,000Active5 beds 3 baths3,121 sq. ft.
13416 Bear Creek Lane, Conroe, TX 77384
MLS# 61830858Listed by: AMERI CHOICE REALTY, LLC $399,999Active4 beds 3 baths2,630 sq. ft.
5851 Brimstone Hill Lane, Conroe, TX 77304
MLS# 11305990Listed by: TEXAS HEROES REALTY $354,990Active5 beds 2 baths2,184 sq. ft.
823 Merit Badge Court, Conroe, TX 77303
MLS# 84612704Listed by: D.R. HORTON-TEXAS, LTD $229,990Active3 beds 2 baths1,337 sq. ft.
2255 Middle Ridge Drive, Conroe, TX 77301
MLS# 51158481Listed by: HOMESMART $295,990Active5 beds 3 baths2,252 sq. ft.
938 Sutherland Falls Street, Conroe, TX 77303
MLS# 92564345Listed by: D.R. HORTON-TEXAS, LTD $279,990Active5 beds 2 baths1,882 sq. ft.
4525 Nevada Falls Drive, Conroe, TX 77303
MLS# 14980993Listed by: D.R. HORTON-TEXAS, LTD $265,990Active4 beds 2 baths1,655 sq. ft.
4533 Nevada Falls Drive, Conroe, TX 77303
MLS# 29806116Listed by: D.R. HORTON-TEXAS, LTD $310,000Active3 beds 2 baths1,896 sq. ft.
2357 Old Stone Drive, Conroe, TX 77304
MLS# 78965970Listed by: MICASAPOSIBLE $250,000Active3 beds 3 baths1,926 sq. ft.
1898 Longmire Road #5, Conroe, TX 77304
MLS# 8040268Listed by: COLDWELL BANKER REALTY - LAKE CONROE/WILLIS $296,990Active6 beds 3 baths2,349 sq. ft.
934 Sutherland Falls Street, Conroe, TX 77303
MLS# 98386074Listed by: D.R. HORTON-TEXAS, LTD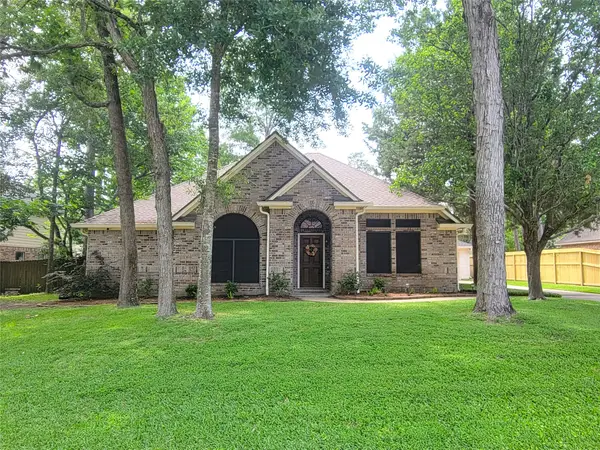 $345,000Pending3 beds 2 baths2,072 sq. ft.
758 Forest Lane Drive, Conroe, TX 77302
MLS# 348023Listed by: PRG, REALTORS $254,900Active3 beds 2 baths1,604 sq. ft.
7562 Fettle Lane, Conroe, TX 77304
MLS# 26825963Listed by: CENTURY 21 LUCKY MONEY $595,000Active2 beds 2 baths1,584 sq. ft.
199 Waterpoint Court #311, Conroe, TX 77356
MLS# 10502788Listed by: PRO PLUS REALTORS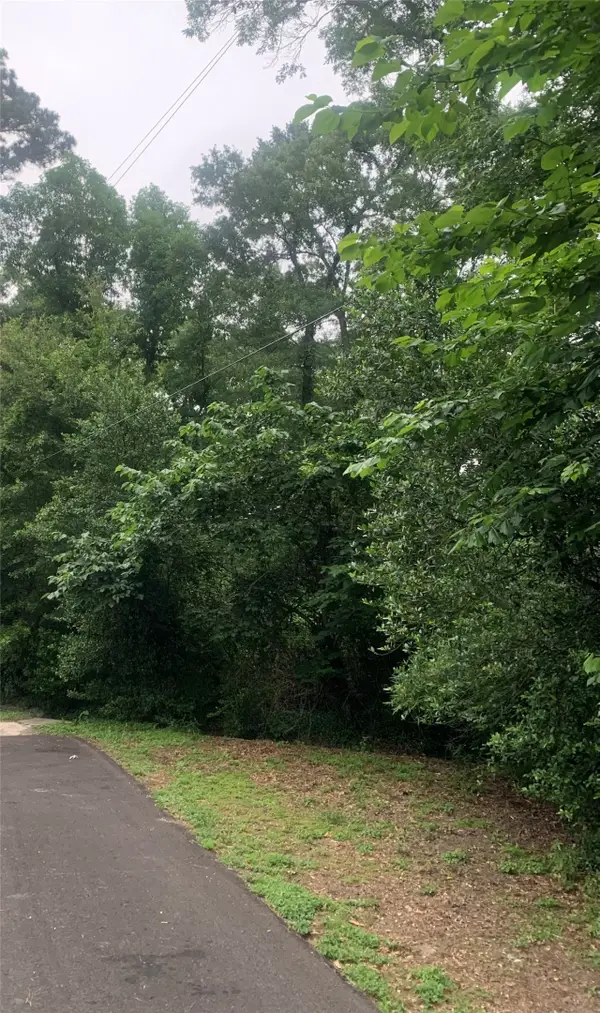 $74,900Active0.26 Acres
234 Boca Raton Drive, Conroe, TX 77304
MLS# 85240728Listed by: HOMESPLUS REAL ESTATE SERVICES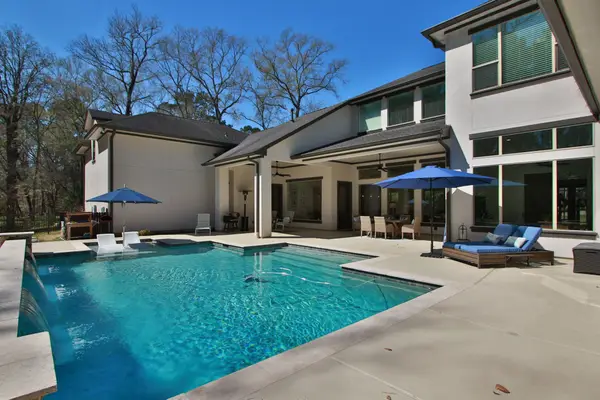 $1,299,900Active4 beds 4 baths4,642 sq. ft.
2263 Stableridge Drive, Conroe, TX 77384
MLS# 11897257Listed by: BETTER HOMES AND GARDENS REAL ESTATE GARY GREENE - CHAMPIONS $38,000Active0.06 Acres
274 Capetown, Montgomery, TX 77356
MLS# 22909508Listed by: KELLER WILLIAMS REALTY PROFESSIONALS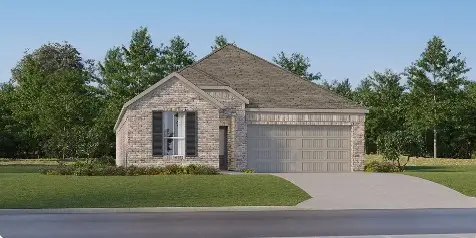 $302,690Active4 beds 3 baths1,984 sq. ft.
13030 Pine Trace Street, Montgomery, TX 77316
MLS# 24844795Listed by: LENNAR HOMES VILLAGE BUILDERS, LLC $750,000Active3 beds 3 baths3,470 sq. ft.
700 Carriage Hills Boulevard, Conroe, TX 77384
MLS# 43419289Listed by: RED DIRT REALTY GROUP $310,340Active5 beds 3 baths2,649 sq. ft.
13035 Pine Trace Street, Montgomery, TX 77316
MLS# 56942502Listed by: LENNAR HOMES VILLAGE BUILDERS, LLC $279,900Active3 beds 2 baths1,552 sq. ft.
15619 Plum Brook Drive, Conroe, TX 77303
MLS# 61024560Listed by: LGI HOMES $289,900Active3 beds 3 baths2,736 sq. ft.
314 Falling Pine Drive, Conroe, TX 77304
MLS# 96312683Listed by: ENTERA REALTY LLC $575,000Active5 beds 5 baths4,371 sq. ft.
3115 Red Buckeye Lane, Conroe, TX 77301
MLS# 15661254Listed by: ORCHARD BROKERAGE $250,000Active4 beds 2 baths2,130 sq. ft.
1009 Thomas Avenue, Conroe, TX 77301
MLS# 20290541Listed by: KELLER WILLIAMS REALTY THE WOODLANDS $161,340Active3 beds 3 baths1,360 sq. ft.
3618 Duplet Avenue, Conroe, TX 77306
MLS# 25783668Listed by: MARTI REALTY GROUP $629,000Active4 beds 3 baths2,958 sq. ft.
9 Claridge Court, Conroe, TX 77304
MLS# 35517832Listed by: THE JAKE MOORE GROUP $274,900Active3 beds 2 baths1,924 sq. ft.
1136 Littleton Court, Conroe, TX 77304
MLS# 38898471Listed by: ENTERA REALTY LLC $480,000Active5 beds 3 baths2,759 sq. ft.
14310 Winema View Lane, Conroe, TX 77384
MLS# 48025576Listed by: CB&A, REALTORS $299,000Active4 beds 2 baths2,006 sq. ft.
1386 Antigua Drive, Conroe, TX 77301
MLS# 62615504Listed by: RE/MAX THE WOODLANDS & SPRING $39,000Pending0 Acres
16742 Great Oaks Dr, Conroe, TX 77385
MLS# 83250776Listed by: WALZEL PROPERTIES - CONROE $295,000Active3 beds 2 baths1,644 sq. ft.
2203 Nicholas Crossing, Conroe, TX 77304
MLS# 88020903Listed by: RE/MAX THE WOODLANDS & SPRING $475,000Active3 beds 4 baths2,918 sq. ft.
3234 Explorer Way, Conroe, TX 77301
MLS# 55829595Listed by: CB&A, REALTORS $244,900Active3 beds 2 baths1,437 sq. ft.
2328 Cedar Crossing Drive, Conroe, TX 77306
MLS# 69578631Listed by: RE/MAX UNIVERSAL $575,000Active3 beds 3 baths2,420 sq. ft.
11485 Mockingbird Hill, Conroe, TX 77303
MLS# 52504071Listed by: CENTURY 21 REALTY PARTNERS $280,000Active4 beds 3 baths2,027 sq. ft.
2717 Williams Grove Court, Conroe, TX 77304
MLS# 86580239Listed by: JLA REALTY $215,000Active2 beds 2 baths1,102 sq. ft.
92 Tupelo Lane, Conroe, TX 77304
MLS# 11083116Listed by: COMPASS RE TEXAS, LLC - THE WOODLANDS $527,000Active4 beds 3 baths2,632 sq. ft.
956 Terlingua Creek Drive, Conroe, TX 77304
MLS# 24855639Listed by: REALM REAL ESTATE PROFESSIONALS - WEST HOUSTON $410,000Active2 beds 2 baths2,008 sq. ft.
5757 Lakeside Villas Court, Conroe, TX 77304
MLS# 28653482Listed by: TOP GUNS REALTY ON LAKE CONROE $475,000Active4 beds 3 baths2,210 sq. ft.
731 Fall Rock Branch Drive, Conroe, TX 77304
MLS# 38325335Listed by: ALL CITY REAL ESTATE $314,900Active3 beds 2 baths1,612 sq. ft.
88 Rolling Hills Drive, Conroe, TX 77304
MLS# 95917258Listed by: BEYCOME BROKERAGE REALTY, LLC $359,000Active3 beds 3 baths2,523 sq. ft.
15246 Scenic Woodland Drive, Conroe, TX 77384
MLS# 96328332Listed by: EXECUTIVE TEXAS REALTY $535,000Active4 beds 4 baths3,258 sq. ft.
2502 Wynden Meadow Lane, Conroe, TX 77304
MLS# 36250598Listed by: EXP REALTY LLC $225,000Pending3 beds 2 baths1,556 sq. ft.
1614 Juniper Knoll Way, Conroe, TX 77301
MLS# 49147785Listed by: COMPASS RE TEXAS, LLC - THE WOODLANDS $465,000Active4 beds 4 baths2,968 sq. ft.
4 Logan Creek Lane, Conroe, TX 77304
MLS# 50876025Listed by: REALTY ONE GROUP ICONIC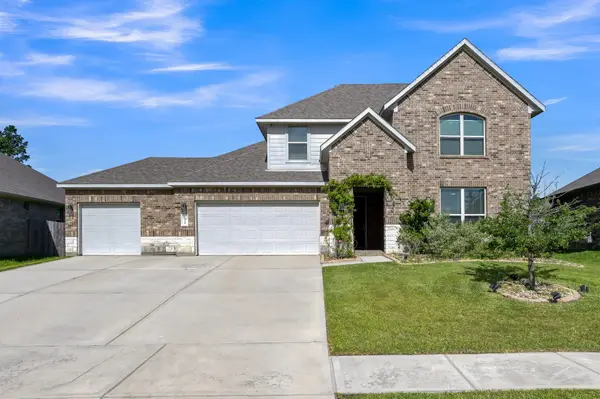 $515,000Active4 beds 3 baths2,803 sq. ft.
14418 Kerrick Vista Lane, Conroe, TX 77384
MLS# 54856794Listed by: KELLER WILLIAMS MEMORIAL $397,500Pending3 beds 2 baths2,302 sq. ft.
142 S Park Drive, Conroe, TX 77356
MLS# 68643743Listed by: JLA REALTY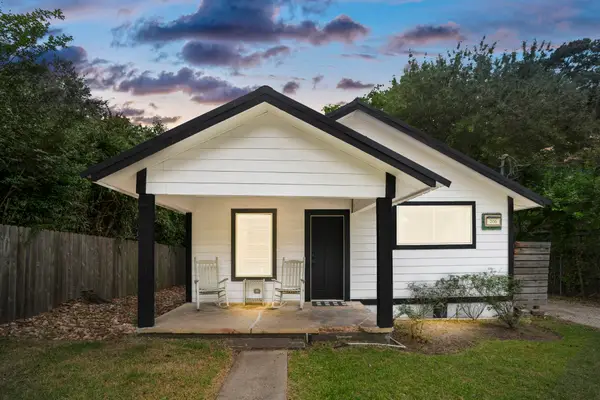 $177,500Active2 beds 1 baths908 sq. ft.
206 Murray Street, Conroe, TX 77301
MLS# 92239135Listed by: HOMESMART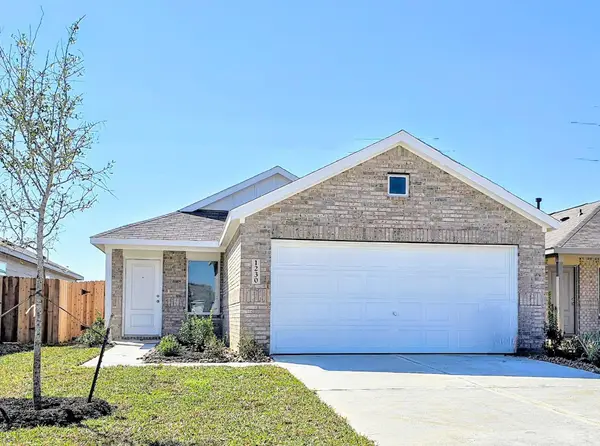 $233,790Active3 beds 2 baths1,409 sq. ft.
15007 Tremaine Court, Montgomery, TX 77316
MLS# 67549804Listed by: MARTI REALTY GROUP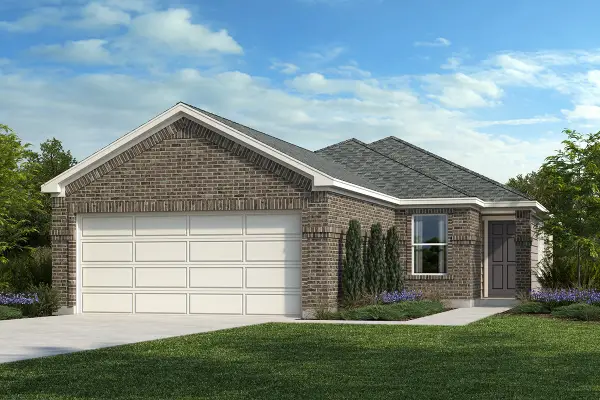 $244,201Active3 beds 2 baths1,548 sq. ft.
10391 Laurel Crest Trail, Willis, TX 77378
MLS# 12244286Listed by: KB HOME HOUSTON $699,000Active4 beds 4 baths2,641 sq. ft.
2111 Woodland Elm Lane, Conroe, TX 77384
MLS# 11477362Listed by: BETTER HOMES AND GARDENS REAL ESTATE GARY GREENE - THE WOODLANDS $379,900Active4 beds 3 baths2,758 sq. ft.
1936 Canyon Live Oak Street, Conroe, TX 77304
MLS# 72775434Listed by: CONNECT REALTY.COM $340,000Active4 beds 3 baths2,189 sq. ft.
12268 Council Grove Drive, Conroe, TX 77384
MLS# 14674593Listed by: THE WOODLANDS REALTY $649,000Active4 beds 5 baths3,395 sq. ft.
32117 Magnolia River Trail, Conroe, TX 77385
MLS# 17447303Listed by: COLDWELL BANKER REALTY - THE WOODLANDS $369,000Active3 beds 3 baths2,925 sq. ft.
9014 Meacom Drive, Conroe, TX 77384
MLS# 19981798Listed by: FIRST MILLENNIUM REALTY $338,440Pending4 beds 3 baths2,244 sq. ft.
1689 Hopson Ranch Drive, Conroe, TX 77301
MLS# 13060533Listed by: MERITAGE HOMES REALTY $314,000Active4 beds 3 baths2,484 sq. ft.
2903 August Mist Court, Conroe, TX 77304
MLS# 10681340Listed by: ORCHARD BROKERAGE $599,990Pending4 beds 4 baths3,039 sq. ft.
140 Silverbow Creek Way, Conroe, TX 77304
MLS# 18923004Listed by: HIGHLAND HOMES REALTY $245,000Active2 beds 2 baths2,059 sq. ft.
39 Regency Point, Conroe, TX 77356
MLS# 30037390Listed by: COMPASS RE TEXAS, LLC - THE WOODLANDS $338,800Active4 beds 3 baths2,744 sq. ft.
411 April Bay Drive, Conroe, TX 77316
MLS# 30246100Listed by: WALLACE REALTY $1,000,000Active5 beds 5 baths5,531 sq. ft.
11306 Longmire Creek Court, Conroe, TX 77304
MLS# 36606138Listed by: BERKSHIRE HATHAWAY HOMESERVICES PREMIER PROPERTIES $394,512Active3 beds 2 baths2,093 sq. ft.
320 Twilight Haze Court, Willis, TX 77318
MLS# 39332588Listed by: WEEKLEY PROPERTIES BEVERLY BRADLEY $399,900Active4 beds 3 baths2,677 sq. ft.
701 Saint Lawrence River Road, Montgomery, TX 77316
MLS# 50482822Listed by: RE/MAX INTEGRITY II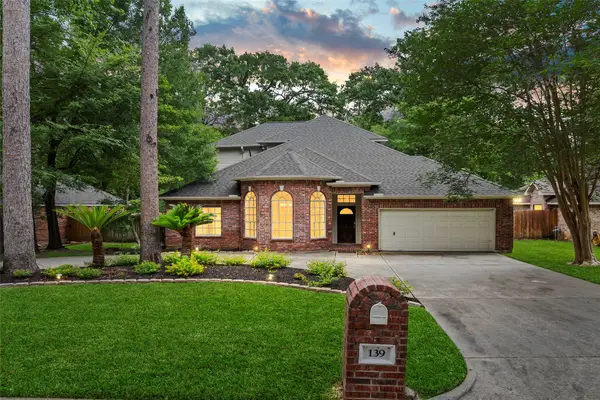 $499,000Active4 beds 3 baths2,724 sq. ft.
139 Park Way, Conroe, TX 77356
MLS# 5088558Listed by: TEXAS UNITED REALTY $489,401Active4 beds 4 baths2,799 sq. ft.
316 Silver Sage Street, Conroe, TX 77304
MLS# 51136259Listed by: WESTIN HOMES $432,889Active4 beds 3 baths2,366 sq. ft.
340 Twilight Haze Court, Willis, TX 77318
MLS# 59976060Listed by: WEEKLEY PROPERTIES BEVERLY BRADLEY $439,900Active4 beds 3 baths2,352 sq. ft.
631 Sand Branch Drive, Conroe, TX 77304
MLS# 67857666Listed by: KELSEY CASEY PROPERTIES $220,000Active2 beds 2 baths1,226 sq. ft.
168 April Point Drive S #168, Conroe, TX 77356
MLS# 69213082Listed by: RED DOOR REALTY & ASSOCIATES $468,132Active5 beds 4 baths2,884 sq. ft.
328 Twilight Haze Court, Willis, TX 77318
MLS# 7662642Listed by: WEEKLEY PROPERTIES BEVERLY BRADLEY $388,031Active3 beds 2 baths1,888 sq. ft.
324 Twilight Haze Court, Willis, TX 77318
MLS# 78268199Listed by: WEEKLEY PROPERTIES BEVERLY BRADLEY $299,000Active4 beds 3 baths2,354 sq. ft.
8 Landscape Court, Conroe, TX 77301
MLS# 83637065Listed by: KELLER WILLIAMS REALTY PROFESSIONALS $230,000Active3 beds 2 baths1,249 sq. ft.
14232 Sedona Ridge Drive, Conroe, TX 77303
MLS# 86961812Listed by: CB&A, REALTORS $435,000Active4 beds 3 baths
215 Springfield Terrace Court, Conroe, TX 77304
MLS# 29441650Listed by: QUEST REAL ESTATE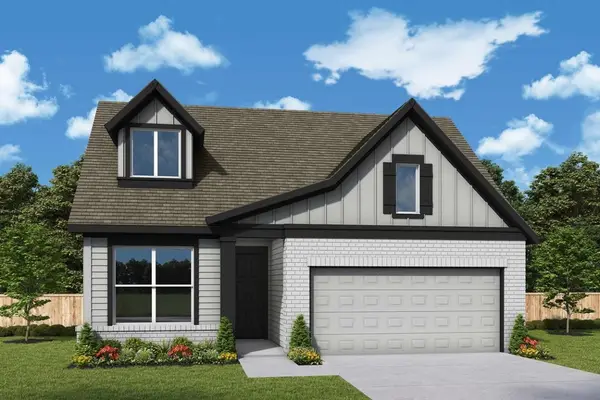 $398,990Active3 beds 2 baths1,876 sq. ft.
1935 El Pino Street, Montgomery, TX 77316
MLS# 69131566Listed by: WEEKLEY PROPERTIES BEVERLY BRADLEY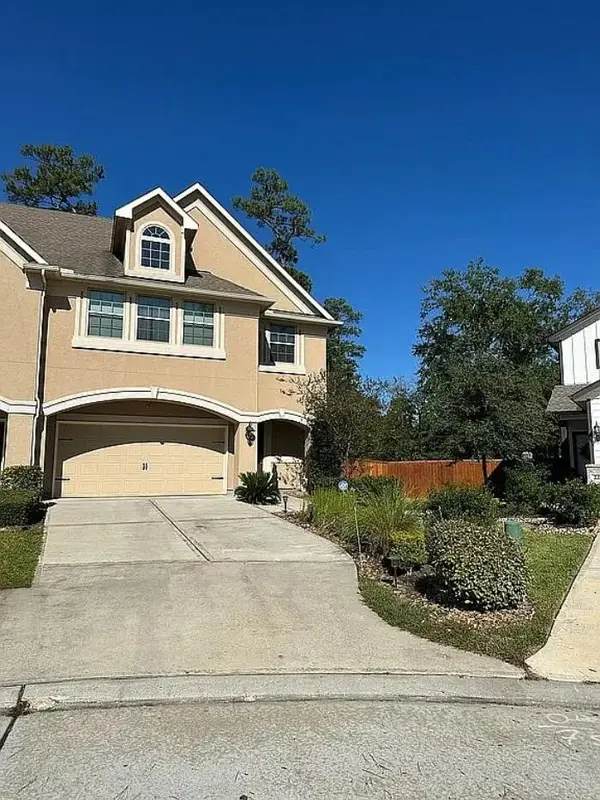 $349,000Active3 beds 3 baths2,204 sq. ft.
226 Skybranch Court, Conroe, TX 77304
MLS# 23349387Listed by: BEYCOME BROKERAGE REALTY, LLC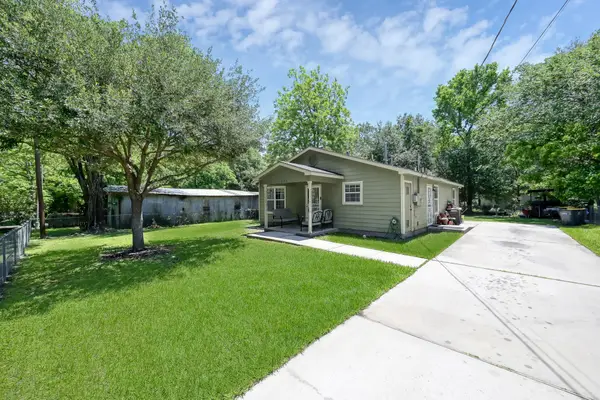 $240,000Active3 beds 1 baths1,200 sq. ft.
805 Webb Street, Conroe, TX 77301
MLS# 23793924Listed by: REALTY OF AMERICA, LLC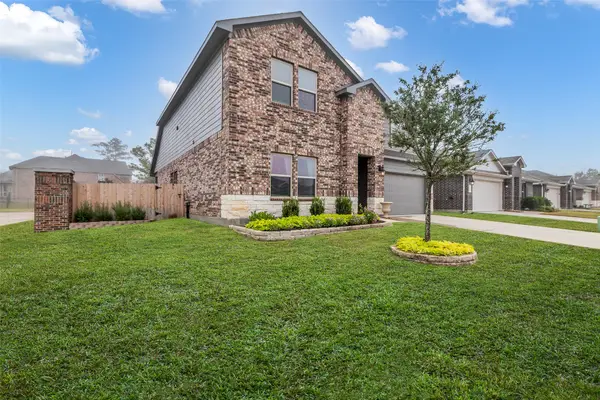 $349,900Active4 beds 3 baths2,578 sq. ft.
3318 Iron Pine Lane, Conroe, TX 77301
MLS# 43098899Listed by: FERRIS REALTY $329,990Active4 beds 3 baths2,491 sq. ft.
563 Landfall Ln, Conroe, TX 77302
MLS# 51288258Listed by: EXP REALTY LLC $589,283Active4 beds 4 baths3,400 sq. ft.
148 Mockingbird Trails Drive, Willis, TX 77318
MLS# 65369192Listed by: WESTIN HOMES $699,989Pending4 beds 4 baths3,373 sq. ft.
63 Silver Bayou Court, Conroe, TX 77384
MLS# 67343173Listed by: KELLER WILLIAMS REALTY THE WOODLANDS $439,990Active4 beds 2 baths2,488 sq. ft.
14445 Kerrick Vista Lane, Conroe, TX 77384
MLS# 70368791Listed by: ZURI PROPERTIES $610,000Active3 beds 3 baths2,862 sq. ft.
2368 Goldenglade Drive, Conroe, TX 77384
MLS# 77654191Listed by: NAN & COMPANY PROPERTIES - WOODLANDS OFFICE $240,000Pending3 beds 2 baths1,641 sq. ft.
1039 Blue Moon Court, Conroe, TX 77301
MLS# 89122223Listed by: SHUG REALTY GROUP LLC $239,950Active3 beds 2 baths1,417 sq. ft.
2816 Madison Drive, Conroe, TX 77304
MLS# 94993147Listed by: KELLER WILLIAMS REALTY THE WOODLANDS $395,000Active3 beds 3 baths2,314 sq. ft.
748 Talmalge Hall Drive, Conroe, TX 77302
MLS# 64378376Listed by: KELLER WILLIAMS REALTY THE WOODLANDS $525,000Active4 beds 3 baths3,226 sq. ft.
2073 Brookmont Drive, Conroe, TX 77301
MLS# 44468656Listed by: EXP REALTY LLC $304,900Active4 beds 2 baths2,598 sq. ft.
2316 Highland Crossing Drive, Conroe, TX 77304
MLS# 98509243Listed by: HOUZE BUYERS LLC $375,000Active3 beds 2 baths2,494 sq. ft.
2012 Elkington Circle, Conroe, TX 77304
MLS# 10340439Listed by: COMPASS RE TEXAS, LLC - THE WOODLANDS $25,000Active0.63 Acres
0 Rollingwood Loop, Conroe, TX 77303
MLS# 23396895Listed by: NB ELITE REALTY $27,000Active0.85 Acres
00 Rollingwood Loop, Conroe, TX 77303
MLS# 6754119Listed by: NB ELITE REALTY $37,000Active0.36 Acres
000 Rollingwood Loop, Conroe, TX 77303
MLS# 71853264Listed by: NB ELITE REALTY $384,900Active4 beds 3 baths2,323 sq. ft.
110 Cove Place Court, Conroe, TX 77356
MLS# 7617869Listed by: ALLISON JAMES OF TEXAS, LLC $300,000Active4 beds 3 baths2,125 sq. ft.
2421 Shellcracker Drive, Conroe, TX 77384
MLS# 72740724Listed by: CORCORAN GENESIS $600,000Active4 beds 4 baths3,499 sq. ft.
119 Meadow Run Drive, Conroe, TX 77384
MLS# 19536612Listed by: RE/MAX UNIVERSAL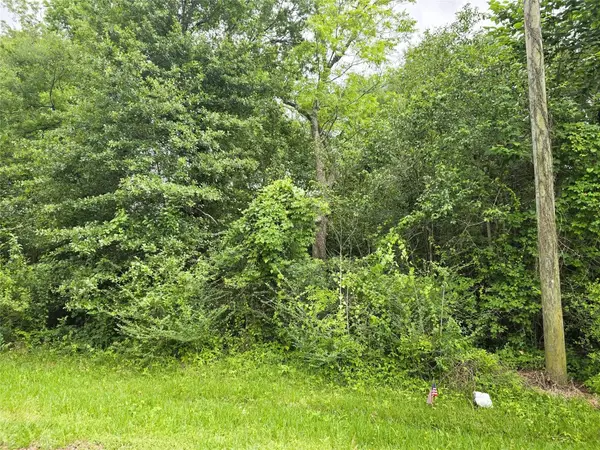 $59,000Active0 Acres
0 E Avenue G Tbd, Conroe, TX 77301
MLS# 50551931Listed by: WALZEL PROPERTIES - CONROE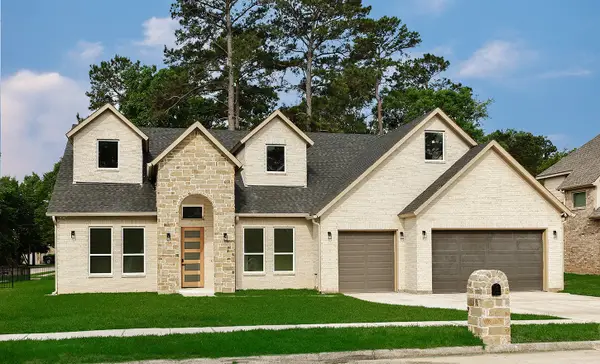 $660,000Active3 beds 3 baths2,694 sq. ft.
1511 Cafe Dumonde, Conroe, TX 77304
MLS# 62073150Listed by: EXP REALTY LLC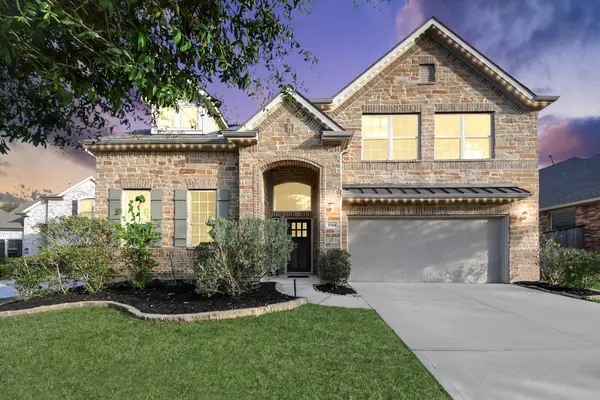 $429,900Active4 beds 4 baths2,832 sq. ft.
3544 Woods Estates Drive, Conroe, TX 77304
MLS# 65974867Listed by: RE/MAX UNIVERSAL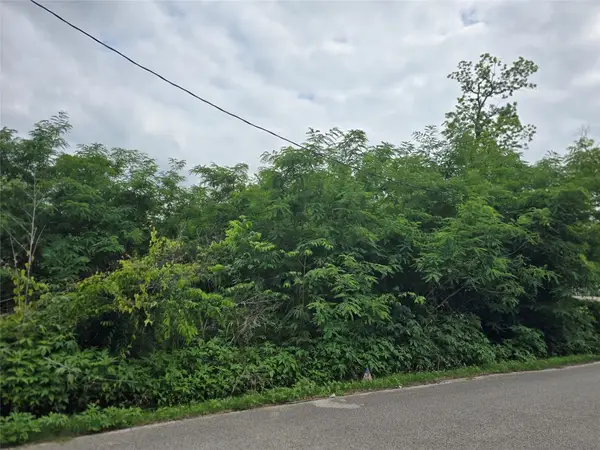 $36,500Active0 Acres
0 Ave F Tbd, Conroe, TX 77301
MLS# 74141157Listed by: WALZEL PROPERTIES - CONROE $133,000Active1 beds 1 baths726 sq. ft.
204E Lakeview Terrace, Conroe, TX 77356
MLS# 84883596Listed by: WALZEL PROPERTIES - SPRING $274,000Active4 beds 3 baths1,774 sq. ft.
1325 Mount Bassie Trail, Conroe, TX 77301
MLS# 92878563Listed by: CONNECT REALTY.COM $449,900Active4 beds 3 baths2,323 sq. ft.
109 Cove Point, Conroe, TX 77356
MLS# 29071699Listed by: ALLISON JAMES OF TEXAS, LLC $279,900Active3 beds 3 baths1,672 sq. ft.
114 Capetown Circle, Montgomery, TX 77356
MLS# 4496958Listed by: ALLISON JAMES OF TEXAS, LLC $669,800Active4 beds 4 baths3,144 sq. ft.
207 Ladner Court, Willis, TX 77318
MLS# 86611018Listed by: BLAIR REALTY GROUP $345,000Active3 beds 3 baths2,509 sq. ft.
17 Winged Foot Drive, Conroe, TX 77304
MLS# 46185748Listed by: KELLER WILLIAMS REALTY THE WOODLANDS $214,900Pending4 beds 2 baths1,705 sq. ft.
1606 Katydid Court, Conroe, TX 77301
MLS# 63839685Listed by: RENTLIFE PROPERTY MANAGEMENT CRMC $275,000Active5 beds 3 baths2,823 sq. ft.
409 Brook Hollow Drive, Conroe, TX 77385
MLS# 71792421Listed by: SIERRA VISTA REALTY LLC $239,000Active3 beds 2 baths1,465 sq. ft.
108 Shadow Leaf Trail, Conroe, TX 77378
MLS# 87549428Listed by: LISTINGRESULTS.COM $200,000Active3 beds 2 baths1,086 sq. ft.
10443 Royal York Drive, Conroe, TX 77303
MLS# 29591020Listed by: CORCORAN GENESIS $274,927Active4 beds 2 baths1,556 sq. ft.
11925 Avian Avenue, Conroe, TX 77303
MLS# 22955581Listed by: THE SIGNORELLI COMPANY $319,000Active4 beds 3 baths2,524 sq. ft.
499 Mississippi Park, Conroe, TX 77302
MLS# 40998392Listed by: CREIGHTON REALTY PARTNERS, LLC $274,455Active3 beds 2 baths1,559 sq. ft.
11931 Avian Avenue, Conroe, TX 77303
MLS# 62144996Listed by: THE SIGNORELLI COMPANY $547,500Active4 beds 3 baths2,748 sq. ft.
9550 Lake Conroe Drive, Conroe, TX 77304
MLS# 67196956Listed by: TRILLIONAIRE REALTY $214,990Active3 beds 2 baths1,724 sq. ft.
308 Lilly Boulevard, Conroe, TX 77301
MLS# 94271498Listed by: KELLER WILLIAMS HOUSTON CENTRAL $419,990Active4 beds 3 baths2,601 sq. ft.
4541 Iguaza Falls Drive, Conroe, TX 77303
MLS# 28543665Listed by: D.R. HORTON-TEXAS, LTD $239,990Active3 beds 2 baths1,556 sq. ft.
15472 Woody Haven Drive, Conroe, TX 77302
MLS# 53197831Listed by: LEGEND HOME CORPORATION $439,900Active3 beds 3 baths2,143 sq. ft.
251 Garden Rose Trail, Willis, TX 77318
MLS# 15630306Listed by: CENTURY 21 LUCKY MONEY $315,000Active4 beds 2 baths2,098 sq. ft.
3325 Jagged Crow Lane, Conroe, TX 77301
MLS# 27747737Listed by: EXP REALTY LLC $319,990Active3 beds 3 baths1,983 sq. ft.
104 Red Cascade Court, Conroe, TX 77318
MLS# 59490190Listed by: KELLER WILLIAMS REALTY THE WOODLANDS $470,000Active3 beds 3 baths2,495 sq. ft.
1713 Summergate Drive, Conroe, TX 77304
MLS# 71463786Listed by: MARTHA TURNER SOTHEBY'S INTERNATIONAL REALTY - THE WOODLANDS $464,670Active4 beds 4 baths2,659 sq. ft.
348 Twilight Haze Court, Willis, TX 77318
MLS# 94919139Listed by: WEEKLEY PROPERTIES BEVERLY BRADLEY $701,513Active4 beds 4 baths3,364 sq. ft.
14323 Moonlit Creek Court, Montgomery, TX 77316
MLS# 95977633Listed by: TRI POINTE HOMES $425,000Active4 beds 3 baths2,777 sq. ft.
319 Honey Mesquite Path, Conroe, TX 77318
MLS# 16153895Listed by: CASE REALTY GROUP INC.
Local realty services provided by:CENTURY 21 Lucky Money Real Estate, CENTURY 21 North East, CENTURY 21 Mike Bowman, Inc.
Copyright 2026, Houston Realtors Information Service, Inc. All information provided is deemed reliable but is not guaranteed and should be independently verified. IDX information is provided exclusively for consumers' personal, non-commercial use, it may not be used for any purpose other than to identify prospective properties consumers may be interested in purchasing, and the data is deemed reliable but is not guaranteed accurate by the MLS.
Information provided, in part, by North Texas Real Estate Information Systems, Inc. Last Updated June 7, 2026 Listings with the NTREIS logo are listed by brokerages other than CENTURY 21 Mike Bowman, Inc.. GDAR Member Broker: Dave Bowman
Neighborhoods near Conroe, TX
Zip codes near Conroe, TX
- 77301 homes for sale
- 77302 homes for sale
- 77303 homes for sale
- 77304 homes for sale
- 77306 homes for sale
- 77316 homes for sale
- 77318 homes for sale
- 77354 homes for sale
- 77362 homes for sale
- 77372 homes for sale
- 77373 homes for sale
- 77375 homes for sale
- 77378 homes for sale
- 77380 homes for sale
- 77381 homes for sale
- 77382 homes for sale
- 77384 homes for sale
- 77385 homes for sale
- 77386 homes for sale
- 77389 homes for sale
Popular searches near Conroe, TX
- Cut And Shoot homes for sale
- Deerwood homes for sale
- Grangerland homes for sale
- Magnolia homes for sale
- Montgomery homes for sale
- New Waverly homes for sale
- Oak Ridge North homes for sale
- Panorama Village homes for sale
- Patton Village homes for sale
- Pinehurst homes for sale
- Porter homes for sale
- Porter Heights homes for sale
- Shenandoah homes for sale
- Southeast Montgomery homes for sale
- Splendora homes for sale
- Spring homes for sale
- The Woodlands homes for sale
- Tomball homes for sale
- Willis homes for sale
- Woodbranch homes for sale
Protect your home and budget from life's surprises with an Assurant Home Warranty, backed by a partner that supports you through every step of homeownership. Explore Plans.
©2026 Century 21 Real Estate LLC. All rights reserved. CENTURY 21®, the CENTURY 21 Logo and C21® are service marks owned by Century 21 Real Estate LLC. Century 21 Real Estate LLC fully supports the principles of the Fair Housing Act and the Equal Opportunity Act. Each office is independently owned and operated. Listing information is deemed reliable but not guaranteed accurate.