- Beaumont, Knoxville homes for sale
- Belle Morris, Knoxville homes for sale
- Broadacres, Powell homes for sale
- Burlington, Knoxville homes for sale
- Cumberland Estates, Knoxville homes for sale
- Emory Valley, Oak Ridge homes for sale
- Holston Hills, Knoxville homes for sale
- Lincoln Park, Knoxville homes for sale
- Linwood, Knoxville homes for sale
- Lonsdale, Knoxville homes for sale
- Mascot, Mascot homes for sale
- Norris Shores, Sharps Chapel homes for sale
- North Hills, Knoxville homes for sale
- North Knoxville, Knoxville homes for sale
- Oakwood, Knoxville homes for sale
- Old North Knoxville, Knoxville homes for sale
- Park City, Knoxville homes for sale
- Parkridge, Knoxville homes for sale
- Sterchi Hills, Knoxville homes for sale
- Timberlake, Knoxville homes for sale
Corbin, KY - homes for sale
126 of 126 results displayed
- New
 $439,000Active4 beds 3 baths2,809 sq. ft.
585 Standard Avenue, Corbin, KY 40701
MLS# 26013084Listed by: REVOLUTION REALTY, LLC - New
 $145,000Active3 beds 2 baths1,416 sq. ft.
660 Oaklawn Circle, Corbin, KY 40701
MLS# 26013065Listed by: RE/MAX ON MAIN, INC - New
 $259,900Active4 beds 3 baths1,400 sq. ft.
50 Moore Hill Avenue, Corbin, KY 40701
MLS# 26013056Listed by: KELLER WILLIAMS COMMONWEALTH - STANFORD - New
 $165,000Active3 beds 1 baths1,354 sq. ft.
48 London Avenue, Corbin, KY 40701
MLS# 26012791Listed by: SHAWN ROGERS REALTY, INC  $129,000Pending3 beds 2 baths1,516 sq. ft.
704 Barbourville Street, Corbin, KY 40701
MLS# 26012664Listed by: HUDDLESTON REAL ESTATE- New
 $199,900Active3 beds 1 baths1,079 sq. ft.
1039 Cardinal Drive, Corbin, KY 40701
MLS# 26012665Listed by: HUDDLESTON REAL ESTATE - New
 $225,000Active3 beds 2 baths1,970 sq. ft.
1018 Cardinal Drive, Corbin, KY 40701
MLS# 26012089Listed by: WEICHERT REALTORS - FORD BROTHERS  $59,000Pending0.92 Acres
218 Bishop Street, Corbin, KY 40701
MLS# 26012385Listed by: NEW BEGINNINGS REAL ESTATE LLC $239,900Pending3 beds 2 baths1,508 sq. ft.
239 Mcfadden Drive, Corbin, KY 40701
MLS# 26012277Listed by: USA REALTY $159,900Active3 beds 2 baths1,524 sq. ft.
306 N Beatty Avenue, Corbin, KY 40701
MLS# 26011967Listed by: FREEMAN BROTHERS REALTY LLC $234,900Active3 beds 1 baths1,704 sq. ft.
2125 Ky-312, Corbin, KY 40701
MLS# 26011857Listed by: USA REALTY $235,000Active3 beds 2 baths1,564 sq. ft.
306 Barton Mill Road, Corbin, KY 40701
MLS# 26011861Listed by: RE/MAX ON MAIN, INC $189,000Active2 beds 1 baths1,207 sq. ft.
460 Browning Acres Road, Corbin, KY 40701
MLS# 26011833Listed by: SHAWN ROGERS REALTY, INC $30,000Pending0.34 Acres
1111 Browning Acres Road #Lot 9, Corbin, KY 40701
MLS# 26011834Listed by: SHAWN ROGERS REALTY, INC $249,900Active4 beds 3 baths2,655 sq. ft.
965 Gordon Hill Pike, Corbin, KY 40701
MLS# 26011827Listed by: HUDDLESTON REAL ESTATE $149,900Active2 beds 1 baths1,408 sq. ft.
1003 Whitley Avenue, Corbin, KY 40701
MLS# 26011714Listed by: HUDDLESTON REAL ESTATE $75,000Active1.65 Acres
999 5th Street Road, Corbin, KY 40701
MLS# 26011730Listed by: HUDDLESTON REAL ESTATE $379,000Active4 beds 4 baths2,587 sq. ft.
129 Ridge Point Lane, Corbin, KY 40701
MLS# 26011642Listed by: RELIANCE ONE REALTY $279,900Active4 beds 3 baths3,016 sq. ft.
1429 Gordon Hill Pike, Corbin, KY 40701
MLS# 26011610Listed by: FREEMAN BROTHERS REALTY LLC $159,900Pending4 beds 2 baths2,560 sq. ft.
1290 Bacon Creek Road, Corbin, KY 40701
MLS# 26011560Listed by: HUDDLESTON REAL ESTATE $325,000Active3 beds 2 baths1,939 sq. ft.
229 Cherry Avenue, Corbin, KY 40701
MLS# 26011567Listed by: HUDDLESTON REAL ESTATE $164,000Pending4 beds 2 baths2,184 sq. ft.
137 Felts School Road, Corbin, KY 40701
MLS# 26011390Listed by: WRIGHT PREMIER REALTY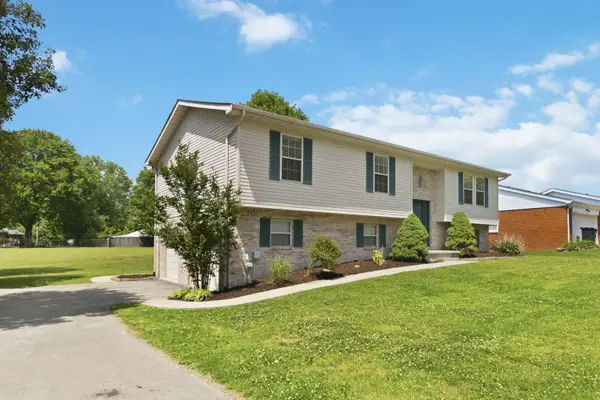
 $265,000Pending3 beds 3 baths2,000 sq. ft.
604 John Street, Corbin, KY 40701
MLS# 26011363Listed by: CENTURY 21 ADVANTAGE REALTY $800,000Active5 beds 5 baths5,508 sq. ft.
80 Seven Oaks, Corbin, KY 40701
MLS# 26011302Listed by: WEICHERT REALTORS FORD BROTHERS, INC. $849,900Active4 beds 3 baths4,313 sq. ft.
404 Ford Street, Corbin, KY 40701
MLS# 26011265Listed by: CENTURY 21 ADVANTAGE REALTY $99,900Pending2 beds 1 baths960 sq. ft.
1326 Bacon Creek Road, Corbin, KY 40701
MLS# 26011210Listed by: HUDDLESTON REAL ESTATE $214,900Active4 beds 2 baths2,128 sq. ft.
1195 State Hwy 3041, Corbin, KY 40701
MLS# 26011186Listed by: HUDDLESTON REAL ESTATE $168,000Active4 beds 3 baths2,856 sq. ft.
2721 Ky-26, Corbin, KY 40701
MLS# 26011125Listed by: FREEMAN BROTHERS REALTY LLC $1,179,000Pending4 beds 6 baths6,394 sq. ft.
602 Cecil Wyatt Road, Corbin, KY 40701
MLS# 26010982Listed by: PLUM TREE REALTY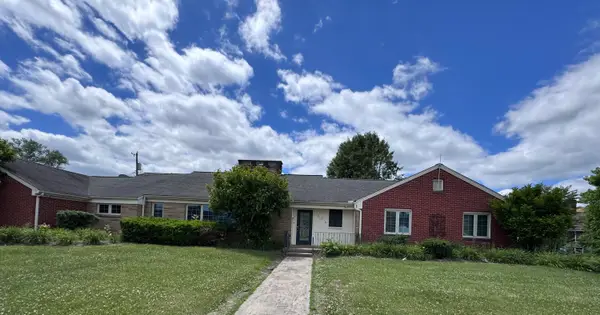 $295,000Active4 beds 3 baths2,512 sq. ft.
504 S Kentucky Avenue, Corbin, KY 40701
MLS# 26010990Listed by: RE/MAX ON MAIN, INC $159,000Active4 beds 2 baths1,410 sq. ft.
302 W 7th Street, Corbin, KY 40701
MLS# 26010908Listed by: FREEMAN BROTHERS REALTY LLC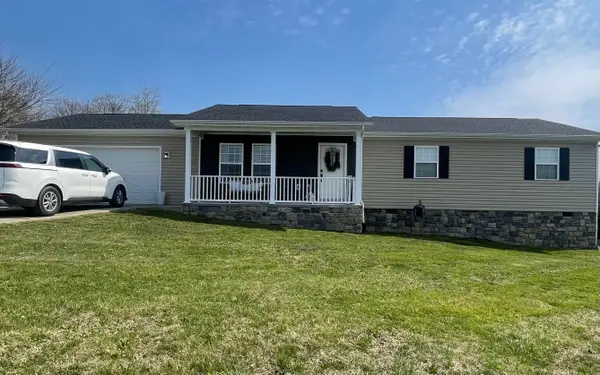 $242,900Active3 beds 2 baths1,492 sq. ft.
25 Hickory Hill Drive, Corbin, KY 40701
MLS# 26010859Listed by: WEICHERT REALTORS FORD BROTHERS, INC. $295,000Active3 beds 3 baths2,036 sq. ft.
1107 Circle Drive, Corbin, KY 40701
MLS# 26010788Listed by: HUDDLESTON REAL ESTATE $229,900Active3 beds 2 baths1,232 sq. ft.
179 Ridge Point Lane, Corbin, KY 40701
MLS# 26009763Listed by: SESTER & CO REALTY $310,000Active2 beds 1 baths1,011 sq. ft.
1731 W Gordon Hill Pike, Corbin, KY 40701
MLS# 26009444Listed by: SESTER & CO REALTY $130,000Pending3 beds 1 baths1,560 sq. ft.
3007 S Kentucky Avenue, Corbin, KY 40701
MLS# 26009362Listed by: WEICHERT REALTORS - FORD BROTHERS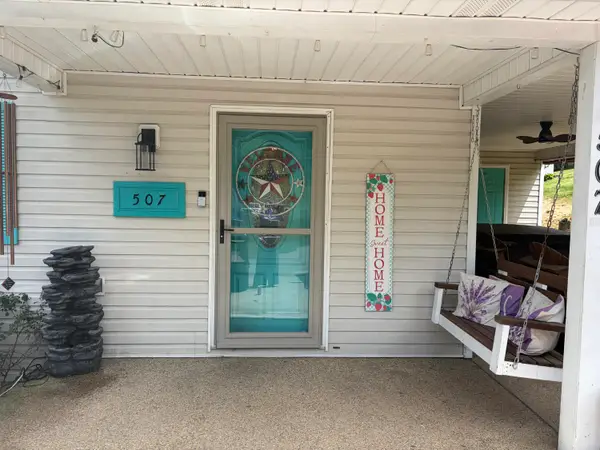 $195,000Active3 beds 3 baths1,344 sq. ft.
507 Swan Street, Corbin, KY 40701
MLS# 26009245Listed by: CENTURY 21 ADVANTAGE REALTY $140,000Pending3 beds 2 baths1,564 sq. ft.
122 Bishop Street, Corbin, KY 40701
MLS# 26009023Listed by: FREEMAN BROTHERS REALTY LLC $225,000Active3 beds 2 baths1,853 sq. ft.
912 Barbourville Street, Corbin, KY 40701
MLS# 26008897Listed by: SHAWN ROGERS REALTY, INC $160,000Active2 beds 1 baths777 sq. ft.
103 W 14th Street, Corbin, KY 40701
MLS# 26008564Listed by: WTC REALTY LLC $149,000Active3 beds 1 baths1,454 sq. ft.
508 College Street, Corbin, KY 40701
MLS# 26008571Listed by: REVOLUTION REALTY, LLC $170,000Pending3 beds 1 baths1,255 sq. ft.
107 Padgett Street, Corbin, KY 40701
MLS# 26008476Listed by: WTC REALTY LLC $274,900Pending4 beds 3 baths2,023 sq. ft.
1512 Maple Lane, Corbin, KY 40701
MLS# 26008372Listed by: SALLIE DAVIDSON, REALTORS $168,000Active3 beds 1 baths1,064 sq. ft.
506 Chestnut Street, Corbin, KY 40701
MLS# 26008293Listed by: FREEMAN BROTHERS REALTY LLC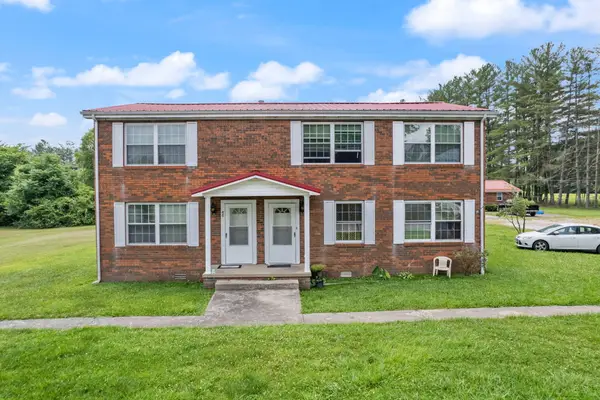 $520,000Active13 beds 8 baths6,298 sq. ft.
46, 58, 66 Dantley Drive, Corbin, KY 40701
MLS# 26008266Listed by: WTC REALTY LLC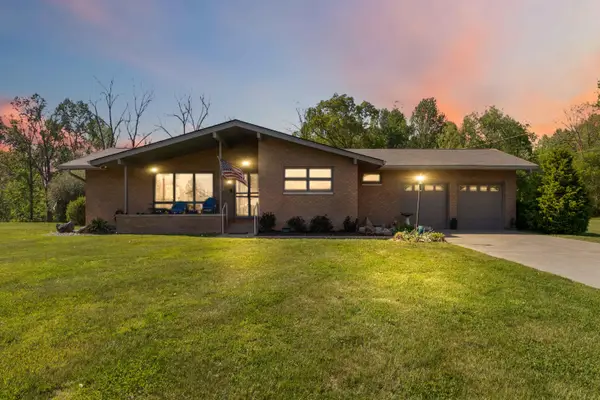 $348,500Active2 beds 2 baths2,623 sq. ft.
1108 Meadow Lane, Corbin, KY 40701
MLS# 26008255Listed by: KELLER WILLIAMS LEGACY GROUP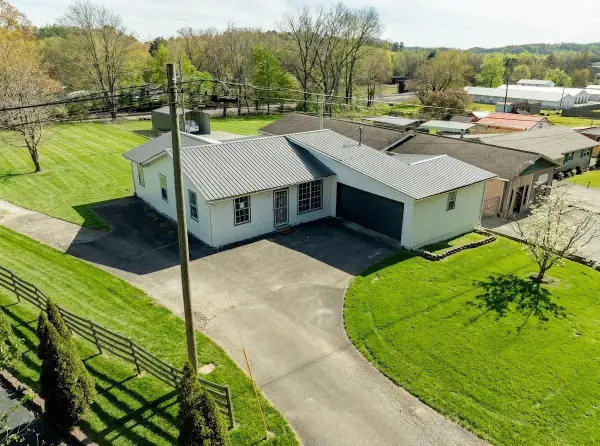 $199,900Active3 beds 2 baths1,449 sq. ft.
187 Industrial Boulevard, Corbin, KY 40701
MLS# 26008155Listed by: RE/MAX COUNTRY LAKES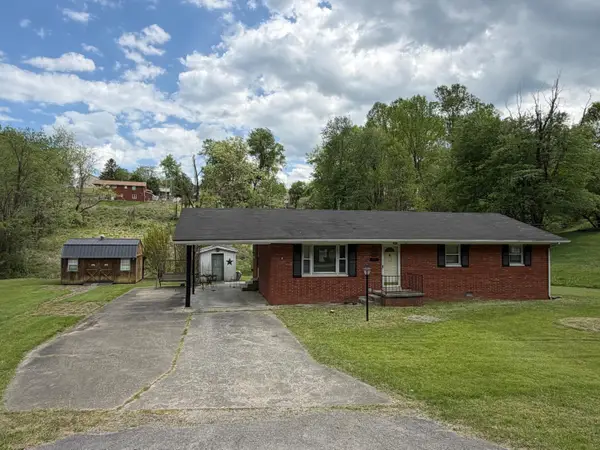 $149,900Active3 beds 1 baths1,344 sq. ft.
112 N Earls Avenue, Corbin, KY 40701
MLS# 26008178Listed by: HUDDLESTON REAL ESTATE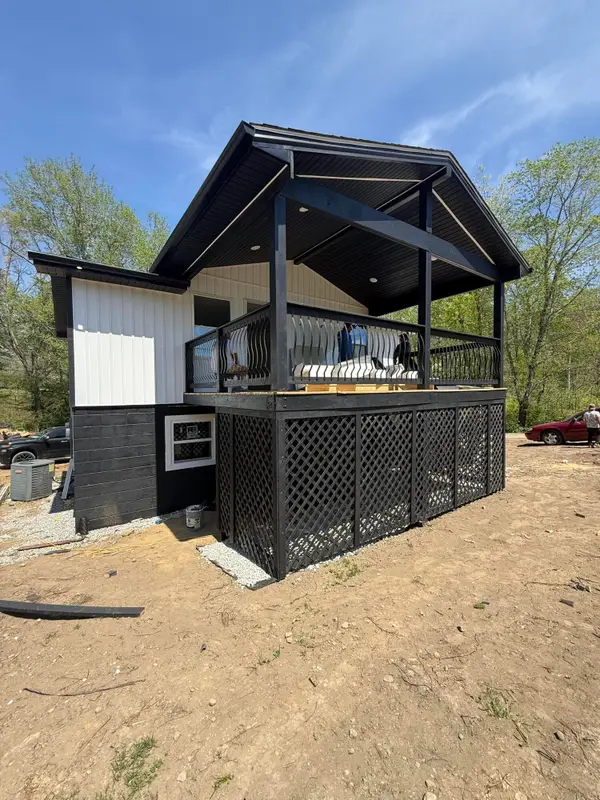 $179,900Pending3 beds 3 baths1,400 sq. ft.
42 Moore Hill Avenue, Corbin, KY 40701
MLS# 26008134Listed by: KELLER WILLIAMS COMMONWEALTH - STANFORD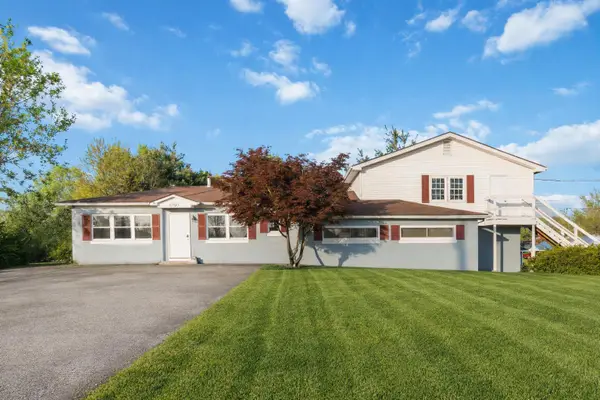 $319,000Active8 beds 5 baths2,960 sq. ft.
8797 State Highway 1232, Corbin, KY 40701
MLS# 26008094Listed by: CENTURY 21 ADVANTAGE REALTY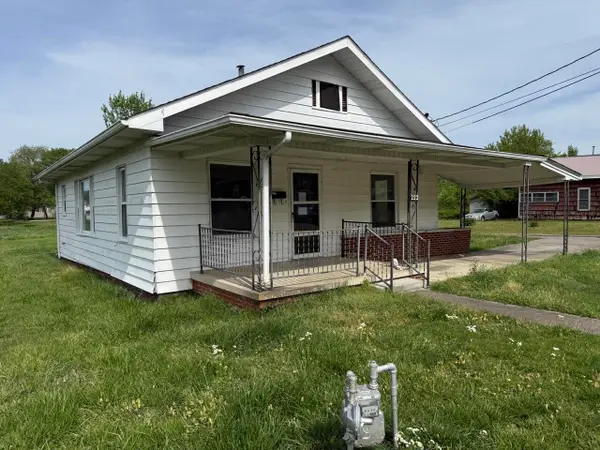 $59,900Active2 beds 2 baths986 sq. ft.
222 Hamlin Avenue, Corbin, KY 40701
MLS# 26007963Listed by: CENTURY 21 PINNACLE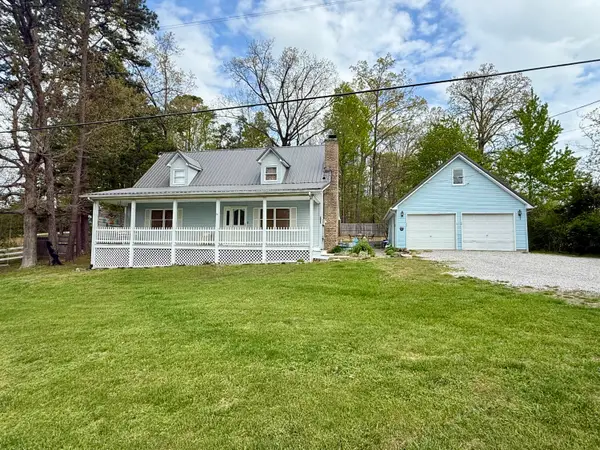 $269,500Active3 beds 3 baths1,680 sq. ft.
2308 Ky-312, Corbin, KY 40701
MLS# 26007711Listed by: HUDDLESTON REAL ESTATE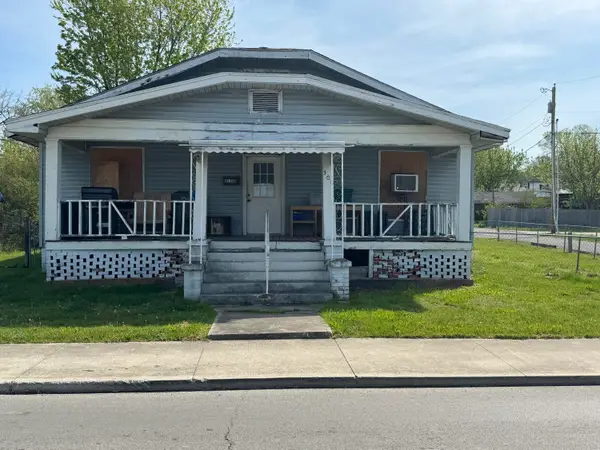 $70,000Active3 beds 2 baths1,543 sq. ft.
305 Hamlin Avenue, Corbin, KY 40701
MLS# 26007645Listed by: SHAWN ROGERS REALTY, INC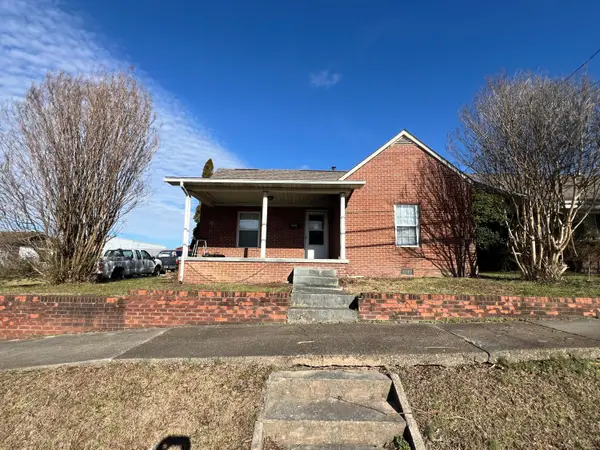 $270,000Active2 beds 1 baths1,255 sq. ft.
905 S Kentucky Avenue, Corbin, KY 40701
MLS# 26007343Listed by: SHAWN ROGERS REALTY, INC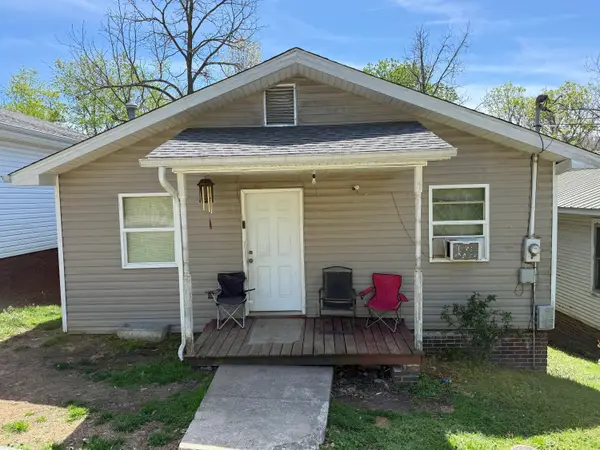 $115,000Active2 beds 1 baths1,092 sq. ft.
413 W 15th Street, Corbin, KY 40701
MLS# 26007326Listed by: CENTURY 21 ADVANTAGE REALTY $229,500Active3 beds 2 baths2,061 sq. ft.
710 E Bryant Street, Corbin, KY 40701
MLS# 26007126Listed by: CENTURY 21 ADVANTAGE REALTY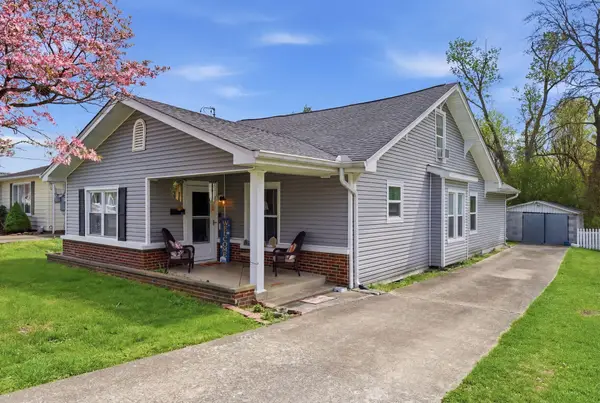 $230,000Pending4 beds 2 baths1,700 sq. ft.
313 W 8th Street, Corbin, KY 40701
MLS# 26006507Listed by: LOCKHART REALTY GROUP, LLC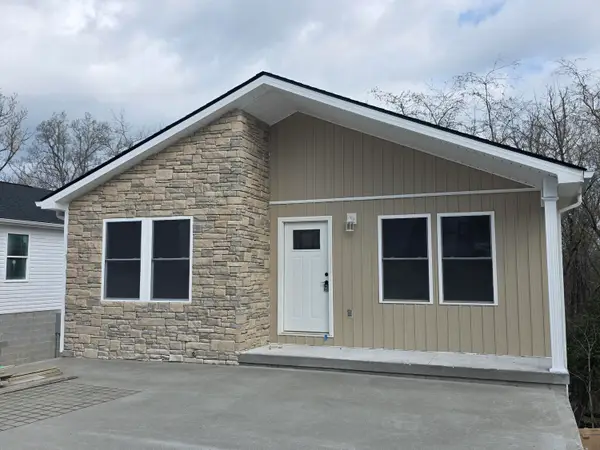 $199,000Active3 beds 2 baths1,300 sq. ft.
616 Gordon Street, Corbin, KY 40701
MLS# 26006572Listed by: BLACK DIAMOND REALTY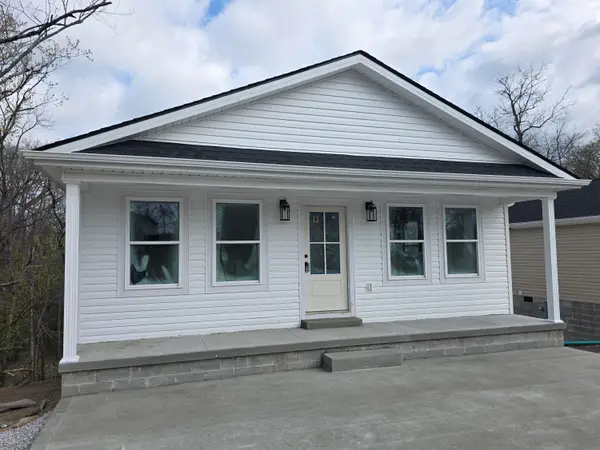 $197,000Active3 beds 2 baths1,250 sq. ft.
618 Gordon Street, Corbin, KY 40701
MLS# 26006573Listed by: BLACK DIAMOND REALTY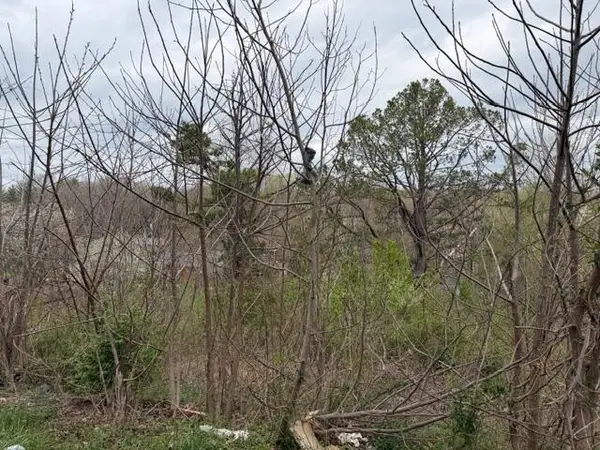 $18,000Active0.26 Acres
Lot 40 Mcfadden Drive, Corbin, KY 40701
MLS# 26006558Listed by: SHAWN ROGERS REALTY, INC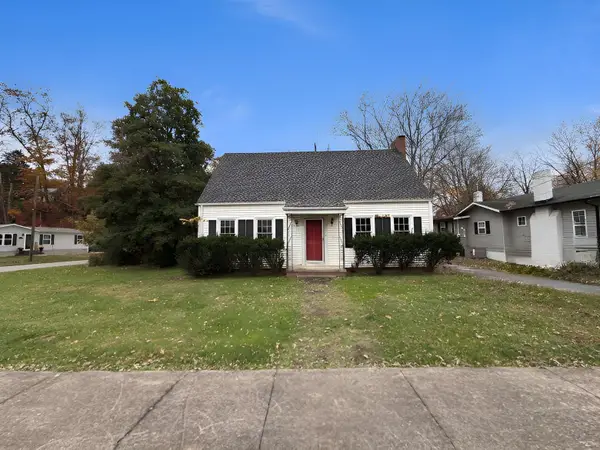 $109,950Active3 beds 1 baths1,850 sq. ft.
510 Oak Avenue, Corbin, KY 40701
MLS# 26006421Listed by: EXIT TOWN & COUNTRY REALTORS $142,000Active4 beds 2 baths1,521 sq. ft.
126 S Combs Avenue, Corbin, KY 40701
MLS# 26006177Listed by: SHAWN ROGERS REALTY, INC $4,300,000Active36.16 Acres
2628 Cumberland Falls Highway, Corbin, KY 40701
MLS# 26005773Listed by: WTC REALTY LLC $333,333Active4 beds 4 baths3,906 sq. ft.
32 Meadow Brook Drive, Corbin, KY 40701
MLS# 26005554Listed by: RELIANCE ONE REALTY $229,000Pending4 beds 3 baths1,564 sq. ft.
261 Oak Ridge Church Road, Corbin, KY 40701
MLS# 26005518Listed by: CENTURY 21 ADVANTAGE REALTY $190,000Active3 beds 2 baths1,872 sq. ft.
538 Oaklawn Circle, Corbin, KY 40701
MLS# 26005447Listed by: SHAWN ROGERS REALTY, INC $129,900Active3 beds 2 baths1,248 sq. ft.
401 Lee Street, Corbin, KY 40701
MLS# 26005272Listed by: HUDDLESTON REAL ESTATE $135,000Pending2 beds 1 baths896 sq. ft.
720 Green Street, Corbin, KY 40701
MLS# 26005177Listed by: BLACK DIAMOND REALTY $525,000Active5 beds 4 baths6,032 sq. ft.
808 W Holly Lane, Corbin, KY 40701
MLS# 26004304Listed by: CENTURY 21 ADVANTAGE REALTY $159,900Active3 beds 2 baths1,320 sq. ft.
201 Union Street, Corbin, KY 40701
MLS# 26004908Listed by: CENTURY 21 ADVANTAGE REALTY $175,000Active4 beds 3 baths1,920 sq. ft.
904 W 5th Street, Corbin, KY 40701
MLS# 26004739Listed by: CENTURY 21 ADVANTAGE REALTY $235,000Pending4 beds 3 baths1,916 sq. ft.
235 Stony Brook Drive, Corbin, KY 40701
MLS# 26004644Listed by: HUDDLESTON REAL ESTATE $250,000Pending3 beds 3 baths2,500 sq. ft.
37 Skylark Drive, Corbin, KY 40701
MLS# 26004503Listed by: FREEMAN BROTHERS REALTY LLC $295,000Active34.96 Acres
9999 3041 (corbin Bypass) Highway, Corbin, KY 40701
MLS# 26004089Listed by: BLACK DIAMOND REALTY $129,900Pending4 beds 2 baths1,590 sq. ft.
1398 Mckinley Avenue, Corbin, KY 40701
MLS# 26003843Listed by: EXIT TOWN & COUNTRY REALTORS $169,900Pending3 beds 2 baths1,578 sq. ft.
418 15th Street, Corbin, KY 40701
MLS# 26003109Listed by: CENTURY 21 ADVANTAGE REALTY $230,000Active3 beds 2 baths1,164 sq. ft.
300 Scott Road, Corbin, KY 40701
MLS# 26003039Listed by: WILLIAMS ELITE REALTY $179,000Active2 beds 1 baths1,553 sq. ft.
1086 Moore Hill Avenue, Corbin, KY 40701
MLS# 26002883Listed by: HUDDLESTON REAL ESTATE $100,000Active11 Acres
0 Foley Road, Corbin, KY 40701
MLS# 26002434Listed by: NEW BEGINNINGS REAL ESTATE LLC $139,900Active3 beds 1 baths1,383 sq. ft.
321 Hamlin Street, Corbin, KY 40701
MLS# 26002406Listed by: HUDDLESTON REAL ESTATE $124,900Pending3 beds 2 baths1,104 sq. ft.
1331 Old Barbourville Road, Corbin, KY 40701
MLS# 26002237Listed by: CENTURY 21 PINNACLE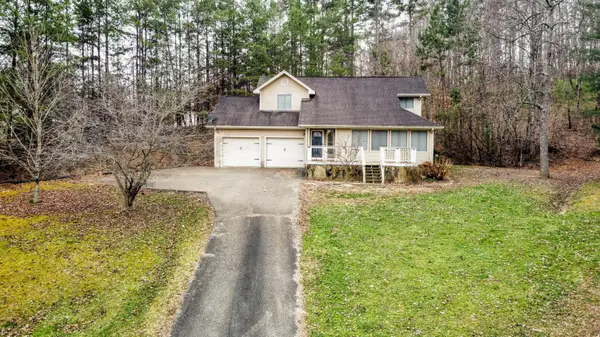 $249,900Active3 beds 3 baths1,873 sq. ft.
71 Renee Street, Corbin, KY 40701
MLS# 26001676Listed by: RE/MAX ON MAIN, INC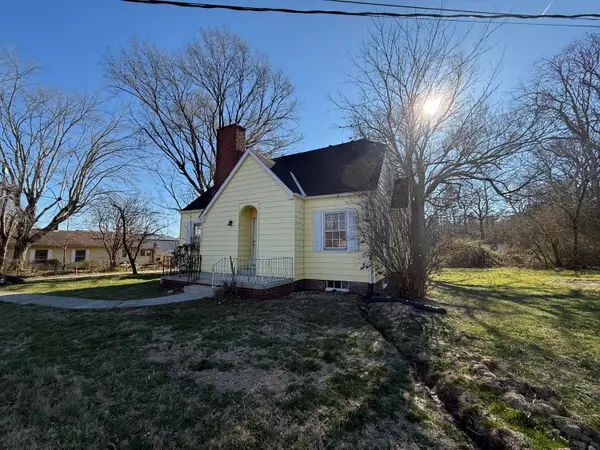 $75,000Pending3 beds 2 baths1,500 sq. ft.
1147 Ky-1223, Corbin, KY 40701
MLS# 26001438Listed by: FREEMAN BROTHERS REALTY LLC $149,000Active3 beds 1 baths1,265 sq. ft.
518 17th Street, Corbin, KY 40701
MLS# 26010706Listed by: RELIANCE ONE REALTY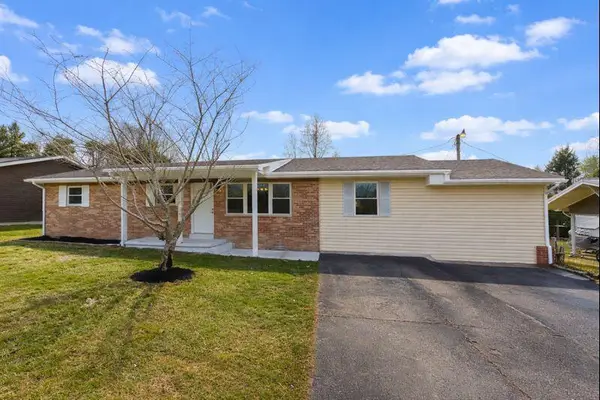 $209,000Pending4 beds 2 baths1,768 sq. ft.
811 Hancock Avenue, Corbin, KY 40701
MLS# 26000473Listed by: HUDDLESTON REAL ESTATE $12,000Active0.46 Acres
9999 Wandaland Subdivision, Corbin, KY 40701
MLS# 25508270Listed by: RELIANCE ONE REALTY $45,900Active2 beds 1 baths845 sq. ft.
122 18th Street, Corbin, KY 40701
MLS# 25508135Listed by: LOCKHART REALTY GROUP, LLC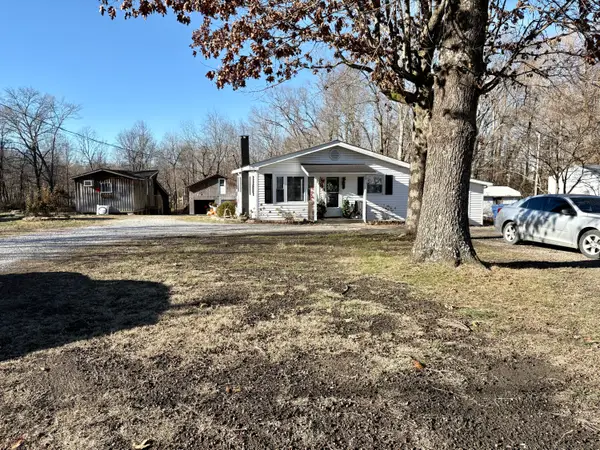 $169,000Pending3 beds 1 baths1,130 sq. ft.
207 Foley Road, Corbin, KY 40701
MLS# 25508125Listed by: LOCKHART REALTY GROUP, LLC $20,000Active0.46 Acres
9999 Chestnut Street, Corbin, KY 40701
MLS# 25507421Listed by: RE/MAX ON MAIN, INC $154,900Pending3 beds 1 baths1,320 sq. ft.
501 Walnut Avenue, Corbin, KY 40701
MLS# 25507233Listed by: SALLIE DAVIDSON, REALTORS $32,000Active0.77 Acres
9999 Shiner Hill Phase Ii Lot #42, Williamsburg, KY 40769
MLS# 24007909Listed by: RE/MAX ON MAIN, INC $212,000Active4 beds 2 baths1,792 sq. ft.
105 Dantley Drive, Corbin, KY 40701
MLS# 25506273Listed by: HUDDLESTON REAL ESTATE $37,500Pending2 Acres
457 Scuffletown Road, Corbin, KY 40701
MLS# 25505392Listed by: NEW BEGINNINGS REAL ESTATE LLC $165,000Pending3 beds 1 baths1,354 sq. ft.
48 London Avenue, Corbin, KY 40701
MLS# 25505047Listed by: SESTER & CO REALTY $115,000Pending2 beds 1 baths800 sq. ft.
311 Andrews Street, Corbin, KY 40701
MLS# 25504738Listed by: KY REAL ESTATE PROFESSIONALS, LLC $324,900Pending5 beds 3 baths2,544 sq. ft.
1605 Gordon Hill Pike, Corbin, KY 40701
MLS# 25504640Listed by: HUDDLESTON REAL ESTATE $259,500Pending4 beds 3 baths2,338 sq. ft.
418 E Engineer Street, Corbin, KY 40701
MLS# 25504042Listed by: RE/MAX ON MAIN, INC $259,000Active3 beds 2 baths1,500 sq. ft.
710 Adams Street, Corbin, KY 40701
MLS# 25503961Listed by: RELIANCE ONE REALTY $349,000Active3 beds 4 baths2,594 sq. ft.
1211 Forest Cir Drive, Corbin, KY 40701
MLS# 26008017Listed by: RELIANCE ONE REALTY $599,900Active2 Acres
1 Corbin Center Drive, Corbin, KY 40701
MLS# 25503650Listed by: HUDDLESTON REAL ESTATE $209,000Active3 beds 2 baths1,200 sq. ft.
1700 Gordon Hill Pike, Corbin, KY 40701
MLS# 25502778Listed by: HUDDLESTON REAL ESTATE $1,200,000Active12.89 Acres
9999 Ky 3041 Corbin Bypass, Corbin, KY 40701
MLS# 25502678Listed by: WEICHERT REALTORS - FORD BROTHERS $99,500Pending2.24 Acres
9999 Hwy 26, Corbin, KY 40701
MLS# 24010465Listed by: RE/MAX ON MAIN, INC $14,500Pending0.25 Acres
1638 5th Street, Corbin, KY 40701
MLS# 20012900Listed by: CENTURY 21 ADVANTAGE REALTY $184,500Active4.5 Acres
2984 Cumberland Falls Highway, Corbin, KY 40701
MLS# 24016444Listed by: SALLIE DAVIDSON, REALTORS $3,500,000Active50 Acres
2502 Cumberland Falls Highway, Corbin, KY 40701
MLS# 23011055Listed by: WTC REALTY LLC $1,995,000Active31.5 Acres
349 Woodchase Lane, Corbin, KY 40701
MLS# 23011094Listed by: WTC REALTY LLC $995,000Active13.45 Acres
600 Summit Drive, Corbin, KY 40701
MLS# 23011097Listed by: WTC REALTY LLC $75,000Active0.45 Acres
9999 Cumberland Falls Highway, Corbin, KY 40701
MLS# 24023552Listed by: HUDDLESTON REAL ESTATE $675,000Active5.23 Acres
3021 Cumberland Falls Highway, Corbin, KY 40701
MLS# 25002727Listed by: RE/MAX ON MAIN, INC $450,000Active20.21 Acres
195 Bacon Creek Road, Corbin, KY 40701
MLS# 20019141Listed by: RE/MAX ON MAIN, INC $310,000Active79 Acres
9 Bacon Creek Road, Corbin, KY 40701
MLS# 20019292Listed by: RE/MAX ON MAIN, INC $138,000Active0.45 Acres
97 S 1223 Highway, Corbin, KY 40701
MLS# 20125187Listed by: RE/MAX ON MAIN, INC $35,000Active0.67 Acres
3 Weldon Pointe, Corbin, KY 40701
MLS# 22009279Listed by: RE/MAX ON MAIN, INC $650,000Active12.84 Acres
2690 N 1223 Highway, Corbin, KY 40701
MLS# 22012796Listed by: RE/MAX ON MAIN, INC $69,000Active0.6 Acres
204 15th Street, Corbin, KY 40701
MLS# 23000591Listed by: HUDDLESTON REAL ESTATE $1,626,000Active8.13 Acres
141 E Cumberland Gap Parkway, Corbin, KY 40701
MLS# 23018405Listed by: SHAWN ROGERS REALTY, INC $1,250,000Active1.02 Acres
LOT 1 Cumberland Gap Pkwy, Corbin, KY 40701
MLS# 24011118Listed by: RE/MAX ON MAIN, INC $99,900Active-- beds -- baths
1745 5th Street Road, Corbin, KY 40701
MLS# 25000823Listed by: SALLIE DAVIDSON, REALTORS $3,600,000Active5.97 Acres
999 Cumberland Falls Highway, Corbin, KY 40701
MLS# 95462Listed by: RE/MAX ON MAIN, INC $239,000Active3 beds 2 baths1,930 sq. ft.
275 Oaklawn Circle, Corbin, KY 40701
MLS# 25018804Listed by: USA REALTY $165,000Pending6 beds 4 baths4,350 sq. ft.
400 Collins Lane, Corbin, KY 40701
MLS# 25003745Listed by: PATRIOT REAL ESTATE $599,000Active3 beds 3 baths3,891 sq. ft.
98 E Wyrick Street, Corbin, KY 40701
MLS# 26002041Listed by: RELIANCE ONE REALTY $99,000Pending3 beds 2 baths1,300 sq. ft.
1331 Old Barbourville Road, Corbin, KY 40701
MLS# 25017990Listed by: JOANN BAKER & ASSOCIATES $65,000Active1.67 Acres
111 Terrell Road, Corbin, KY 40701
MLS# 24016637Listed by: WOOD REALTY SERVICES $75,000Active0.92 Acres
3475 Cumberland Falls Highway, Corbin, KY 40701
MLS# 26000301Listed by: BLACK DIAMOND REALTY
Local realty services provided by:CENTURY 21 Virginia Wilder Real Estate
Neighborhoods near Corbin, KY
Zip codes near Corbin, KY
- 40701 homes for sale
- 40729 homes for sale
- 40734 homes for sale
- 40737 homes for sale
- 40740 homes for sale
- 40741 homes for sale
- 40744 homes for sale
- 40759 homes for sale
- 40769 homes for sale
- 40906 homes for sale
- 40923 homes for sale
- 40935 homes for sale
- 40940 homes for sale
- 40949 homes for sale
- 40962 homes for sale
- 40977 homes for sale
- 42501 homes for sale
- 42519 homes for sale
- 42635 homes for sale
- 42653 homes for sale
Popular searches near Corbin, KY
- Barbourville homes for sale
- Bryants Store homes for sale
- Bush homes for sale
- Camp Ground homes for sale
- Cannon homes for sale
- Colony homes for sale
- Corbin homes for sale
- Cumberland Falls homes for sale
- Girdler homes for sale
- Gray homes for sale
- Heidrick homes for sale
- Keavy homes for sale
- Lily homes for sale
- London homes for sale
- Mt Victory homes for sale
- North Corbin homes for sale
- Rockholds homes for sale
- Siler homes for sale
- Williamsburg homes for sale
- Woollum homes for sale
Protect your home and budget from life's surprises with an Assurant Home Warranty, backed by a partner that supports you through every step of homeownership. Explore Plans.
©2026 Century 21 Real Estate LLC. All rights reserved. CENTURY 21®, the CENTURY 21 Logo and C21® are service marks owned by Century 21 Real Estate LLC. Century 21 Real Estate LLC fully supports the principles of the Fair Housing Act and the Equal Opportunity Act. Each office is independently owned and operated. Listing information is deemed reliable but not guaranteed accurate.